Evolution of All-Atom Protein Force Fields to Improve Local and Global Properties
- PMID: 30990694
- PMCID: PMC7507668
- DOI: 10.1021/acs.jpclett.9b00850
Evolution of All-Atom Protein Force Fields to Improve Local and Global Properties
Abstract
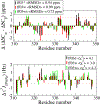
Experimental studies on intrinsically disordered and unfolded proteins have shown that in isolation they typically have low populations of secondary structure and exhibit distance scalings suggesting that they are at near-theta-solvent conditions. Until recently, however, all-atom force fields failed to reproduce these fundamental properties of intrinsically disordered proteins (IDPs). Recent improvements by refining against ensemble-averaged experimental observables for polypeptides in aqueous solution have addressed deficiencies including secondary structure bias, global conformational properties, and thermodynamic parameters of biophysical reactions such as folding and collapse. To date, studies utilizing these improved all-atom force fields have mostly been limited to a small set of unfolded or disordered proteins. Here, we present data generated for a diverse library of unfolded or disordered proteins using three progressively improved generations of Amber03 force fields, and we explore how global and local properties are affected by each successive change in the force field. We find that the most recent force field refinements significantly improve the agreement of the global properties such as radii of gyration and end-to-end distances with experimental estimates. However, these global properties are largely independent of the local secondary structure propensity. This result stresses the need to validate force fields with reference to a combination of experimental data providing information about both local and global structure formation.
Figures


Similar articles
-
Development of Charge-Augmented Three-Point Water Model (CAIPi3P) for Accurate Simulations of Intrinsically Disordered Proteins.Int J Mol Sci. 2020 Aug 26;21(17):6166. doi: 10.3390/ijms21176166. Int J Mol Sci. 2020. PMID: 32859072 Free PMC article.
-
Extensive tests and evaluation of the CHARMM36IDPSFF force field for intrinsically disordered proteins and folded proteins.Phys Chem Chem Phys. 2019 Oct 9;21(39):21918-21931. doi: 10.1039/c9cp03434j. Phys Chem Chem Phys. 2019. PMID: 31552948 Free PMC article.
-
Comparison and Evaluation of Force Fields for Intrinsically Disordered Proteins.J Chem Inf Model. 2020 Oct 26;60(10):4912-4923. doi: 10.1021/acs.jcim.0c00762. Epub 2020 Aug 28. J Chem Inf Model. 2020. PMID: 32816485
-
Molecular Dynamics Simulations Combined with Nuclear Magnetic Resonance and/or Small-Angle X-ray Scattering Data for Characterizing Intrinsically Disordered Protein Conformational Ensembles.J Chem Inf Model. 2019 May 28;59(5):1743-1758. doi: 10.1021/acs.jcim.8b00928. Epub 2019 Mar 18. J Chem Inf Model. 2019. PMID: 30840442 Review.
-
Force field development and simulations of intrinsically disordered proteins.Curr Opin Struct Biol. 2018 Feb;48:40-48. doi: 10.1016/j.sbi.2017.10.008. Epub 2017 Nov 5. Curr Opin Struct Biol. 2018. PMID: 29080468 Free PMC article. Review.
Cited by
-
Development of Charge-Augmented Three-Point Water Model (CAIPi3P) for Accurate Simulations of Intrinsically Disordered Proteins.Int J Mol Sci. 2020 Aug 26;21(17):6166. doi: 10.3390/ijms21176166. Int J Mol Sci. 2020. PMID: 32859072 Free PMC article.
-
q-Canonical Monte Carlo Sampling for Modeling the Linkage between Charge Regulation and Conformational Equilibria of Peptides.J Phys Chem B. 2019 Aug 15;123(32):6952-6967. doi: 10.1021/acs.jpcb.9b05206. Epub 2019 Aug 7. J Phys Chem B. 2019. PMID: 31362509 Free PMC article.
-
Clustering Heterogeneous Conformational Ensembles of Intrinsically Disordered Proteins with t-Distributed Stochastic Neighbor Embedding.J Chem Theory Comput. 2023 Jul 25;19(14):4711-4727. doi: 10.1021/acs.jctc.3c00224. Epub 2023 Jun 20. J Chem Theory Comput. 2023. PMID: 37338049 Free PMC article.
-
The molecular basis for cellular function of intrinsically disordered protein regions.Nat Rev Mol Cell Biol. 2024 Mar;25(3):187-211. doi: 10.1038/s41580-023-00673-0. Epub 2023 Nov 13. Nat Rev Mol Cell Biol. 2024. PMID: 37957331 Free PMC article. Review.
-
Modeling the Structure and Interactions of Intrinsically Disordered Peptides with Multiple Replica, Metadynamics-Based Sampling Methods and Force-Field Combinations.J Chem Theory Comput. 2022 Mar 8;18(3):1915-1928. doi: 10.1021/acs.jctc.1c00889. Epub 2022 Feb 17. J Chem Theory Comput. 2022. PMID: 35174713 Free PMC article.
References
-
- Ozenne V; Bauer F; Salmon L; Huang J.-r.; Jensen MR; Segard S; Bernadó P; Charavay C; Blackledge M. Flexible-meccano: a tool for the generation of explicit ensemble descriptions of intrinsically disordered proteins and their associated experimental observables. Bioinformatics 2012, 28, 1463–1470. - PubMed
-
- Schneider R; Huang J.-r.; Yao M; Communie G; Ozenne V; Mollica L; Salmon L; Jensen MR; Blackledge M. Towards a robust description of intrinsic protein disorder using nuclear magnetic resonance spectroscopy. Mol. BioSyst 2012, 8, 58–68. - PubMed
-
- Jensen MR; Ruigrok RW; Blackledge M Describing intrinsically disordered proteins at atomic resolution by NMR. Current opinion in structural biology 2013, 23, 426–435. - PubMed
MeSH terms
Substances
Grants and funding
LinkOut - more resources
Full Text Sources

