. 2019 Apr 8;10(1):1617.
doi: 10.1038/s41467-019-09277-9.

A GPX4-dependent cancer cell state underlies the clear-cell morphology and confers sensitivity to ferroptosis

Affiliations

A GPX4-dependent cancer cell state underlies the clear-cell morphology and confers sensitivity to ferroptosis

Yilong Zou et al. Nat Commun. .

Abstract

Clear-cell carcinomas (CCCs) are a histological group of highly aggressive malignancies commonly originating in the kidney and ovary. CCCs are distinguished by aberrant lipid and glycogen accumulation and are refractory to a broad range of anti-cancer therapies. Here we identify an intrinsic vulnerability to ferroptosis associated with the unique metabolic state in CCCs. This vulnerability transcends lineage and genetic landscape, and can be exploited by inhibiting glutathione peroxidase 4 (GPX4) with small-molecules. Using CRISPR screening and lipidomic profiling, we identify the hypoxia-inducible factor (HIF) pathway as a driver of this vulnerability. In renal CCCs, HIF-2α selectively enriches polyunsaturated lipids, the rate-limiting substrates for lipid peroxidation, by activating the expression of hypoxia-inducible, lipid droplet-associated protein (HILPDA). Our study suggests targeting GPX4 as a therapeutic opportunity in CCCs, and highlights that therapeutic approaches can be identified on the basis of cell states manifested by morphological and metabolic features in hard-to-treat cancers.


Conflict of interest statement

S.L.S. is a member of the Board of Directors of the Genomics Institute of the Novartis Research Foundation (GNF); a shareholder and member of the Board of Directors of Jnana Therapeutics; a shareholder of Forma Therapeutics; a shareholder of and adviser to Decibel Therapeutics and Eikonizo Therapeutics; an adviser to Eisai, Inc., the Ono Pharma Foundation, and F-Prime Capital Partners; and a Novartis Faculty Scholar. P.A.C. is an adviser to Pfizer, Inc. S. Signoretti has consulting or advisory role for AstraZeneca/MedImmune, Merck, AACR, NCI; royalties from Biogenex Laboratories; and research funding from AstraZeneca, Exelixis, Bristol-Myers Squibb. T.K.C. receives institutional and personal research funds from AstraZeneca, Bayer, BMS, Cerulean, Eisai, Foundation Medicine Inc., Exelixis, Ipsen, Tracon, Genentech, Roche, Roche Products Limited, GlaxoSmithKline, Merck, Novartis, Peloton, Pfizer, Prometheus Labs, Corvus, Calithera, Analysis Group, Takeda; and receives personal honoraria from AstraZeneca, Alexion, Sanofi/Aventis, Bayer, BMS, Cerulean, Eisai, Foundation Medicine Inc., Exelixis, Genentech, Roche, GlaxoSmithKline, Merck, Novartis, Peloton, Pfizer, EMD Serono, Prometheus Labs, Corvus, Ipsen, Up-to-Date, NCCN, Analysis Group, NCCN, Michael J. Hennessy (MJH) Associates, Inc (Healthcare Communications Company with several brands such as OnClive and PER), L-path, Kidney Cancer Journal, Clinical Care Options, Platform Q, Navinata Healthcare, Harborside Press, American Society of Medical Oncology, NEJM, Lancet Oncology, Heron Therapeutics; and has consulting or advisory role for AstraZeneca, Alexion, Sanofi/Aventis, Bayer, BMS, Cerulean, Eisai, Foundation Medicine Inc., Exelixis, Genentech, Heron Therapeutics, Roche, GlaxoSmithKline, Merck, Novartis, Peloton, Pfizer, EMD Serono, Prometheus Labs, Corvus, Ipsen, Up-to-Date, NCCN, Analysis Group. No speaker’s bureau. No leadership or employment in for-profit companies. Other present or past leadership roles for T.K.C.: Director of GU Oncology Division at Dana-Farber and past President of medical Staff at Dana-Farber), member of NCCN Kidney panel and the GU Steering Committee, past chairman of the Kidney cancer Association Medical and Scientific Steering Committee). No Patents, royalties or other intellectual properties. Travel, accommodations, expenses, in relation to consulting, advisory roles, or honoraria. Medical writing and editorial assistance support may have been funded by Communications companies funded by pharmaceutical companies. The institution (Dana-Farber Cancer Institute) may have received additional independent funding of drug companies or/and royalties potentially involved in research around the subject matter. CV provided upon request for scope of clinical practice and research. The remaining authors declare no competing interests.

Figures
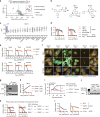
Fig. 1
Fig. 1
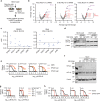
Clear-cell carcinoma cells are intrinsically sensitive to GPX4 inhibition-induced ferroptosis. a Volcano-plot showing compound sensitivity comparison by normalized area-under-curve (AUC) values between clear-cell carcinoma (CCC) cells (n = 26) and other solid tumor cancer cell lines (sCCL) (n = 634) in CTRP. Cpds, compounds. b Chemical structures of GPX4 inhibitors ML210, RSL3, and ML162. c Scatterplot of AUCs for ML210 in sCCL (blue), CCC (red) or cancer cell lines from each tissue. Tissue types are ordered by the average AUC values. Abbreviations: CNS, central nervous system; UAT, upper aerodigestive tract; a_ganglia, autonomic ganglia. Mann–Whitney–Wilcoxon test, ****p < 0.0001. d Viability curves for the indicated cells treated with ML210 or RSL. n = 4. Representative plot of experiments repeated three times. e Viability curves for the indicated cells treated with ML210 or RSL3 plus indicated DMSO, liproxstatin-1 (Lip-1) or ferrostatin-1 (Fer-1). Representative plot of experiments repeated three times. f Fluorescent images of BODIPY-C11 stained 786-O, 769-P, and BFTC909 cells treated with ML210 plus DMSO or Lip-1 for the indicated time periods. Scale bars: 10 µm. g Immunoblot showing GPX4 protein levels in GPX4+/+ 786-O or GPX4−/− clones 3A2 and 3A7. h Viability curves for WT 786-O, 3A2, and 3A7 over a 2.5-day time course after Fer-1 removal. Representative plot of experiments repeated three times. i Tumor volume measurements of subcutaneous xenografts of WT 786-O or GPX4−/− 3A2 cells (n = 10 mice, two tumors per mouse). GPX4−/− tumor-bearing mice were divided to a Lip-1 treated group and a vehicle-treated group. Treatment lasted for the first 10 days. Two-tailed t-test, ***p < 0.001, ****p < 0.0001. j Immunoblot showing HIF-2α protein levels in primary human ccRCC cell lines CCLF_KIPA_0001_T, CCLF_KIPA_0002_T, and normal renal-cell culture CCLF_KIPA_0001_N matched with CCLF_KIPA_0001_T. k Viability curves for indicated cell lines treated with ML210 or RSL3 plus DMSO or 0.5 µM of Lip-1. n = 4. Representative plot of experiments repeated twice. l Viability curves for ovarian clear-cell carcinoma (OCCC) cell lines ES-2, OVISE, and TOV21G, and high-grade serous carcinoma (HGSC) line OV-90 treated with ML210 (left) or RSL3 (right). n = 4. Representative plot of experiments repeated twice. Error bars: ±s.d. β-Actin was used as loading controls for immunoblots
Fig. 2
Fig. 2
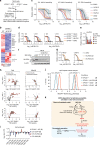
Genome-wide CRISPR screen identifies HIF-2α as a driver of ferroptosis susceptibility. a Experimental scheme describing the genome-wide CRISPR resistance screening to identify mediators of ML210 sensitivity in 786-O cells. b Volcano plot highlighting top enriched CRISPR hits in 786-O cells treated with ML210 for 4, 6 or 8 days. Red genes, HIF pathway genes. Purple genes, representative known ferroptosis regulators. c Relative AUC values of the Cas9/sgRNA (CRISPR) or shRNA (RNAi) transfected 786-O cells treated with a 7-point, 2-fold dilution series of ML210. The viability of cells expressing each sgRNA/shRNA (blue dots) was normalized to the respective DMSO-treated condition. AUC values were normalized to 1 as the total area-under-curve for the concentration range of ML210. d Immunoblot showing the HIF-2α/HIF-1β protein levels in control (sgNC) or EPAS1-targeting sgRNA-expressing 786-O-Cas9 and 769-P-Cas9 cells. e Viability curves of control (sgNC) or EPAS1-targeting sgRNA-expressing 786-O-Cas9 and 769-P-Cas9 cells treated with indicated concentrations of ML210 or RSL3. Representative plot of experiments repeated three times. f Immunoblot showing HIF-2α and HIF-1β protein levels in wildtype (WT, EPAS1+/+) 786-O cells and four EPAS1−/− single-cell clones generated by CRISPR/Cas9. g Viability curves for WT EPAS1+/+ 786-O or EPAS1−/− clones treated with indicated concentrations of ML210 or RSL3. Representative plot of experiments repeated three times. h Viability curves for EPAS1−/− 786-O single-cell clones 1D7 and 1E3 expressing vector or EPAS1-GFP, then treated with indicated concentrations of ML210 or RSL3. Representative plot of experiments repeated three times. β-Actin was used as loading controls in immunoblots
Fig. 3
Fig. 3
HIF-2α selectively enriches polyunsaturated lipids. a Heatmap representing the relative lipid abundances in indicated cell lines. The abundance of each lipid species is normalized to the mean of that in the EPAS1+/+ 786-O WT cells and the ratios are log2 transformed. The lipids are grouped by classes, and within each class, the lipid species are ordered first with increasing carbon number, then with increasing unsaturation levels. Abbreviations: CE, cholesterol ester; Cer, ceramide; MAG, monoacylglycerol; DAG, diacylglycerol; TAG, triacylglycerol; LPC, lysophosphatidylcholine; LPE, lysophosphatidylethanolamine; PC, phosphatidylcholine; PE, phosphatidylethanolamine; ePC, (vinyl ether-linked) PC-plasmalogen; ePE, (vinyl ether-linked) PE-plasmalogen; PI, phosphatidylinositol; PS, phosphatidylserine; SM, sphingomyelin. Blue: down-regulated relative to the WT cells, red: upregulated relative to the WT cells. The wave-like pattern in the TAG class corresponds to the more significant losses in the polyunsaturated fatty acyl (PUFA)-TAGs than saturated/monounsaturated fatty acyl (SFA/MUFA)-TAGs in response to HIF-2α-depletion. S, ferroptosis-sensitive; (R), ferroptosis-resistant. b Volcano plots showing the changes in TAGs grouped as PUFA-TAGs (red fill) and SFA/MUFA-TAGs (white fill) between the indicated cell lines. n = 3, two-tailed t-test. c Volcano plots showing changes in PE and ePE lipids grouped as PUFA-PE/ePEs (red fill) and SFA/MUFA-PE/ePEs (white fill) between the indicated cell lines. d Bar graph representing the relative abundances of the indicated PUFA-PE/ePE lipids in the labeled groups. Log2 fold changes relative to 786-O WT cells are presented for each condition. n = 3, error bars: ±s.d. e Bar graph representing the relative abundances of the indicated free fatty acids grouped as PUFAs or SFA/MUFAs in the indicated conditions. nd, not-detectable under the experimental condition. n = 3, error bars: ±s.d. f Viability curves of 786-O-Cas9 and 769-P-Cas9 cells expressing control (sgNC) or EPAS1-targeting sgRNAs, first treated with BSA or PUFA (arachidonic acid, C20:4) for 3 days, then treated with indicated concentrations of ML210 or RSL3 for 48 h. Representative plot of experiments repeated twice. g The ratios between PUFA-PE/ePE and total PE/ePE (left), and between PUFA-PC/ePC and total PC/ePCs in ccRCC tumor samples (n = 49; red) and the matched normal tissues (n = 49; gray) from previously reported lipidomics datasets. Student’s T-test, ***p < 0.001
Fig. 4
Fig. 4
HILPDA enriches polyunsaturated lipids and promotes ferroptosis sensitivity downstream of HIF-2α. a Scheme summarizing the experimental strategy for identifying the HIF-2α target genes mediating ferroptosis susceptibility in 786-O cells. b Heatmap showing the RNA-Seq analysis of WT 786-O cells and three EPAS1−/− clones (1D1, 1D7, and 1E3). HIF-2α-dependent known lipid metabolism genes are highlighted. c Viability curves of cDNA screening results in EPAS1−/− clones treated with a 7-point, 2-fold dilution series of ML210 or RSL3. Viability is relative to that of each cell line under zero ML210 or RSL3 treatment, respectively. n = 4, error bars are omitted for visual clarity. d Viability curves of HILPDA, G0S2, or EGFP-overexpressing EPAS1−/− 1D1 and 1D7 cells treated with ML210 or RSL3 for 48 h. Viability is relative to the respective DMSO-treated conditions. n = 4, Representative plot of experiments repeated three times. e qRT-PCR analysis of HILPDA mRNA levels in 786-O cells expressing shNC or shHILPDAs. B2M was used as an internal control. n = 3. Student’s T-test. *p < 0.05. f Immunoblot analysis of HILPDA protein levels in 786-O cells expressing shNC or shHILPDAs. β-Actin was used as a loading control. g Viability curves for 786-O cells expressing shNC or two most effective shHILPDAs under indicated concentrations of ML210 or RSL3. Viability is relative to the DMSO-treated conditions, n = 4. Representative plot of experiments repeated three times. h Volcano plots showing the changes in each TAG (left panels) and PE/ePE (right panels) species grouped as PUFA-containing (red fill) or SFA/MUFA-only (white fill) lipids between the indicated cell lines. n = 3. i Bar graph showing the relative abundances of the PUFA-PE/ePEs in the conditions tested. n = 3. S, ferroptosis-sensitive; (R), ferroptosis-resistant. j Lipid droplet abundances analyzed by flow cytometry quantitation of BODIPY-493/503 signal in 1D1 and 1D7 EPAS1−/− cells expressing exogenous EGFP, HILPDA, G0S2 or PLIN2. Representative plot of experiments repeated three times. k Scheme summarizing the molecular network driving the intrinsic GPX4 dependency and ferroptosis susceptibility in clear-cell carcinomas. Abbreviations: PUFA, polyunsaturated fatty acids, e.g. arachidonic acid (C20:4); TAG, triacylglycerols; PE, phosphatidylethanolamine; ePE, vinyl ether-linked PE-plasmalogens. Metabolites highlighted in red indicate promoters of ferroptosis susceptibility. Error bars: ±s.d

Similar articles

Cited by

References

    1. Choueiri TK, Motzer RJ. Systemic therapy for metastatic renal-cell carcinoma. N. Engl. J. Med. 2017;376:354–366. doi: 10.1056/NEJMra1601333. - DOI - PubMed
    1. Sugiyama T, et al. Clinical characteristics of clear cell carcinoma of the ovary: a distinct histologic type with poor prognosis and resistance to platinum-based chemotherapy. Cancer. 2000;88:2584–2589. doi: 10.1002/1097-0142(20000601)88:11<2584::AID-CNCR22>3.0.CO;2-5. - DOI - PubMed
    1. Hasegawa K, et al. Gynecologic Cancer InterGroup (GCIG) consensus review for clear cell carcinoma of the uterine corpus and cervix. Int. J. Gynecol. Cancer.: Off. J. Int. Gynecol. Cancer. Soc. 2014;24:S90–S95. doi: 10.1097/IGC.0000000000000297. - DOI - PubMed
    1. Schroder S, Bocker W. Clear-cell carcinomas of thyroid gland: a clinicopathological study of 13 cases. Histopathology. 1986;10:75–89. doi: 10.1111/j.1365-2559.1986.tb02462.x. - DOI - PubMed
    1. Bannasch P, Ribback S, Su Q, Mayer D. Clear cell hepatocellular carcinoma: origin, metabolic traits and fate of glycogenotic clear and ground glass cells. Hepatobiliary & Pancreat. Dis. INT.: HBPD INT. 2017;16:570–594. doi: 10.1016/S1499-3872(17)60071-7. - DOI - PubMed

Publication types

MeSH terms

Substances