. 2019 Mar 21:10:577.
doi: 10.3389/fmicb.2019.00577. eCollection 2019.

Single-Cell Transcriptome Analysis of CD34+ Stem Cell-Derived Myeloid Cells Infected With Human Cytomegalovirus

Affiliations

Single-Cell Transcriptome Analysis of CD34+ Stem Cell-Derived Myeloid Cells Infected With Human Cytomegalovirus

Melissa Galinato et al. Front Microbiol. .

Abstract

Myeloid cells are important sites of lytic and latent infection by human cytomegalovirus (CMV). We previously showed that only a small subset of myeloid cells differentiated from CD34+ hematopoietic stem cells is permissive to CMV replication, underscoring the heterogeneous nature of these populations. The exact identity of resistant and permissive cell types, and the cellular features characterizing the latter, however, could not be dissected using averaging transcriptional analysis tools such as microarrays and, hence, remained enigmatic. Here, we profile the transcriptomes of ∼7000 individual cells at day 1 post-infection using the 10× genomics platform. We show that viral transcripts are detectable in the majority of the cells, suggesting that virion entry is unlikely to be the main target of cellular restriction mechanisms. We further show that viral replication occurs in a small but specific sub-group of cells transcriptionally related to, and likely derived from, a cluster of cells expressing markers of Colony Forming Unit - Granulocyte, Erythrocyte, Monocyte, Megakaryocyte (CFU-GEMM) oligopotent progenitors. Compared to the remainder of the population, CFU-GEMM cells are enriched in transcripts with functions in mitochondrial energy production, cell proliferation, RNA processing and protein synthesis, and express similar or higher levels of interferon-related genes. While expression levels of the former are maintained in infected cells, the latter are strongly down-regulated. We thus propose that the preferential infection of CFU-GEMM cells may be due to the presence of a pre-established pro-viral environment, requiring minimal optimization efforts from viral effectors, rather than to the absence of specific restriction factors. Together, these findings identify a potentially new population of myeloid cells permissive to CMV replication, and provide a possible rationale for their preferential infection.

Keywords: 10× genomics; RNAseq; cytomegalovirus; myeloid; single-cell; tropism.


Figures

FIGURE 1
FIGURE 1
Susceptibility to CMV infection of non-activated and activated myeloid cell populations differentiated from cord blood CD34+ HSC. Non-activated and activated myeloid cell populations differentiated from the CD34+ HSC of twelve different cord blood donors were exposed to CMV strain TB40/E at an MOI of 10 and analyzed at days 2, 4, 6, 8, and 10 pi. (A,B) Percentage of IE1/IE2+ cells (Log10) present in each population as determined by immunofluorescence staining analyses. (C) Peak (days 6–10) intracellular progeny yields as quantified by titration assays of cell sonicates from paired cultures of non-activated (N-ACT) and activated (ACT) cell populations. Open circles represent data from individual donors obtained in separate experiments. Some donors were used more than once. Blue squares indicate median values at each time point. Red circles depict data obtained from the CD34+ HSC of representative donor 113G.
FIGURE 2
FIGURE 2
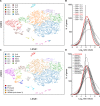
Detection of viral transcripts in a large proportion of cells in the population. (A) t-SNE projections of data from each of the 6,837 profiled activated cells depicted as dots colored based on their content in transcripts mapping to viral ORFs. (B) t-SNE projection of data colored based on their quantitative (Log2 Gene Exp Max) cumulative content in transcripts mapping to the viral ORFs UL122, UL123, UL112/113, UL84, TRS1, UL36, UL37, UL38, UL54, UL44, UL102, UL105, UL70, or UL57. (C–E) Merged representative images of activated myeloid cell populations infected with TB40/E at an MOI of 10, harvested at day 2 pi, and co-stained for IE1/IE2 (green) plus UL84 (red, C), or UL44 (red, D) or UL57 (red, E) and with Hoechst 33342 (blue) to visualize cell nuclei. Cells expressing IE1/IE2+ and the marker protein of interest appear yellow. (F) Percentage of IE1/IE2+ cells co-expressing the UL84, UL44, or UL57 proteins at day 2 pi, manually counted from 5 to 15 images/sample of non-activated and activated myeloid cells in seven independent experiments. Median, median absolute deviation and P-values from unpaired T-tests are shown.
FIGURE 3
FIGURE 3
Identification of cluster 6 as the most closely related to the CMV+ cluster. (A) t-SNE projection of data from profiled activated cells partitioned into clusters by the K-means clustering algorithm using K = 10. (B) Distribution of Log2 ratio values obtained by dividing the mean number of transcripts/cell for each gene in the CMV+ cluster by the mean number of transcripts/cell for each gene in each of the other nine clusters. The distribution with the Log2 mean value closest to zero (dotted vertical line) is depicted by a red line. (C) t-SNE projection of data from profiled cells partitioned into clusters by the K-means clustering algorithm using K = 10, and further sub-divided based on marker gene expression. (D) Distribution of Log2 ratio values, as described in (B), comparing the CMV+ cluster to the other 13 clusters. CL, cluster; Erythro, erythrocytes-megakaryocytes; Mono, monocytes; MDDC, monocyte-derived dendritic cells; LC, Langerhans cells; Promyelo, promyelocytes; Act Neut, activated neutrophils; GEMM, colony-forming unit-granulocyte, erythrocyte, monocyte/macrophage, megakaryocyte.
FIGURE 4
FIGURE 4
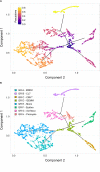
Identification of sub-cluster 3 as the origin of promyelocytes, activated neutrophils, erythrocytes, megakaryocytes, monocytes, and CMV+ cells. (A) Pseudotime ordering of data from cells belonging to the CL7, erythro, mono, MDDC, CMV, promyelo, act neut and sub-cluster 3 groups shown in Figure 3C into a two-dimensional component space using Monocle. The main path of the minimum spanning tree is depicted by solid black lines arising from a central root of cells with a pseudotime of zero (dark blue dots), and branching outward to clusters with higher pseudotime values, representing differentiated cell types (purple, orange, and yellow dots). (B) Cell group labeling based on the expression of key marker genes identified with Seurat. GR, group; MDDC, monocyte-derived dendritic cells; CL7, CL7 from Figure 3C; GEMM, colony-forming unit-granulocyte, erythrocyte, monocyte/macrophage, megakaryocyte; Mono, monocytes; Erythro, erythrocytes; Act Neut, activated neutrophils; Promyelo, promyelocytes.
FIGURE 5
FIGURE 5
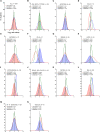
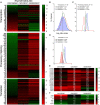
Differential expression of genes belonging to multiple functional categories in GEMM cells, CMV+ cells, and in the rest of the population. Log2 ratio value distributions obtained by dividing the mean number of transcripts/cell for each gene in the CMV+ or GEMM clusters by the mean number of transcripts/cell in the rest of the cells (CMV/REST, green line, and GEMM/REST, blue line) or in GEMM cells (CMV/GEMM, red line). The distribution obtained from all genes is shown in (A), while (B–N) show the distributions of genes falling in each functional category. The Wilcoxon signed rank test was used to identify populations with median values significantly different from zero. The population with the lowest P-value is highlighted by coloring of the area under the curve. The dashed line marks the ratio = 1 point. N, number of genes in each category; ADH/MOTIL/CYTOSK, adhesion/motility/cytoskeleton; IFN, interferon; PROLIF/CELL CYCLE, proliferation/cell cycle; SF-R-SIGNALING, soluble factors/receptors/signaling.
FIGURE 6
FIGURE 6
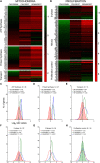
Differential expression of genes with roles in mitochondrial function and proliferation control in GEMM cells, CMV+ cells, and the rest of the population. Heatmap (A,B) and distributions (C–H) of Log2 ratio values obtained by dividing the mean number of transcripts/cell of genes with roles in mitochondrial functions (A,C–E) and in proliferation control (B,F–H) as found in the CMV+ or GEMM clusters by the mean number of transcripts/cell in the rest of the cells (CMV/REST, green line, and GEMM/REST, blue line) or in GEMM cells (CMV/GEMM, red line). The heatmap color scales refer to the Log2 ratio values. The Wilcoxon signed rank test was used to identify populations with median values significantly different from zero. The population with the lowest P-value is highlighted by coloring of the area under the curve. The dashed line marks the ratio = 1 point. N, number of genes in each category.
FIGURE 7
FIGURE 7
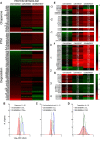
Differential expression of genes with roles in RNA metabolism in GEMM cells, CMV+ cells, and the rest of the population. Heatmap (A,E,F) and distributions (B–D) of Log2 ratio values obtained by dividing the mean number of transcripts/cell of genes with roles in RNA transcription, processing and translation as found in the CMV+ or GEMM clusters by the mean number of transcripts/cell in the rest of the cells (CMV/REST, green line, and GEMM/REST, blue line) or in GEMM cells (CMV/GEMM, red line). The heatmap color scales refer to the Log2 ratio values. Numbers in white font in (E,F) report the Log2 ratio values of each gene. The Wilcoxon signed rank test was used to identify populations with median values significantly different from zero. The population with the lowest P-value is highlighted by coloring of the area under the curve. The dashed line marks the ratio = 1 point. N, number of genes in each category.
FIGURE 8
FIGURE 8
Differential expression of genes with roles in protein metabolism and antigen presentation in GEMM cells, CMV+ cells, and the rest of the population. Heatmap (A,E,F,G) and distributions (B–D) of Log2 ratio values obtained by dividing the mean number of transcripts/cell of genes with roles in protein metabolism as found in the CMV+ or GEMM clusters by the mean number of transcripts/cell in the rest of the cells (CMV/REST, green line, and GEMM/REST, blue line) or in GEMM cells (CMV/GEMM, red line). The heatmap color scales refer to the Log2 ratio values. Numbers in white font in E-G report the Log2 ratio values of each gene. The Wilcoxon signed rank test was used to identify populations with median values significantly different from zero. The population with the lowest P-value is highlighted by coloring of the area under the curve. The dashed line marks the ratio = 1 point. N, number of genes in each category.
FIGURE 9
FIGURE 9
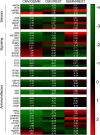
Differential expression of IFN-related genes in GEMM cells, CMV+ cells, and the rest of the population. Heatmap of Log2 ratio values obtained by dividing the mean number of transcripts/cell of IFN-related genes as found in the CMV+ or GEMM clusters by the mean number of transcripts/cell in the rest of the population (CMV/REST and GEMM/REST) or in GEMM cells (CMV/GEMM). The heatmap color scale refers to the Log2 ratio values. Numbers in white font report the Log2 ratio values of each gene.

Similar articles

Cited by

References

    1. Abate D. A., Watanabe S., Mocarski E. S. (2004). Major human cytomegalovirus structural protein pp65 (ppUL83) prevents interferon response factor 3 activation in the interferon response. J. Virol. 78 10995–11006. 10.1128/JVI.78.20.10995-11006.2004 - DOI - PMC - PubMed
    1. Asai T., Liu Y., Di Giandomenico S., Bae N., Ndiaye-Lobry D., Deblasio A., et al. (2012). Necdin, a p53 target gene, regulates the quiescence and response to genotoxic stress of hematopoietic stem/progenitor cells. Blood 120 1601–1612. 10.1182/blood-2011-11-393983 - DOI - PMC - PubMed
    1. Biolatti M., Dell’Oste V., Pautasso S., Gugliesi F., von Einem J., Krapp C., et al. (2018). Human cytomegalovirus tegument protein pp65 (pUL83) dampens type I interferon production by inactivating the DNA sensor cGAS without affecting STING. J. Virol. 92:e01774-17 10.1128/JVI.01774-17 - DOI - PMC - PubMed
    1. Boehm T., Hofer S., Winklehner P., Kellersch B., Geiger C., Trockenbacher A., et al. (2003). Attenuation of cell adhesion in lymphocytes is regulated by CYTIP, a protein which mediates signal complex sequestration. EMBO J. 22 1014–1024. 10.1093/emboj/cdg101 - DOI - PMC - PubMed
    1. Bostrom E. A., Tarkowski A., Bokarewa M. (2009). Resistin is stored in neutrophil granules being released upon challenge with inflammatory stimuli. Biochim. Biophys. Acta 1793 1894–1900. 10.1016/j.bbamcr.2009.09.008 - DOI - PubMed