. 2019 Jun;110(6):2050-2062.
doi: 10.1111/cas.14011. Epub 2019 May 3.

PGC1α/CEBPB/CPT1A axis promotes radiation resistance of nasopharyngeal carcinoma through activating fatty acid oxidation

Affiliations

PGC1α/CEBPB/CPT1A axis promotes radiation resistance of nasopharyngeal carcinoma through activating fatty acid oxidation

Qianqian Du et al. Cancer Sci. 2019 Jun.

Abstract

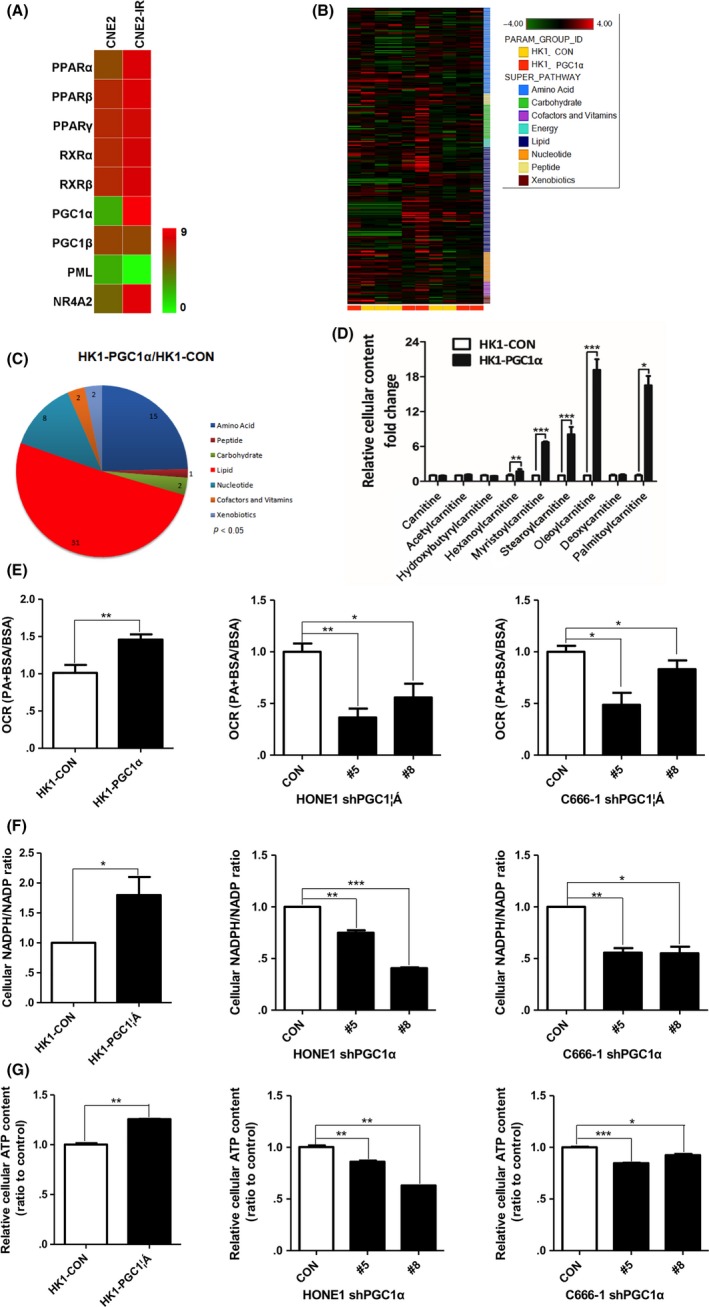
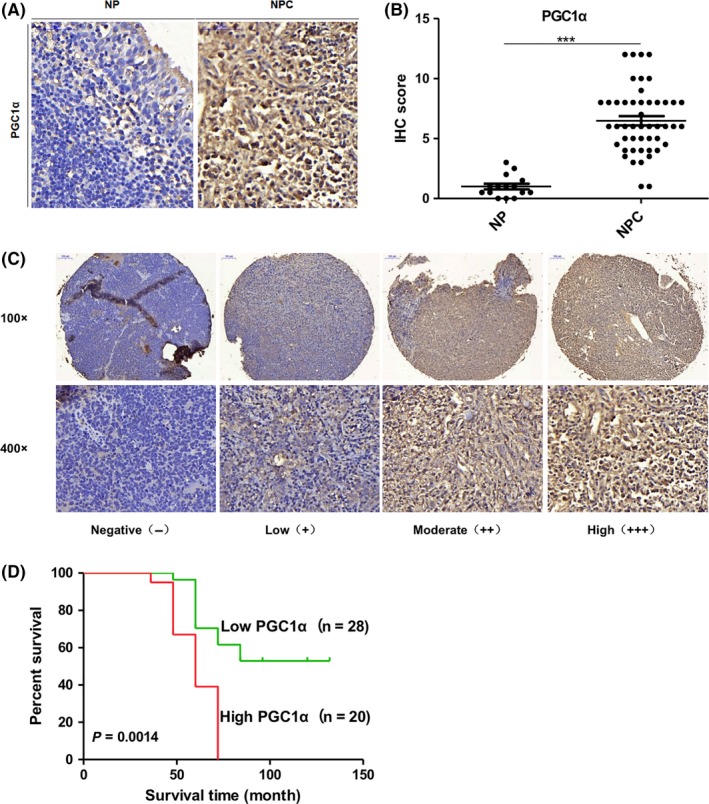
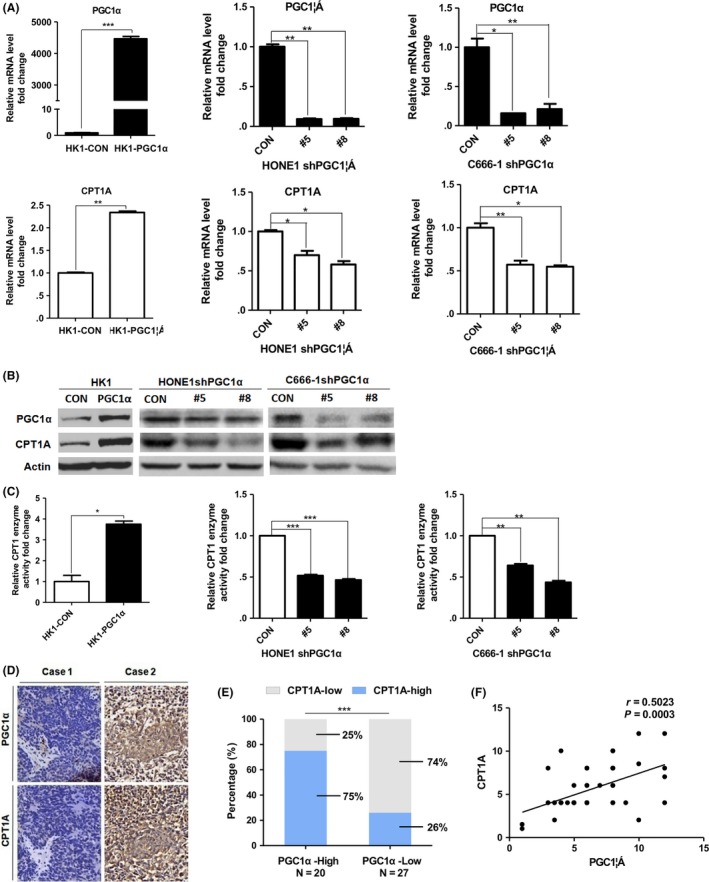
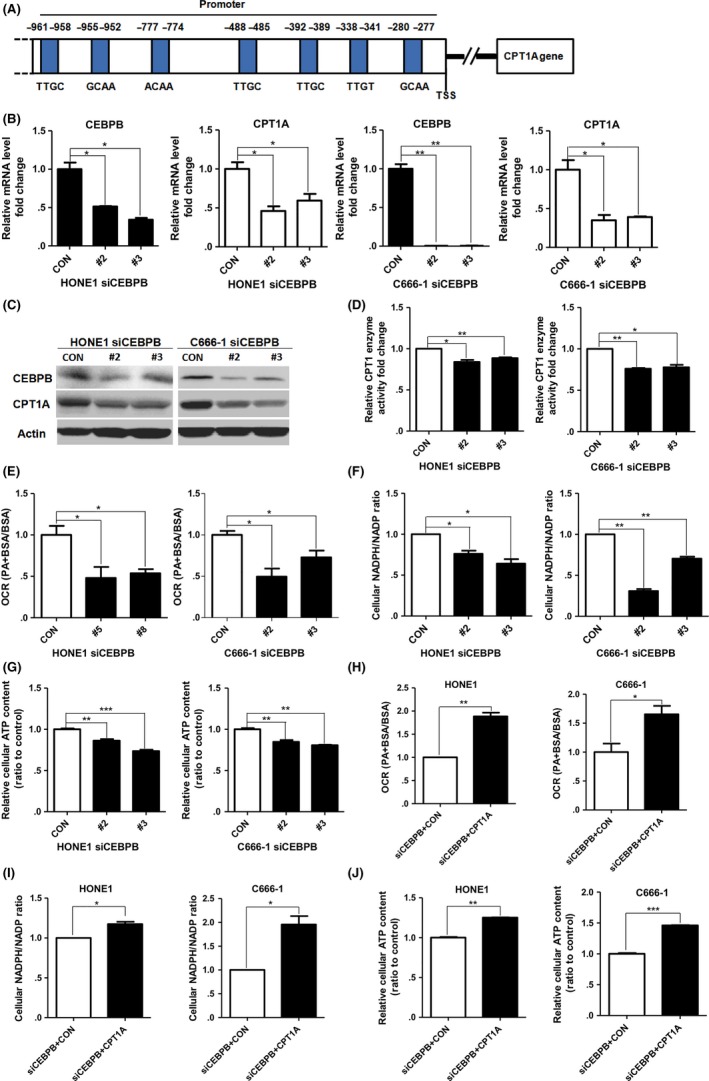
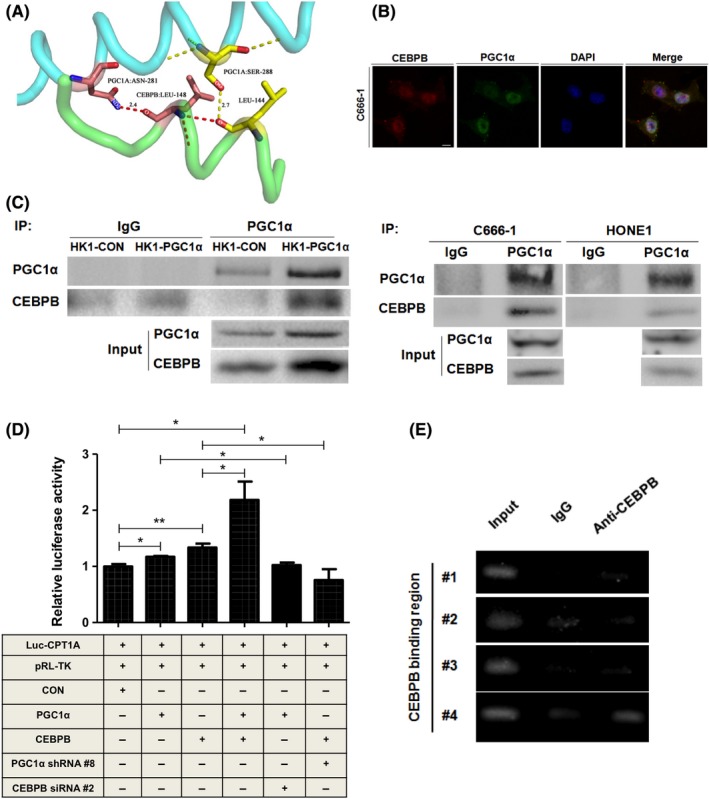
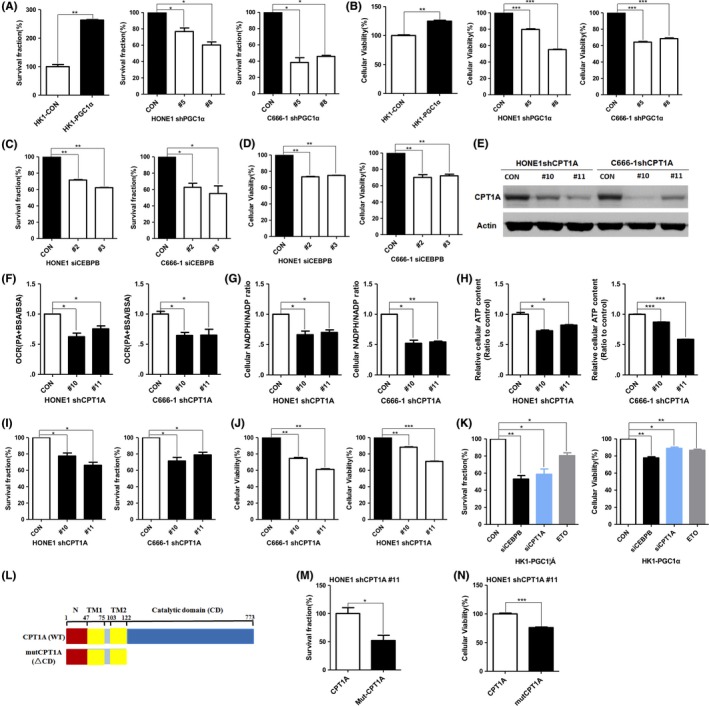
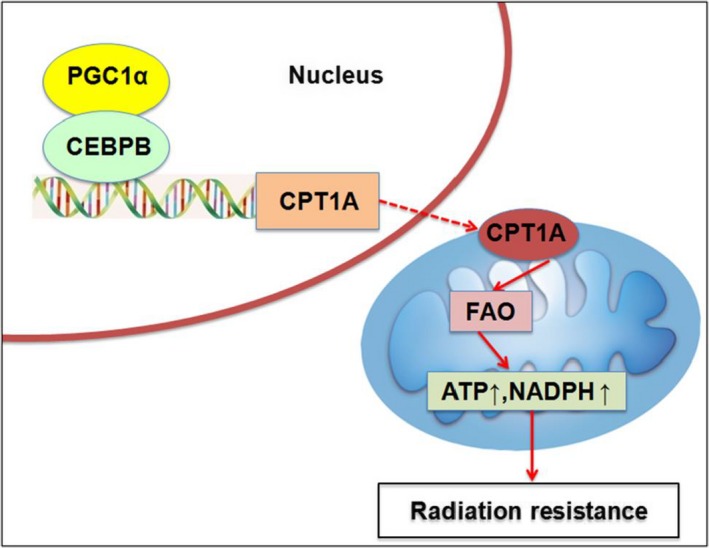
The PPAR coactivator-1α (PGC1α) is an important transcriptional co-activator in control of fatty acid metabolism. Mitochondrial fatty acid oxidation (FAO) is the primary pathway for the degradation of fatty acids and promotes NADPH and ATP production. Our previous study demonstrated that upregulation of carnitine palmitoyl transferase 1 A (CPT1A), the key regulator of FAO, promotes radiation resistance of nasopharyngeal carcinoma (NPC). In this study, we found that high expression of PGC1α is associated with poor overall survival in NPC patients after radiation treatment. Targeting PGC1α could sensitize NPC cells to radiotherapy. Mechanically, PGC1α binds to CCAAT/enhancer binding protein β (CEBPB), a member of the transcription factor family of CEBP, to promote CPT1A transcription, resulting in activation of FAO. Our results revealed that the PGC1α/CEBPB/CPT1A/FAO signaling axis promotes radiation resistance of NPC. These findings indicate that the expression of PGC1α could be a prognostic indicator of NPC, and targeting FAO in NPC with high expression of PGC1α might improve the therapeutic efficacy of radiotherapy.

Keywords: CPT1A; PGC1α; fatty acid oxidation; nasopharyngeal carcinoma; radiation therapy.


Figures

Figure 1
Figure 1
PGC1α increases fatty acid β oxidation (FAO) activity in nasopharyngeal carcinoma (NPC) cells. A, PCR array assessing the mRNA level (Log2‐fold‐change) of 9 genes regulating fatty acid metabolism in CNE2 and CNE2‐IR cells. Green to red color gradation is based on the ranking of each condition from minimum (green) to maximum (red). B, Heat map of 260 biochemical factors in lysates from HK1‐CON cells and HK1‐PGC1α cells. Five replicates were tested for each cell line and the relative fold change for each biochemical factor in each sample is represented as a relative mean value increase (red) or decrease (green). C, Pie charts indicating the number of biochemical alterations (< 0.05, Welch's t test) in each metabolic pathway in HK1‐PGC1α cells compared with HK1‐CON cells. D, Fold change in cellular carnitine levels in HK1‐PGC1α cells compared with HK1‐CON cells. Five replicates were tested for each cell line. E, PA‐based oxygen consumption rates (OCR) were measured with the indicated reagents in PGC1α‐overexpressing HK1 cells and PGC1α knockdown HONE1 and C666‐1 cells compared with parental cells. Palmitate‐BSA (175 μmol/L) was added to cells (n = 3) and BSA was used as a control for palmitate. F and G, The cellular NADPH/NADP ratio (F) and cellular ATP levels (G) in PGC1α‐overexpressing HK1 cells and PGC1α knockdown HONE1 and C666‐1 cells compared with parental cells. *< 0.05, **< 0.01, ***< 0.001
Figure 2
Figure 2
A high expression level of PGC1α is associated with poor overall survival in nasopharyngeal carcinoma (NPC) patients after radiation therapy. A and B, Representative immunohistochemical (IHC) staining (A) and IHC score (B) of PGC1α in nasopharyngeal inflammation and NPC from a tissue microarray of nasopharyngeal patients (magnification 400×). C, Representative IHC staining of PGC1α expression of nasopharyngeal squamous cell carcinoma patients after radiation therapy from a tissue microarray. D, Overall survival rates of nasopharyngeal squamous cell carcinoma patients after radiation therapy with low (n = 28, survival rate > 50%) or high (n = 20, median survival time = 60 mo) expression levels of PGC1α estimated with the Kaplan‐Meier method by log‐rank test (= 0.0014). NP, Nasopharyngeal inflammation
Figure 3
Figure 3
PGC1α positively regulates CPT1A in nasopharyngeal carcinoma (NPC). A and B, Real‐time PCR showing mRNA levels (A) and immunoblot analysis (B) of PGC1α and CPT1A in PGC1α‐overexpressing HK1 cells and PGC1α‐knockdown HONE1 and C666‐1 cells. Values represent means ± SD of 3 independent experiments. C, CPT1 enzyme activity in cells as mentioned above. Results are presented as fold change in enzyme activity (nmol CoA‐SH released/min/mg protein). D, Representative IHC staining of PGC1α and CPT1A from a tissue microarray of nasopharyngeal squamous cell carcinoma patients after radiation therapy (magnification 400×). E, Tumor CPT1A expression was calculated according to PGC1α expression from above tissue microarray. F, Co‐expression analysis of PGC1α and CPT1A from above tissue microarray (n = 47). *< 0.05, **< 0.01, ***< 0.001
Figure 4
Figure 4
CEBPB affects CPT1A transcription, expression, enzyme activity and FAO in nasopharyngeal carcinoma (NPC) cells. A, CEBPB binding sites in the promoter of CPT1A are predicted in the transcription factor prediction database, PROMO (Alggen). B and C, Real‐time PCR showing mRNA levels (B) and immunoblot analysis (C) of CEBPB and CPT1A in CEBPB‐knockdown HONE1 and C666‐1 cells. Values represent means ± SD of 3 independent experiments. D, CPT1 enzyme activity in CEBPB‐knockdown HONE1 and C666‐1 cells. E, PA‐based oxygen consumption rates (OCR) were measured with the indicated reagents in CEBPB‐knockdown HONE1 and C666‐1 cells compared with parental cells. F and G, The cellular NADPH/NADP ratio (F) and cellular ATP levels (G) in CEBPB‐knockdown HONE1 and C666‐1 cells. H‐J, PA‐based OCR (H), NADPH/NADP ratio (I) and cellular ATP levels (J) in CEBPB‐knockdown HONE1 and C666‐1 cells transfected with the indicated plasmids. *< 0.05, **< 0.01, ***< 0.001
Figure 5
Figure 5
PGC1α and CEBPB form a complex and bind to the promoter of CPT1A. A, The protein structure of CEBPB and PGC1α was obtained from the Protein Data Bank (PDB), and the docking of CEBPB and PGC1α was conducted online using the GRAMM‐X Protein Docking Web Server. The results were obtained using the PyMOL software program. B, Confocal microscopic analysis of the co‐localization of PGC1α and CEBPB in C666‐1 cells. The nuclei were stained with DAPI (scale bar, 10 μm). C, Equal amounts of protein were immunoprecipitated (IP) with a PGC1α monoclonal antibody and were immunoblotted to detect CEBPB in HK1‐CON/HK1‐PGC1α, HONE1 and C666‐1 cells. D, Luciferase activity in HEK293T cells transfected with the indicated plasmids and siRNA is indicated. *< 0.05, **< 0.01, ***< 0.001. E, ChIP assay of CEBPB binding to its corresponding sites on the CPT1A promoter in C666‐1 cells. The lanes are designated as: “Input”‐PCR amplification of input DNA, “anti–CEBPB”‐PCR amplification of chromatin DNA fragments precipitated by antibodies against transcription factors, and “IgG”‐a control for non–specific reactions
Figure 6
Figure 6
PGC1α/CEBPB/CPT1A promotes nasopharyngeal carcinoma (NPC) cell radiation‐resistance. A and B, Colony formation assay (A) or MTS assay (B) of PGC1α‐overexpressing HK1 cells and PGC1α‐knockdown HONE1 and C666‐1 cells treated with 4 Gy irradiation. Surviving fractions were calculated by comparing the colony number of each treatment group with untreated groups (0 Gy). Results are plotted as the mean surviving fraction ± SD of 3 independent experiments. C and D, Colony formation assay (C) or MTS assay (D) of CEBPB‐knockdown HONE1 and C666‐1 cells treated with 4 Gy irradiation. E‐H, PA‐based OCR (F), NADPH/NADP ratio (G) and cellular ATP levels (H) in CPT1A‐knockdown HONE1 and C666‐1 cells (E). I and J, Colony formation assay (I) or MTS assay (J) of CPT1A‐knockdown HONE1 and C666‐1 cells treated with 4 Gy irradiation. K, Colony formation assay or MTS assay of HK1‐PGC1α cells with silencing CEBPB and CPT1A, or ETO (80 μmol/L). L, Schematic diagram represented CPT1A or mutCPT1A. TM, transmembrane domains. MutCPT1A (ΔCD), the catalytic domain deletion mutant of CPT1A. M and N, Colony formation assay (M) or MTS assay (N) of CPT1A‐knockdown HONE1 cells with overexpressing CPT1A or mutCPT1A. *< 0.05, **< 0.01, ***< 0.001
Figure 7
Figure 7
A schematic to illustrate PGC1α‐mediated radiation resistance in nasopharyngeal carcinoma (NPC). The activation of PGC1α and the PGC1α‐CEBPB interaction promote the transcription, expression and enzyme activity of CPT1A, which facilitates fatty acid oxidation and maximizes ATP and NADPH production, leading to resistance to radiation

Similar articles

Cited by

References

    1. Boroughs LK, DeBerardinis RJ. Metabolic pathways promoting cancer cell survival and growth. Nat Cell Biol. 2015;17:351‐359. - PMC - PubMed
    1. Pavlova NN, Thompson CB. The emerging hallmarks of cancer metabolism. Cell Metab. 2016;23:27‐47. - PMC - PubMed
    1. Ward PS, Thompson CB. Metabolic reprogramming: a cancer hallmark even warburg did not anticipate. Cancer Cell. 2012;21:297‐308. - PMC - PubMed
    1. Luo X, Hong L, Cheng C, et al. DNMT1 mediates metabolic reprogramming induced by Epstein‐Barr virus latent membrane protein 1 and reversed by grifolin in nasopharyngeal carcinoma. Cell Death Dis. 2018;9:619. - PMC - PubMed
    1. Luo X, Zhao X, Cheng C, Li N, Liu Y, Cao Y. The implications of signaling lipids in cancer metastasis. Exp Mol Med. 2018;50:127. - PMC - PubMed

MeSH terms

Substances