

Heterogeneity of the Human Pancreatic Islet
- PMID: 30936150
- PMCID: PMC6610021
- DOI: 10.2337/db19-0072
Heterogeneity of the Human Pancreatic Islet
Abstract
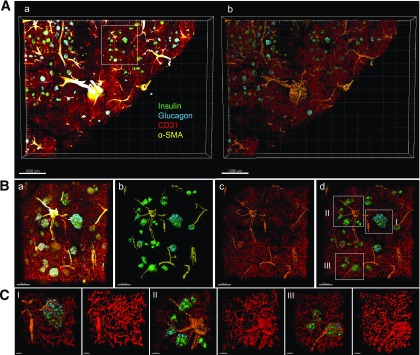
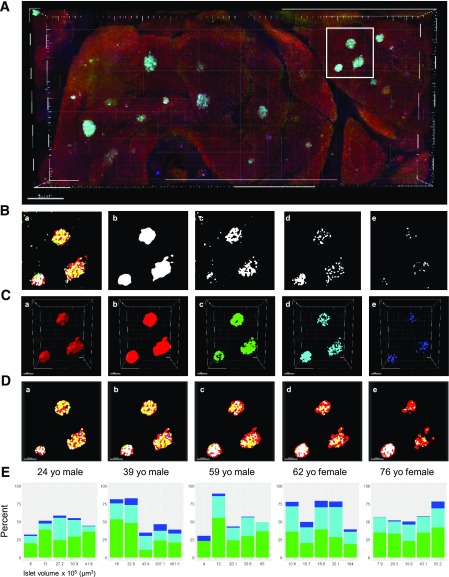
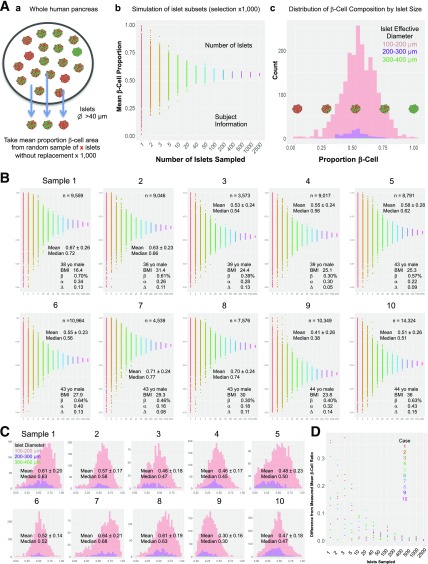
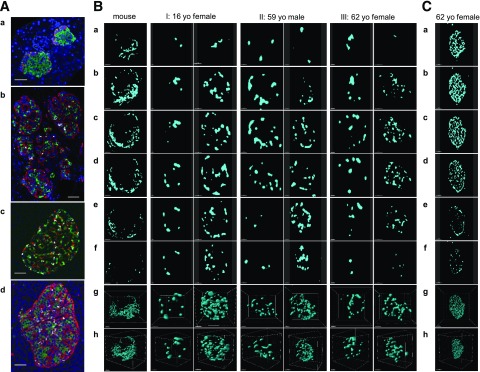
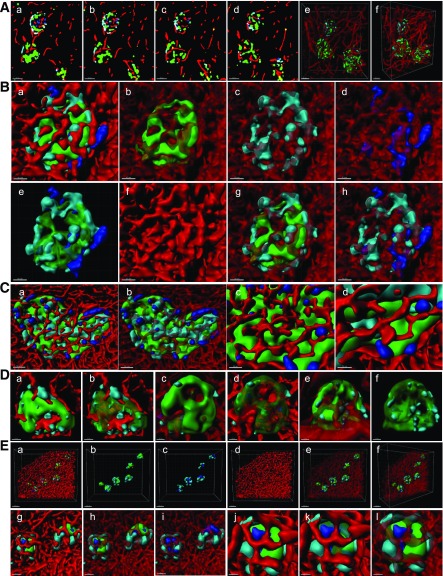
Pancreatic β-cells play a pivotal role in maintaining normoglycemia. Recent studies have revealed that the β-cell is not a homogeneous cell population but, rather, is heterogeneous in a number of properties such as electrical activity, gene expression, and cell surface markers. Identification of specific β-cell subpopulations altered in diabetic conditions would open a new avenue to develop targeted therapeutic interventions. As intense studies of β-cell heterogeneity are anticipated in the next decade, it is important that heterogeneity of the islet be recognized. Many studies in the past were undertaken with a small sample of islets, which might overlook important individual variance. In this study, by systematic analyses of the human islet in two and three dimensions, we demonstrate islet heterogeneity in size, number, architecture, cellular composition, and capillary density. There is no stereotypic human islet, and thus, a sufficient number of islets should be examined to ensure study reproducibility.
© 2019 by the American Diabetes Association.
Figures
Similar articles
-
Evidence for a Neogenic Niche at the Periphery of Pancreatic Islets.Bioessays. 2018 Nov;40(11):e1800119. doi: 10.1002/bies.201800119. Epub 2018 Sep 28. Bioessays. 2018. PMID: 30264410 Free PMC article. Review.
-
Islet α-, β-, and δ-cell development is controlled by the Ldb1 coregulator, acting primarily with the islet-1 transcription factor.Diabetes. 2013 Mar;62(3):875-86. doi: 10.2337/db12-0952. Epub 2012 Nov 27. Diabetes. 2013. PMID: 23193182 Free PMC article.
-
Immunohistochemical distribution of insulin-, glucagon- and somatostatin-containing cells in the pancreas of Lake Van fish (Alburnus tarichi Güldenstädt, 1814) (Cyprinidae).Eur J Histochem. 2019 Feb 25;63(1):2999. doi: 10.4081/ejh.2019.2999. Eur J Histochem. 2019. PMID: 30827082 Free PMC article.
-
Quantitative analysis of intra- and inter-individual variability of human beta-cell mass.Sci Rep. 2017 Nov 27;7(1):16398. doi: 10.1038/s41598-017-16300-w. Sci Rep. 2017. PMID: 29180621 Free PMC article.
-
Signals in the pancreatic islet microenvironment influence β-cell proliferation.Diabetes Obes Metab. 2017 Sep;19 Suppl 1(Suppl 1):124-136. doi: 10.1111/dom.13031. Diabetes Obes Metab. 2017. PMID: 28880471 Free PMC article. Review.
Cited by
-
Pancreas Optical Clearing and 3-D Microscopy in Health and Diabetes.Front Endocrinol (Lausanne). 2021 Apr 26;12:644826. doi: 10.3389/fendo.2021.644826. eCollection 2021. Front Endocrinol (Lausanne). 2021. PMID: 33981285 Free PMC article. Review.
-
Well-Plate μFASP for Proteomic Analysis of Single Pancreatic Islets.J Proteome Res. 2022 Apr 1;21(4):1167-1174. doi: 10.1021/acs.jproteome.2c00047. Epub 2022 Mar 16. J Proteome Res. 2022. PMID: 35293755 Free PMC article.
-
Functional analysis of islet cells in vitro, in situ, and in vivo.Semin Cell Dev Biol. 2020 Jul;103:14-19. doi: 10.1016/j.semcdb.2020.02.002. Epub 2020 Feb 17. Semin Cell Dev Biol. 2020. PMID: 32081627 Free PMC article. Review.
-
Disrupted glucose homeostasis and glucagon and insulin secretion defects in Robo βKO mice.FASEB J. 2023 Aug;37(8):e23106. doi: 10.1096/fj.202200705RR. FASEB J. 2023. PMID: 37498234 Free PMC article.
-
A distinct hypothalamus-to-β cell circuit modulates insulin secretion.Cell Metab. 2022 Feb 1;34(2):285-298.e7. doi: 10.1016/j.cmet.2021.12.020. Cell Metab. 2022. PMID: 35108515 Free PMC article.
References
-
- Salomon D, Meda P. Heterogeneity and contact-dependent regulation of hormone secretion by individual B cells. Exp Cell Res 1986;162:507–520 - PubMed
-
- Bader E, Migliorini A, Gegg M, et al. . Identification of proliferative and mature β-cells in the islets of Langerhans. Nature 2016;535:430–434 - PubMed
Publication types
MeSH terms
Grants and funding
LinkOut - more resources
Full Text Sources
Other Literature Sources
Research Materials
Miscellaneous
