. 2019 Jun:24:80-97.
doi: 10.1016/j.molmet.2019.03.006. Epub 2019 Mar 20.

Point mutations in the PDX1 transactivation domain impair human β-cell development and function

Affiliations

Point mutations in the PDX1 transactivation domain impair human β-cell development and function

Xianming Wang et al. Mol Metab. 2019 Jun.

Abstract

Objective: Hundreds of missense mutations in the coding region of PDX1 exist; however, if these mutations predispose to diabetes mellitus is unknown.

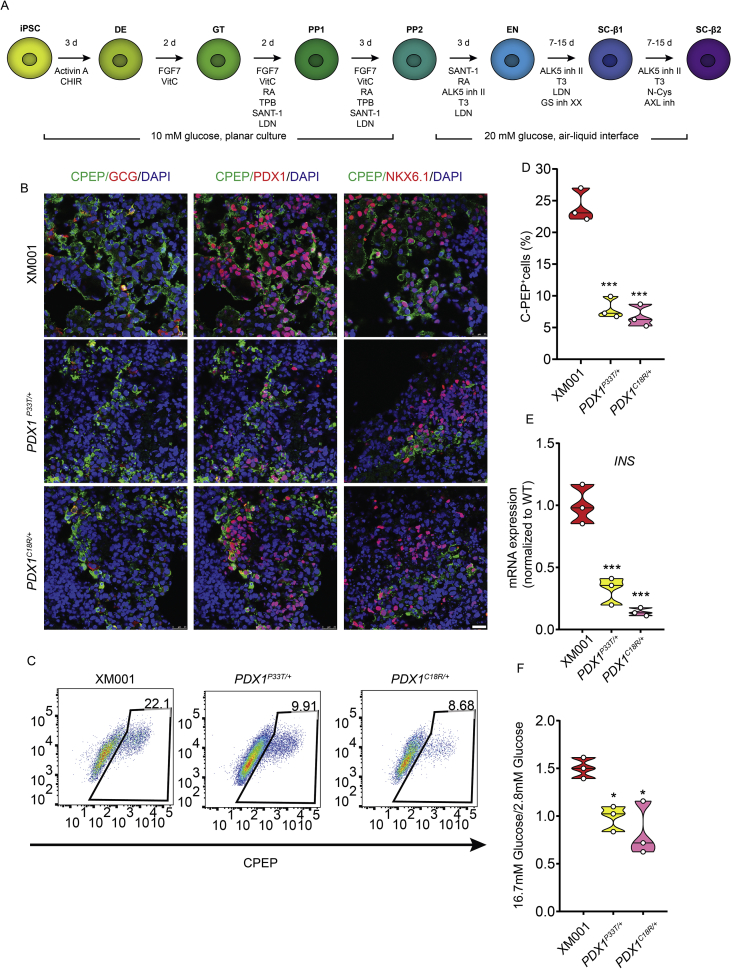
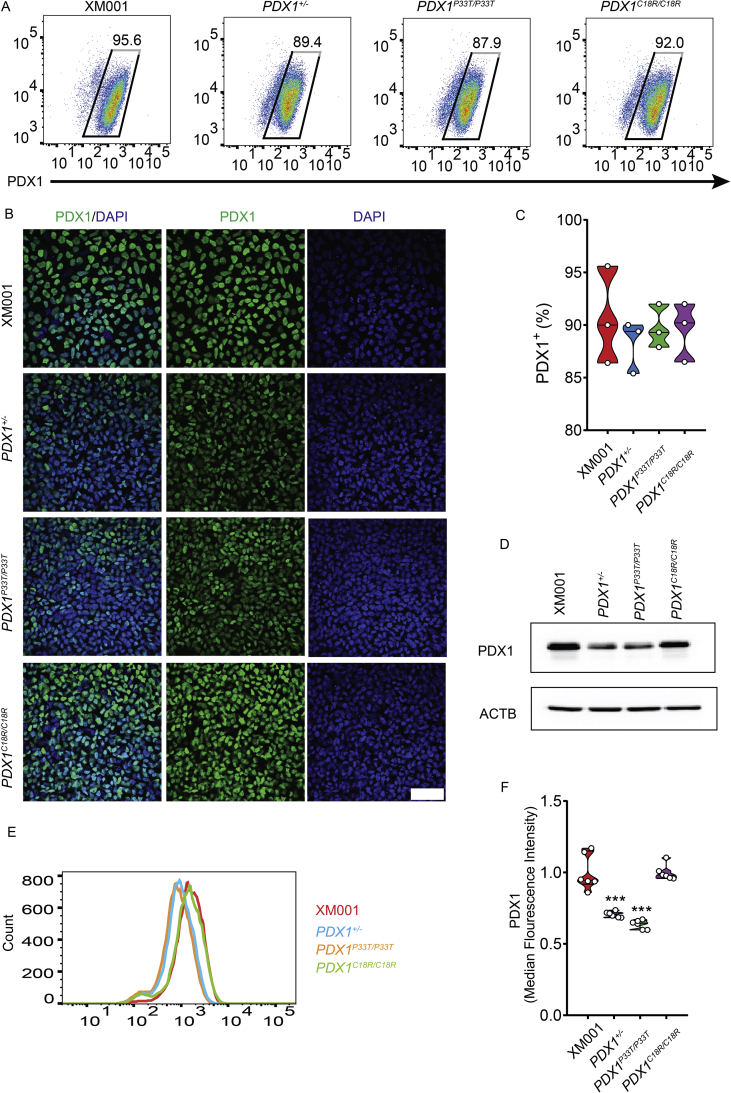
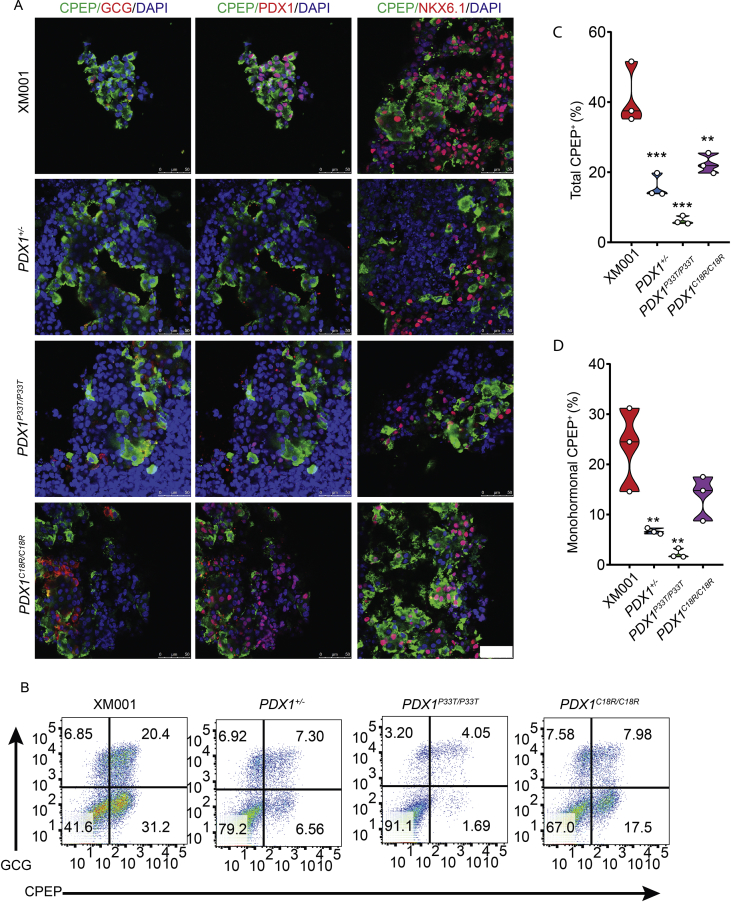
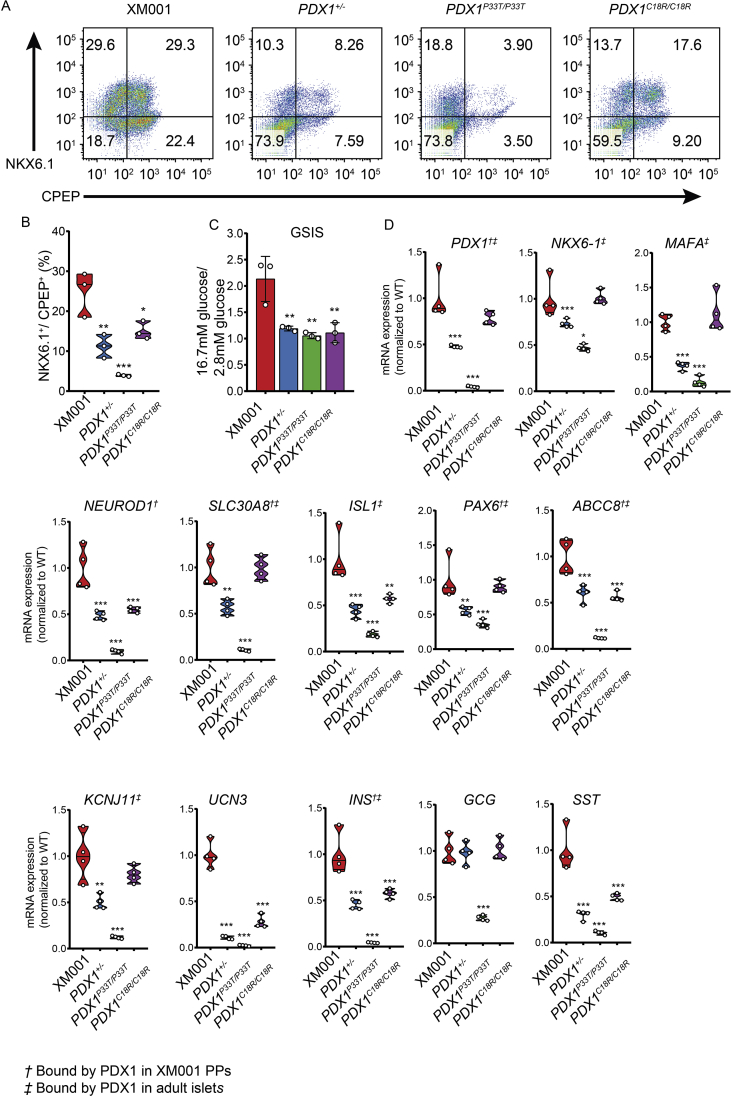
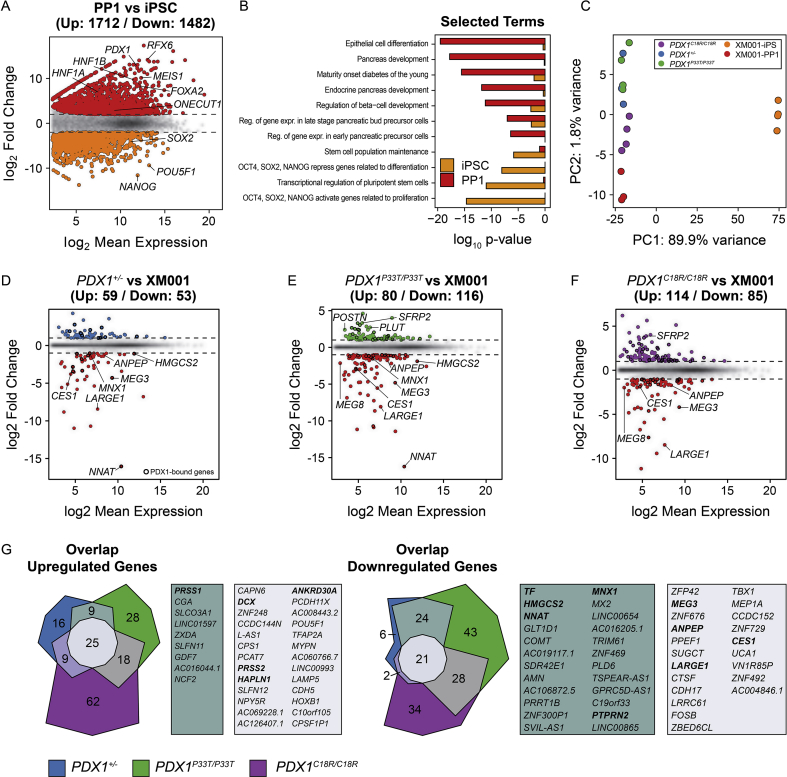
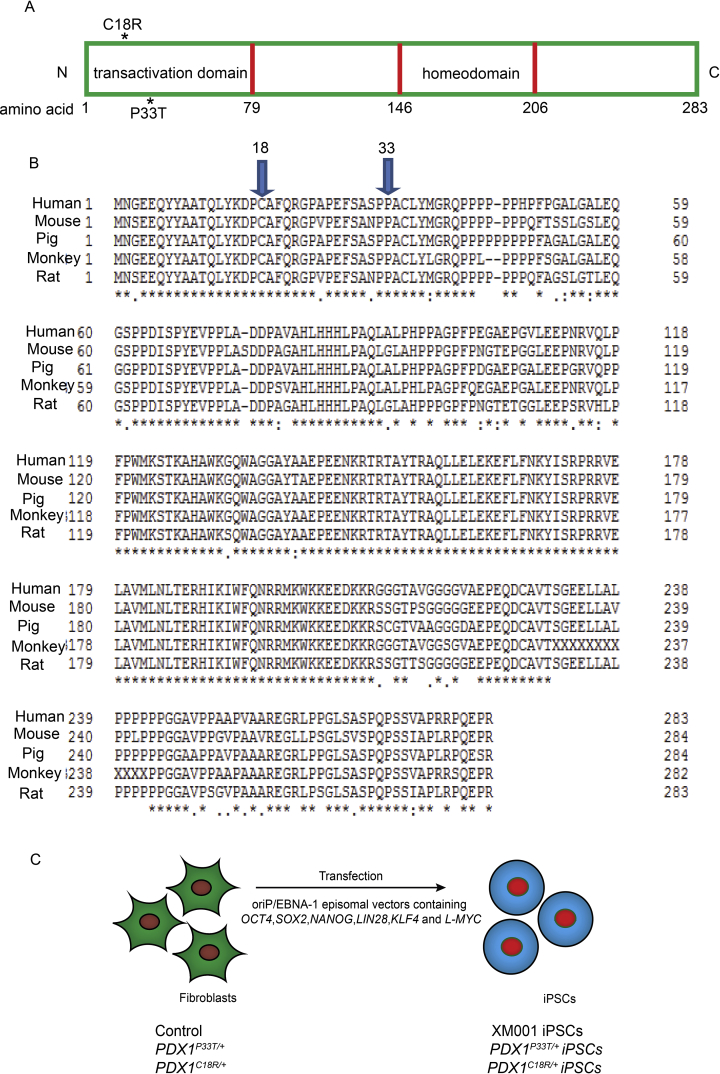
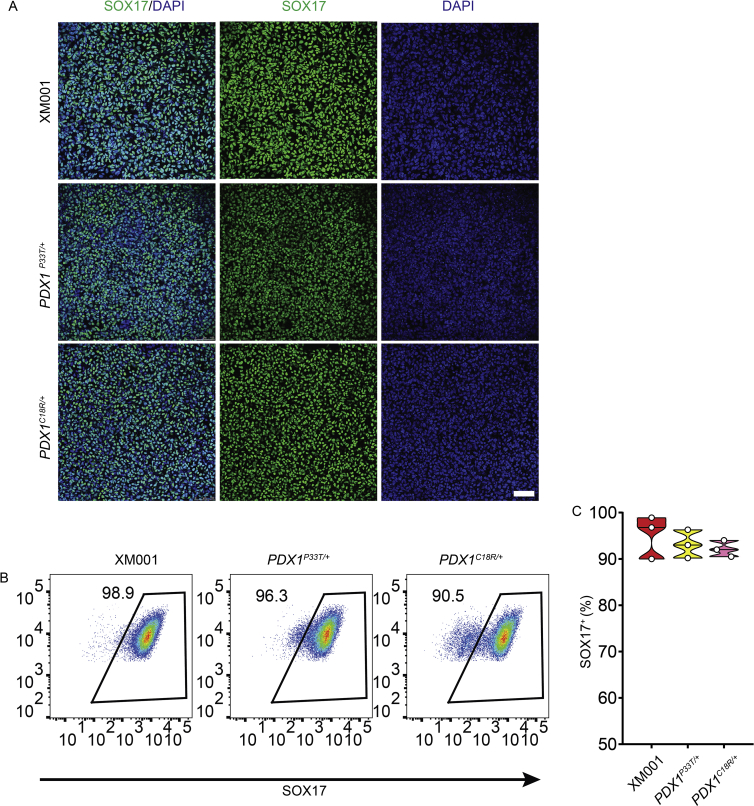
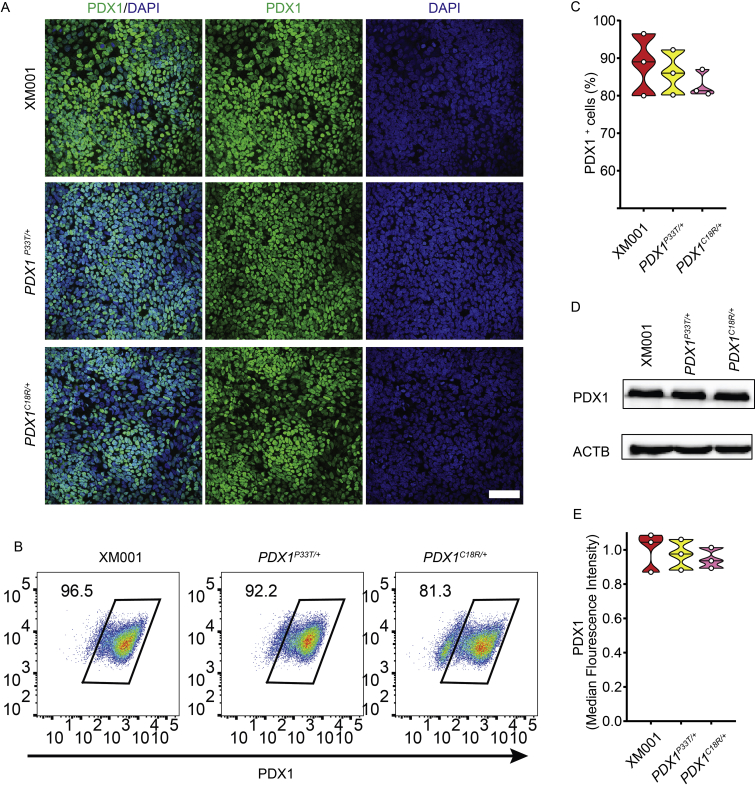
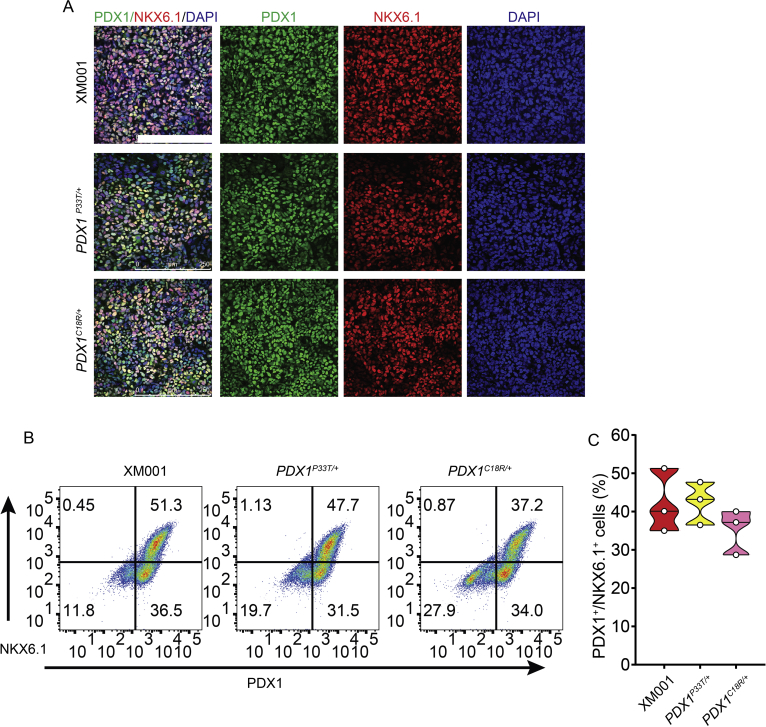
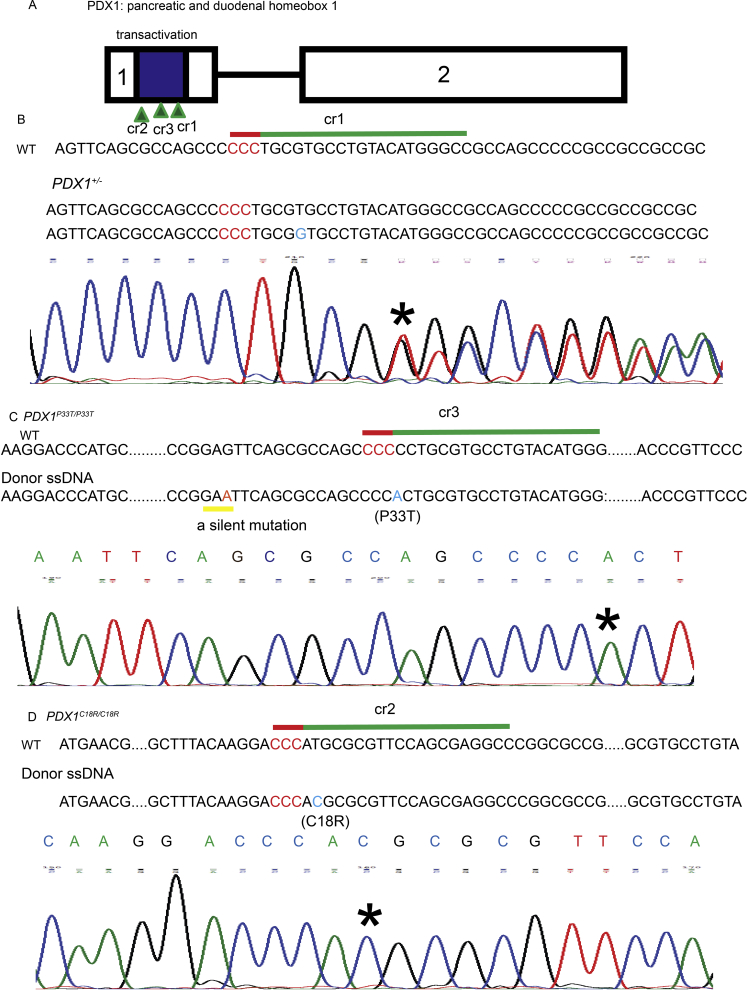
Methods: In this study, we screened a large cohort of subjects with increased risk for diabetes and identified two subjects with impaired glucose tolerance carrying common, heterozygous, missense mutations in the PDX1 coding region leading to single amino acid exchanges (P33T, C18R) in its transactivation domain. We generated iPSCs from patients with heterozygous PDX1P33T/+, PDX1C18R/+ mutations and engineered isogenic cell lines carrying homozygous PDX1P33T/P33T, PDX1C18R/C18R mutations and a heterozygous PDX1 loss-of-function mutation (PDX1+/-).

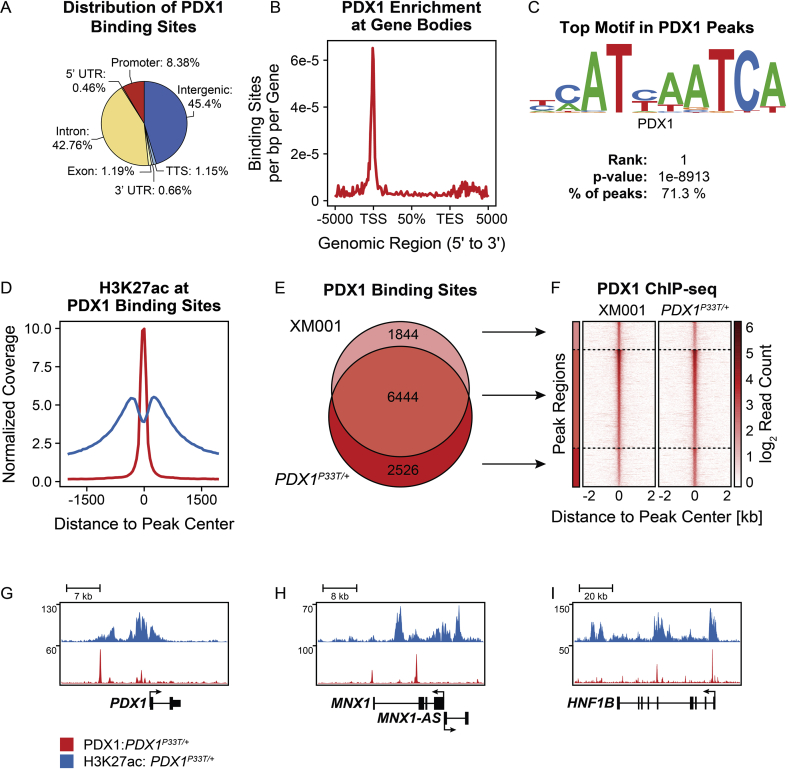
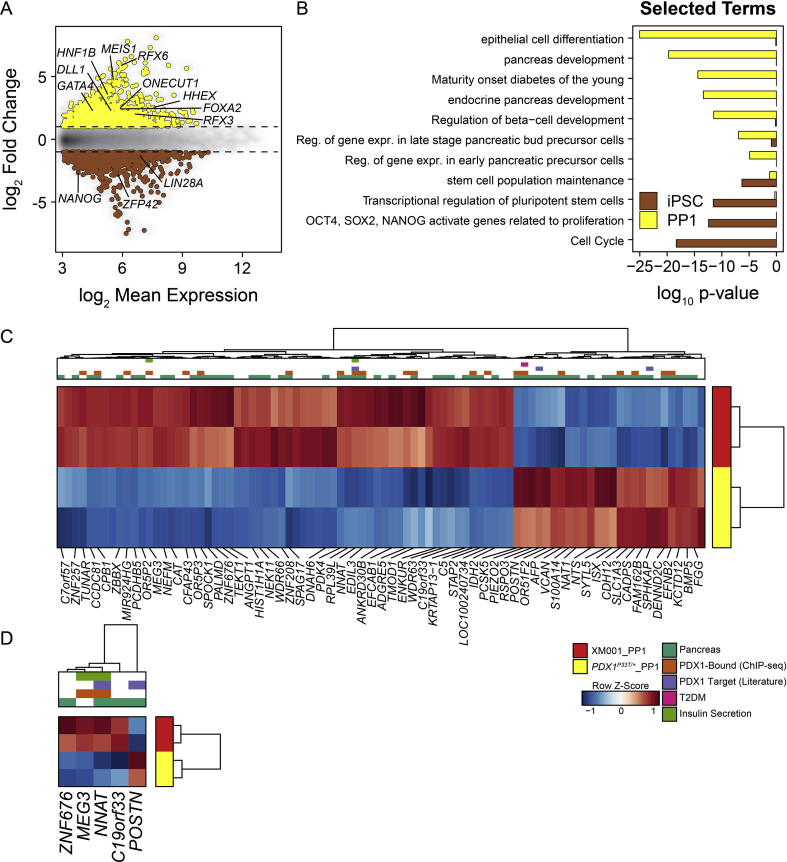
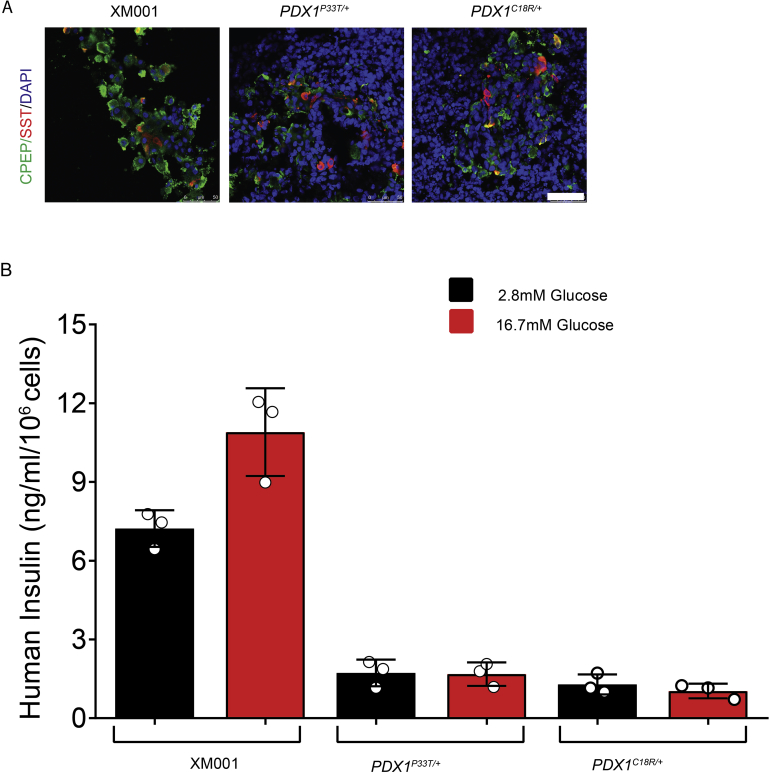
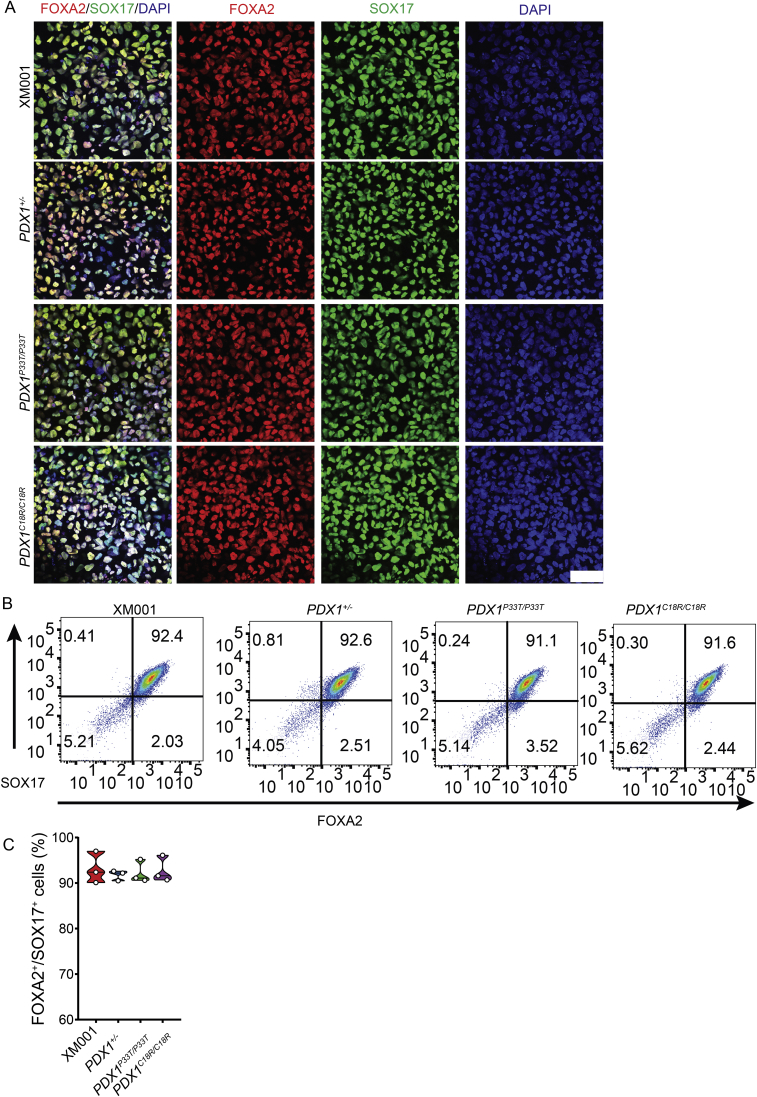
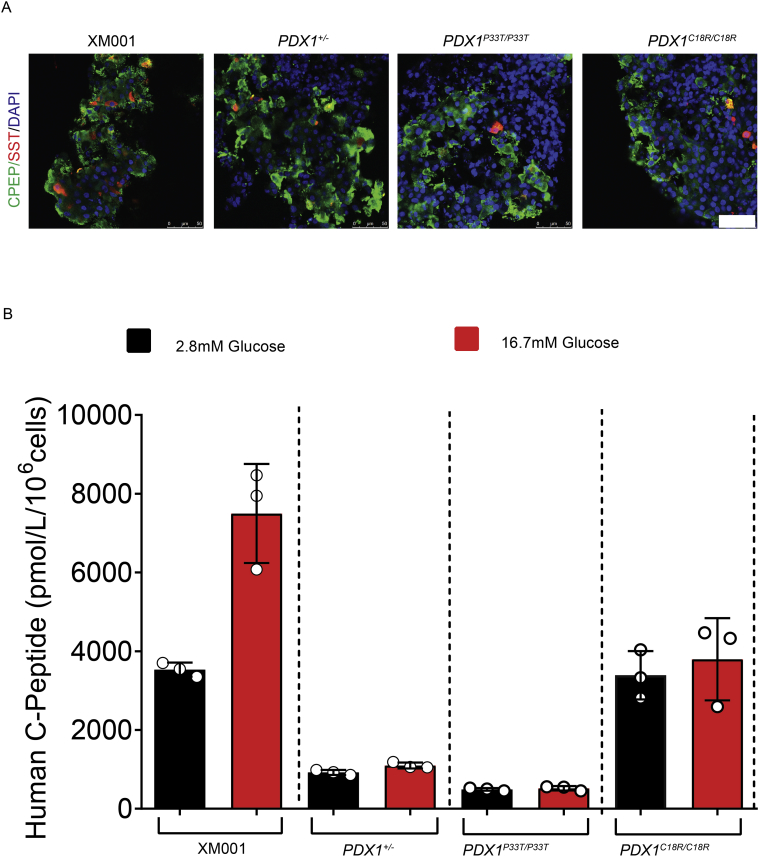
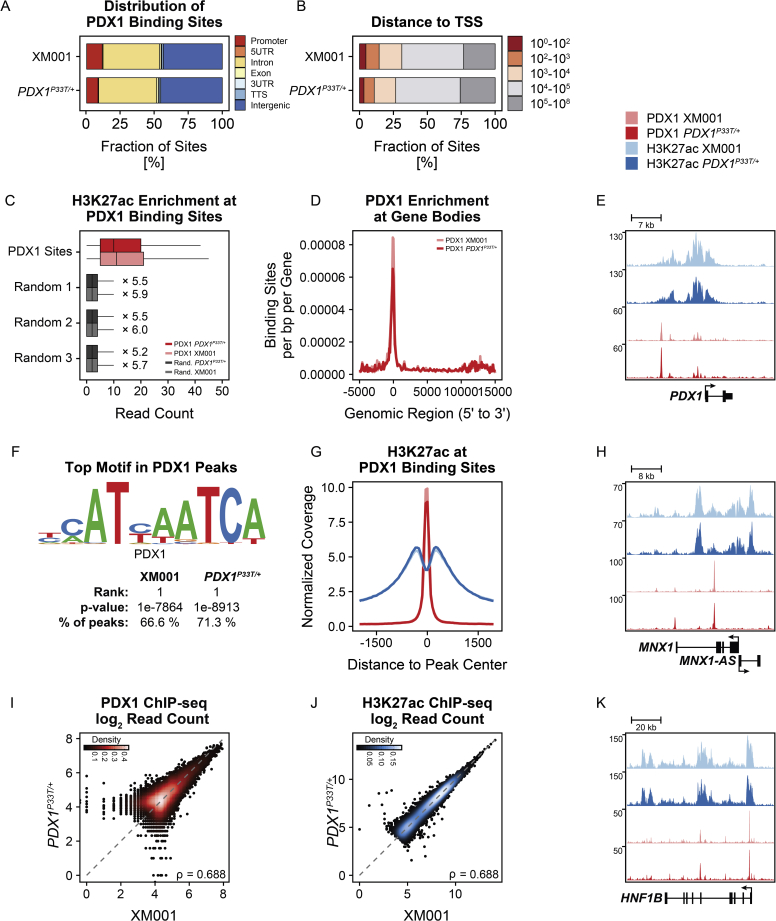
Results: Using an in vitro β-cell differentiation protocol, we demonstrated that both, heterozygous PDX1P33T/+, PDX1C18R/+ and homozygous PDX1P33T/P33T, PDX1C18R/C18R mutations impair β-cell differentiation and function. Furthermore, PDX1+/- and PDX1P33T/P33T mutations reduced differentiation efficiency of pancreatic progenitors (PPs), due to downregulation of PDX1-bound genes, including transcription factors MNX1 and PDX1 as well as insulin resistance gene CES1. Additionally, both PDX1P33T/+ and PDX1P33T/P33T mutations in PPs reduced the expression of PDX1-bound genes including the long-noncoding RNA, MEG3 and the imprinted gene NNAT, both involved in insulin synthesis and secretion.

Conclusions: Our results reveal mechanistic details of how common coding mutations in PDX1 impair human pancreatic endocrine lineage formation and β-cell function and contribute to the predisposition for diabetes.

Keywords: Insulin secretion; PDX1; PDX1-Bound genes; Transactivation domain; β-Cell differentiation.


Figures

Figure 1
Figure 1
Generation of β-like cells from patients carrying PDX1P33T/+and PDX1C18R/+mutations. (A) Schematic of iPSC-derived β-like cells protocol. (B) Immunostaining for CPEP, GCG, PDX1, and NKX6.1 in the XM001, PDX1P33T/+ and PDX1C18R/+ cells at the S7 stage. Scale bar indicates 25 μm. (C) Representative FACS plots of CPEP+ cells in the XM001, PDX1P33T/+ and PDX1C18R/+ cells at the S7 stage. (D) FACS quantification of the percentage of CPEP+ cells in the XM001, PDX1P33T/+ and PDX1C18R/+ cells at the S7 stage (n = 3). (E) RT-qPCR analysis of INS gene expression in the XM001, PDX1P33T/+ and PDX1C18R/+ cells at the S7 stage (n = 3). (F) Glucose-stimulated insulin secretion assay for the XM001, PDX1P33T/+, and PDX1C18R/+ cells at the S7 stage. The fold change of insulin secretion with high glucose (16.7 mM) relative to low glucose (2.8 mM) treatment is shown (n = 3).
Figure 2
Figure 2
Characterization of PDX1+/−, PDX1P33T/P33T, and PDX1C18R/C18Rmutations at the early pancreatic stage (PP1). (A) Representative FACS plots of PDX1+ cells in XM001, PDX1+/−, PDX1P33T/P33T, and PDX1C18R/C18R cells at the early pancreatic stage. (B) Representative immunofluorescence staining of PDX1 in XM001, PDX1+/−, PDX1P33T/P33T, and PDX1C18R/C18R. Scale bar indicates 50 μm. (C) FACS quantification of the percentage of PDX1+ cells in XM001, PDX1+/−, PDX1P33T/P33T and PDX1C18R/C18R cells at the PP1 stage (n = 3). (D) Representative immunoblot of PDX1 expression from XM001, PDX1+/−, PDX1P33T/P33T, and PDX1C18R/C18R cells at the PP1 stage. (E) Representative FACS histograms comparing the differentiation efficiencies towards the PDX1+ cells in XM001, PDX1+/−, PDX1P33T/P33T, and PDX1C18R/C18R cells. (F) Median Fluorescence Intensity (MFI) quantification for XM001, PDX1+/−, PDX1P33T/P33T, and PDX1C18R/C18R cells at the PP1 stage stained with PDX1 antibody (n = 6).
Figure 3
Figure 3
Characterization of PDX1+/−, PDX1P33T/P33Tand PDX1C18R/C18Rmutations at the late pancreatic stage (PP2). (A) Representative immunofluorescence staining of PDX1 and NKX6.1 in XM001, PDX1+/−, PDX1P33T/P33T, and PDX1C18R/C18R cells. Scale bar indicates 50 μm. (B) Representative FACS plots of PDX1+ and NKX6.1+cells in XM001, PDX1+/−, PDX1P33T/P33T, and PDX1C18R/C18R cells at the PP2 stage. (C) FACS quantification of the percentage of PDX1+ and NKX6.1+cells in XM001, PDX1+/−, PDX1P33T/P33T, and PDX1C18R/C18R cells at the PP2 stage (n = 3).
Figure 4
Figure 4
Characterization of the impact of PDX1+/−, PDX1P33T/P33T, and PDX1C18R/C18Rmutations on β-like cell differentiation. (A) Representative immunofluorescence staining for C-peptide, Glucagon, PDX1 and NKX6.1 in XM001, PDX1+/−, PDX1P33T/P33T, and PDX1C18R/C18R cells at the S7 stage. Scale bar indicates 50 μm. (B) Representative FACS plots of CPEP+ and GCG+ cells in XM001, PDX1+/−, PDX1P33T/P33T, and PDX1C18R/C18R cells at the S7 stage. (C) FACS quantification of the percentage of total CPEP+ cells in the XM001, PDX1+/−, PDX1P33T/P33T, and PDX1C18R/C18R cells at the S7 stage (n = 3). (D) FACS quantification of the percentage of mono-hormonal CPEP+ cells in the XM001, PDX1+/−, PDX1P33T/P33T, and PDX1C18R/C18R cells at the S7 stage (n = 3).
Figure 5
Figure 5
PDX1 mutations reduce glucose-responsive function of β-like cells. (A) Representative FACS plots for C-peptide+ and NKX6.1+ in XM001, PDX1+/−, PDX1P33T/P33T and PDX1C18R/C18R cells at the S7 stage. (B) FACS quantification of the percentage of total CPEP+ and NKX6.1+ cells in the XM001, PDX1+/−, PDX1P33T/P33T, and PDX1C18R/C18R cells at the S7 stage (n = 3). (C) GSIS assay for the XM001, PDX1+/−, PDX1P33T/P33T, and PDX1C18R/C18R cells at the S7 stage. The fold change of insulin secretion with high glucose (16.7 mM) relative to low glucose (2.8 mM) treatment is shown (n = 3). (D) RT-qPCR analysis of expression of β-cell transcription factors, hormonal markers and β-cell functional markers at the S7 stage (n = 4).
Figure 6
Figure 6
RNA-seq profiling of pancreatic progenitors (PP1) from PDX1+/−, PDX1P33T/P33T, and PDX1C18R/C18RiPSC lines. (A) MA plot showing the mean log2 expression against the log2-fold change of the RNA-Seq data obtained from XM001 iPSCs and PPs from XM001 and isogenic PDX1 mutants. Genes with significantly different expression (log2 fold change ≥ 2 and adjusted p-value ≤ 0.05) are drawn in color. Red depicts increased expression in PPs, whereas orange depicts increased expression in iPSCs. (B) Bar graph of p-values from pathway enrichment analysis, showing selected GO terms and KEGG and Reactome pathways from differentially expressed genes. (C) Principal component analysis (PCA) of iPSCs and PP1 cells. (D–F) MA plots showing the mean log2 expression against the log2 fold change of the RNA-Seq data obtained from PDX1+/−, PDX1P33T/P33T, and PDX1C18R/C18R compared to XM001. Genes with significantly different expression (log2 fold change ≥ 1 and adjusted p-value ≤ 0.1) are drawn in color. Red depicts increased expression in XM001 control PPs, blue, green and purple depict increased expression in PDX1+/−, PDX1P33T/P33T, and PDX1C18R/C18R, respectively. Black circles genes with PDX1 binding sites in XM001 PPs. (G) Venn diagrams showing the overlap of up- and downregulated genes from PDX1+/−, PDX1P33T/P33T, and PDX1C18R/C18R PPs compared to XM001 PPs. Some relevant pancreatic and disease associated genes are set in bold.
Figure 7
Figure 7
Characterization of PDX1 binding in patient-derived PDX1P33T/+pancreatic progenitors (PP1). (A) Distribution of PDX1 binding sites among genomic features. PDX1P33T/+ binds predominantly to intergenic, intronic and promoter regions. (B) Meta-genomic plot showing the enrichment of PDX1 at the transcriptional start sites (TSS) of its target genes displayed as binding sites per base pair (bp) per gene over the genomic regions of all RefSeq genes. (C) Most enriched motif detected by motif analysis resembles the known PDX1 consensus sequence and is identified in 71.3% of all PDX1-bound sequences. (D) Average ChIP-seq Signal of H3K27ac (blue) and PDX1 (red) at PDX1 binding sites shows enrichment of H3K27ac at PDX1-bound sites. (E) Venn diagram showing the overlap of PDX1-binding sites in XM001 PPs and PDX1P33T/+ PPs. (F) Heatmap of PDX1 ChIP-seq signal at all PDX1 binding sites in XM001 and PDX1P33T/+ PPs, showing high resemblance of PDX1 binding in these cells. (G) ChIP-seq data tracks showing the enrichment of H3K27ac (blue) and PDX1 (red) at the loci of important pancreatic genes.
Figure 8
Figure 8
mRNA profiles of patient-derived PDX1P33T/+pancreatic progenitors (PP1). (A) MA plot showing the mean log2 expression against the log2-fold change of the microarray data obtained from XM001 iPSCs and PPs. Genes with significantly different expression (log2 fold change ≥ 1 and adjusted p-value ≤ 0.1) are drawn in color. Yellow depicts increased expression in PPs, whereas brown depicts increased expression in iPSCs. (B) Bar graph of p-values from pathway enrichment analysis, showing selected GO terms and KEGG and Reactome pathways from differentially expressed genes. (C) Heatmap of differentially expressed genes between patient-derived PDX1P33T/+ and XM001 control PPs. (D) Heat map and clustering showing consistently deregulated genes in patients PDX1P33T/+ and isogenic PDX1P33T/P33T PPs.
figs1
figs1
Suppl. Figure 1. Generation of patient-derived iPSC lines. (A) An overview of the PDX1 protein structure. (B) The PDX1 protein alignment in different species. (C) Scheme shows the reprogramming factors for the generation of iPSCs.
figs2
figs2
Suppl. Figure 2. Characterization of PDX1P33T/+and PDX1C18R/+mutant iPSCs differentiated towards the endoderm stage. (A) Representative immunofluorescence staining for SOX17 in the XM001, PDX1P33T/+, and PDX1C18R/+ cells at the endoderm stage. Scale bar indicates 100 μm. (B) Representative FACS plots for SOX17+ cells in the XM001, PDX1P33T/+, and PDX1C18R/+ cells at the endoderm stage. (C) FACS quantification of the percentage of total SOX17+ cells in the XM001, PDX1P33T/+, and PDX1C18R/+ cells at the endoderm stage (n = 3).
figs3
figs3
Suppl. Figure 3. Characterization of PDX1P33T/+and PDX1C18R/+mutant iPSCs differentiated towards the early pancreatic progenitors (PP1). (A) Representative immunofluorescence staining for PDX1 in the XM001, PDX1P33T/+ and PDX1C18R/+ cells at the PP1 stage. Scale bar indicates 75 μm. (B) Representative FACS plots for PDX1+ cells in the XM001, PDX1P33T/+, and PDX1C18R/+ cells at the PP1 stage. (C) FACS quantification of the percentage of PDX1+ cells in XM001, PDX1P33T/+ and PDX1C18R/+ cells at PP1 stage (n = 3). (D) Representative immunoblot of PDX1 expression from XM001, PDX1P33T/+, and PDX1C18R/+ cells at the PP1 stage. (E) Median Fluorescence Intensity (MFI) quantification for XM001 and PDX1P33T/+, and PDX1C18R/+ cells at the PP1 stage stained with PDX1 antibody (n = 3).
figs4
figs4
Suppl. Figure 4. Characterization of PDX1P33T/+and PDX1C18R/+mutant iPSCs differentiated towards the late pancreatic progenitors (PP2). (A) Representative immunofluorescence staining for PDX1 and NKX6.1 in the XM001, PDX1P33T/+, and PDX1C18R/+ cells at the PP2 stage. Scale bars indicate 250 μm. (B) Representative FACS plots for PDX1+ and NKX6.1+cells in the XM001, PDX1P33T/+, and PDX1C18R/+ cells at the PP2 stage. (C) FACS quantification of the percentage of total PDX1+ and NKX6.1+cells in the XM001, PDX1P33T/+, and PDX1C18R/+ cells at the PP2 stage (n = 3).
figs5
figs5
Suppl. Figure 5. Cells carrying PDX1P33T/+and PDX1C18R/+mutations are able to differentiate into β-like cells. (A) Representative immunofluorescence staining for CPEP and SST in the XM001, PDX1P33T/+, and PDX1C18R/+ cells at the S7 stage. Scale bar indicates 50 μm. (B) Insulin secretion assay for XM001, PDX1P33T/+, and PDX1C18R/+ cells at the S7 stage (n = 3).
figs6
figs6
Suppl. Figure 6. Generation of the PDX1+/−, PDX1P33T/P33T, and PDX1C18R/C18Risogenic iPSC lines using CRISPR/Cas9 system. (A) Schematics of gene targeting strategy for creating PDX1 mutations. Exons and introns are represented by boxes and lines, respectively, and sequences corresponding to the transactivation domain are indicated in blue. (B) Schematic of sgRNA targeting for the PDX1+/− iPSC line. Top: sgRNA targeting site is highlighted in green. PAM is highlighted in red. The sequencing analysis shows the desired mutation. (C) Schematic of sgRNA targeting for the PDX1P33T/P33T iPSC line. Top: sgRNA targeting site is highlighted in green. PAM is highlighted in red. ssODN sequence carrying mutation site A is highlighted in blue. The silent mutation is highlighted in yellow. The sequencing analysis shows the desired mutation. The black asterisk indicates the C>A switch. (D) Schematic of sgRNA targeting for the PDX1C18R/C18R iPSC line. Top: sgRNA targeting site is highlighted in green. PAM is highlighted in red. ssODN sequence carrying mutation site C is highlighted in blue. The sequencing analysis shows the desired mutation. The black asterisk indicates the T>C switch.
figs7
figs7
Suppl. Figure 7. The PDX1+/−, PDX1P33T/P33Tand PDX1C18R/C18Rmutant iPSCs are pluripotent in vitro. (A) PDX1+/−, PDX1P33T/P33T, and PDX1C18R/C18R iPSCs have normal karyotype. (B) PDX1+/−, PDX1P33T/P33T, and PDX1C18R/C18R iPSCs display typical morphological ESC-like characteristics and uniformly express several pluripotency markers. Scale bar indicates 75 μm.
figs8
figs8
Suppl. Figure 8. Characterization of PDX1+/−, PDX1P33T/P33T, and PDX1C18R/C18Rmutant iPSCs differentiated towards the endoderm stage. (A) Representative immunofluorescence staining for FOXA2 and SOX17 in XM001, PDX1+/−, PDX1P33T/P33T, and PDX1C18R/C18R cells at the endoderm stage. Scale bar indicates 50 μm. (B) Representative FACS plots for FOXA2+ and SOX17+ cells in the XM001, PDX1+/−, PDX1P33T/P33T, and PDX1C18R/C18R cells at the endoderm stage. (C) FACS quantification of the percentage of total FOXA2+ and SOX17+ cells in the XM001, PDX1+/−, PDX1P33T/P33T, and PDX1C18R/C18R cells at the endoderm stage (n = 3).
figs9
figs9
Suppl. Figure 9. PDX1 is important for the generation of glucose-responsive β-like cells. (A) Representative immunofluorescence staining for CPEP and SST in the XM001, PDX1+/−, PDX1P33T/P33T, and PDX1C18R/C18R cells at the S7 stage. Scale bar indicates 50 μm. (B) C-peptide secretion assay for XM001, PDX1+/−, PDX1P33T/P33T, and PDX1C18R/C18R cells at the S7 stage (n = 3).
figs10
figs10
Suppl. Figure 10. Principal component analysis of PP1 cells. (A) Principal component analysis PCA) of PPs derived from isogenic PDX1 mutant and control iPSCs. (B-C) Top 20 genes ranked by their contribution to PC1 and PC2, respectively.
figs11
figs11
Suppl. Figure 11. The PDX1 binding patterns are similar in patient-derived PDX1P33T/+and control PPs. (A) Comparison of the distribution of accessible sites in XM001 and PDX1P33T/+ PPs. (B) Comparison of the distances to the nearest TSSs of PDX1 binding sites in XM001 and PDX1P33T/+ PPs. (C) Read count of H3K27ac at the 8970 and 8288 PDX1 binding sites in PDX1P33T/+, XM001 PPs, respectively, and at three sets of 8970 and 8288 random sites of the same length distribution. H3K27ac is enriched >5 × at PDX1-bound sites compared to the random sites. P-value for all comparisons <2.2 × 10−16. (D) The comparison of the enrichment of PDX1 at the transcriptional start sites (TSS) of its target genes displayed as binding sites per base pair (bp) per gene over the genomic regions of all RefSeq genes in XM001 and PDX1P33T/+ PPs. (E, H, K) ChIP-seq data tracks showing the enrichment of H3K27ac and PDX1 at the loci of important pancreatic genes in XM001 and PDX1P33T/+ PPs. (F) The comparison of top motifs identified in PDX1 peaks. (G) The comparison of the H3K27ac signal around PDX1 binding sites. (I) Scatter plot comparing the log2 read counts from PDX1 ChIP-seq in PDX1P33T/+ and XM001. (J) Scatter plot comparing the log2 read counts from H3K27ac ChIP-seq in PDX1P33T/+ and XM001.

Similar articles

Cited by

References

    1. Ahlqvist E., Storm P., Käräjämäki A., Martinell M., Dorkhan M., Carlsson A. Novel subgroups of adult-onset diabetes and their association with outcomes: a data-driven cluster analysis of six variables. The Lancet Diabetes and Endocrinology. 2018;6(5):361–369. - PubMed
    1. Diagnosis and classification of diabetes mellitus. Diabetes Care. 2014;37(Supplement_1):S81–S90. - PubMed
    1. Hattersley A.T., Patel K.A. Precision diabetes: learning from monogenic diabetes. Diabetologia. 2017:769–777. - PMC - PubMed
    1. Staffers D.A., Ferrer J., Clarke W.L., Habener J.F. Early-onset type-ll diabetes mellitus (MODY4) linked to IPF1. Nature Genetics. 1997;17(2):138–139. - PubMed
    1. Heuvel-Borsboom H., de Valk H.W., Losekoot M., Westerink J. Maturity onset diabetes of the young: seek and you will find. The Netherlands Journal of Medicine. 2016:193–200. - PubMed

Publication types

MeSH terms