. 2019 May 2;74(3):466-480.e4.
doi: 10.1016/j.molcel.2019.02.032. Epub 2019 Mar 28.

TOP2β-Dependent Nuclear DNA Damage Shapes Extracellular Growth Factor Responses via Dynamic AKT Phosphorylation to Control Virus Latency

Affiliations

TOP2β-Dependent Nuclear DNA Damage Shapes Extracellular Growth Factor Responses via Dynamic AKT Phosphorylation to Control Virus Latency

Hui-Lan Hu et al. Mol Cell. .

Abstract

The mTOR pathway integrates both extracellular and intracellular signals and serves as a central regulator of cell metabolism, growth, survival, and stress responses. Neurotropic viruses, such as herpes simplex virus-1 (HSV-1), also rely on cellular AKT-mTORC1 signaling to achieve viral latency. Here, we define a novel genotoxic response whereby spatially separated signals initiated by extracellular neurotrophic factors and nuclear DNA damage are integrated by the AKT-mTORC1 pathway. We demonstrate that endogenous DNA double-strand breaks (DSBs) mediated by Topoisomerase 2β-DNA cleavage complex (TOP2βcc) intermediates are required to achieve AKT-mTORC1 signaling and maintain HSV-1 latency in neurons. Suppression of host DNA-repair pathways that remove TOP2βcc trigger HSV-1 reactivation. Moreover, perturbation of AKT phosphorylation dynamics by downregulating the PHLPP1 phosphatase led to AKT mis-localization and disruption of DSB-induced HSV-1 reactivation. Thus, the cellular genome integrity and environmental inputs are consolidated and co-opted by a latent virus to balance lifelong infection with transmission.

Keywords: AKT; DNA-PK; Herpes simplex virus-1 (HSV-1); Mre11-Rad50-Nbs1 (MRN); Non-homologous end-joining (NHEJ); PHLPP1; mTORC1; topoisomerase 2 beta (TOP2b); tyrosyl-DNA-phosphodiesterase 2 (TDP2); viral latency.


Figures

Figure 1.
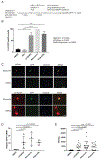
Figure 1.. DSB inducers cause HSV-1 reactivation in primary neurons
(A) Schematic for establishment of HSV-1 latency and reactivation in rat SCG-derived neuron cultures. Dissociated SCG were seeded and cultured for 7d in the presence of NGF and anti-mitotic agents to remove non-neuronal cells. Cells were then infected with HSV-1 GFP-Us11 in the presence of ACV for 6 d to allow the virus to establish a non-replicating infection. After ACV removal, cultures were treated with inhibitors or an shRNA-expressing lentivirus. GFP fluorescence was monitored in live cells and quantified (n=30). (B) Reactivation assay comparing the response of HSV-1 GFP-Us11 infected SCG neurons treated with Bleomycin (10 μM, 8 h), Etoposide (10 μM, 8 h), LY294002 (20 μM, 20 h), or DMSO. Following treatment, the drug was washed out and the neurons recovered for 6 d. Data for percentage of GFP+ wells are plotted (n=4) with mean ±s.e.m. and p-values calculated as indicated in STAR Methods. (C) HSV-1 latently-infected SCG neurons were established and treated with Etoposide as in (B) for 8 h, washed and incubated for an additional 40 h. Neurons were then fixed and probed with the indicated antibodies for indirect immunofluorescence (IF). Note that γH2AX levels remain present even in GFP-negative neurons (after Etoposide is washed out and recovered), suggesting that DNA repair is delayed in neurons and that the γH2AX signal is independent of viral replication. Nuclear DNA was visualized using Hoechst stain (blue), DMSO represents mock treatment. Bar = 50μm. (D) Latently-infected neurons were treated with the indicated chemical inducers as in (B) but were recovered for additional 12 h (except for LY294002 treatment). HSV-1 ICP27 mRNA levels were assessed by quantitative RT-PCR (qRT-PCR) with mean ±s.e.m. (n=4). (E) Infectious virus production was evaluated by plaque assay after 3 d of treatment as in (B). Bar graph shows the average number of plaque forming units (PFU) per well with mean ±s.e.m.
Figure 2.
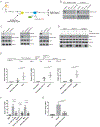
Figure 2.. Inhibition of NHEJ or the MRN complex causes HSV-1 reactivation
(A) Reactivation assay comparing the response of HSV-1 GFP-Us11 infected SCG neurons treated with either NU4771 (1 μM, 20 h), Mirin (100 μM, 20 h), LY294002 (20 μM, 20 h) or DMSO control, and then maintained for 6 d in fresh media. Data was plotted (n=6) and scored on successive days with mean ±s.e.m. (B) Latently-infected neurons were treated with the indicated chemicals as in A and ICP27 viral mRNA levels were quantified by qRT-PCR after 20 h of treatment (n=7) with mean ±s.e.m.). (C) Infectious virus production was evaluated by plaque assay after 3 d of treatment as in A. Bar graph shows the average number of plaque forming units (PFU) per well with mean ±s.e.m. (D) Depletion of Ku80 using lentiviral-transduced shRNAs in latently-infected SCG neurons. Following ACV removal, HSV1-GFP-Us11 latently-infected cultures were infected with two different lentiviruses expressing shRNAs against rat Ku80 or a lentivirus expressing a non-silencing shRNA (NS). Number of wells expressing GFP was scored after 5 d with mean ±s.e.m. (n=4). Knockdown efficiencies for individual shRNAs in latently-infected SCG neurons were confirmed by immunoblotting (D-G). (E-G) Depletion of the indicated rat gene products (Rad50, LIG3, LIG4) using two independent lentivirus shRNAs for each were performed and scored for reactivation as in (D).
Figure 3.
Figure 3.. DNA repair factors maintain HSV-1 latency through the canonical AKT-mTORC1 signaling axis
(A) Diagram of mTORC1 signaling induced by both the NGF-mediated TrkA/PI3K/PDK1/AKT/TSC pathway and DNA damage (and DNA repair inhibition) activation, leading to the maintenance of HSV-1 latency. Rheb is depicted in GDP- and GTP-bound forms. The Rheb (Q64L) mutant is a constitutively active protein that acts at the point shown (stabilization of the GTP-bound form) to bypass upstream AKT inhibition in order to activate downstream mTORC1 signaling. (B) Immunoblots comparing levels of AKT Ser473 phosphorylation in uninfected and HSV-1 latently-infected SCG neurons treated with either NU4771 (1 μM, 20 h), Mirin (100 μM, 20 h), LY294002 (20 μM, 20 h) or DMSO. LY294002 serves as a positive control for inhibiting AKT Ser473 phosphorylation. (C) Different DNA repair factors depleted by shRNAs for 5 d in uninfected SCG neurons were analyzed by immunoblotting for AKT Ser473 phosphorylation (see B) and other indicated proteins. (D) Uninfected SCG neurons were transduced with either empty vector or a Flag epitope-tagged Rheb (Q64L) expression construct and treated (see B) and analyzed by Western blot with the indicated antibodies. (E) Lentivirus-delivered expression of constitutively active Flag-Rheb (Q64L) in HSV-1 latently-infected SCG neurons in the presence or absence of treatment with Mirin, NU7441 or LY294002 for 20 h as indicated (see A). Viral ICP27 mRNA level was then quantified by qRT-PCR with mean ±s.e.m. (n=5). (F-G) Induction of ICP27 viral mRNA in response to the different DNA repair inhibitors (F) or shRNA knockdown of Ku80 (F) can be blocked by a JNK inhibitor. LY294002 serves as a positive control for the JNK inhibitor (Cliffe et al., 2015). Relative ICP27 mRNA levels were quantified by qRT-PCR after 20 h drug treatment and represent the mean ±s.e.m. (n=4).
Figure 4.
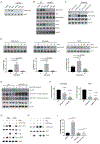
Figure 4.. Generation of endogenous TOP2βcc intermediates is critical for the maintenance of HSV-1 latency
(A) Uninfected SCG neurons were transduced with two different shRNAs against TOP2β and analyzed by Western blot for differences in AKT and H2AX phosphorylation levels. (B) TOP2β covalently-bound to genomic DNA from uninfected SCG neurons were isolated and displayed using a Dot blot method. Cells were treated either with Mirin or depleted of TOP2β with the indicated shRNAs. (C) HSV-1 latently-infected SCG neurons were transduced with non-silencing (NS) or TOP2β shRNAs for 3 days and scored for ICP27 or UL30 viral mRNA levels by qRT-PCR with the mean ±s.e.m. (n=4). (D) Uninfected SCG neurons were transduced with two different shRNAs against TDP2 and analyzed by Western blot for differences in AKT and H2AX phosphorylation levels (left panel). HSV-1 latently-infected SCG neurons transduced with either NS or two different TDP2 shRNAs were scored for GFP-positive neurons after 5 d (right panel). (E) Uninfected SCG neurons were transduced with Flag-Rheb (Q64L) and then shRNA against TOP2β to monitor relative efficiency of knockdown of TOP2β and Flag-Rheb (Q64L) expression by immunoblotting (left panel). HSV-1 latently-infected SCG neurons were transduced with either empty vector or Flag-Rheb (Q64L), and then with two different shRNAs against TOP2β (see schematics) and scored for UL30 or ICP27 viral mRNA levels by qRT-PCR with the mean ±s.e.m. (n=4) (right panels).
Figure 5.
Figure 5.. Loss of PHLPP1 causes sustained AKT Ser473 phosphorylation and reduced HSV-1 reactivation in response to DSB inducers
(A) Treatment of uninfected SCG neurons with NU7441 (DNA-PK activity inhibitor) prevents basal and DSB-induced AKT Ser473 phosphorylation. Samples were analyzed by Western blot with the indicated antibodies. (B) Uninfected SCG neurons were transduced with a lentivirus expressing a non-silencing shRNA (NS) or an shRNA specific for Ku80. Following treatment with either DMSO (control), Etoposide, or Bleomycin, total protein was analyzed by immunoblotting (see A). Phosphorylation of SGK1 (another substrate of AKT) served as a negative control. (C) Knockdown of RICTOR, a subunit of the mTORC2 complex, using two different lentivirus-delivered shRNAs had no detectable effect on Etoposide-induced AKT Ser473 phosphorylation. Samples were analyzed by immunoblotting (see A). (D) Time-course study performed using DSB inducers (Bleomycin, Etoposide) or the DNA repair inhibitor (Mirin) to analyze the kinetics of AKT Ser473 phosphorylation. Samples were analyzed by Western blot (top panels, a representative image of pS473-AKT and AKT signals) and quantified by ImageJ for the corresponding DSB inducers at the indicated time-points (bottom panels). The signal was normalized to endogenous AKT levels (pS473-AKT/AKT) as a ratio, with mean ±s.e.m. (n=3). (E) PHLPP1 depletion by lentivirus-delivered shRNA causes elevated and sustained AKT phosphorylation. Samples were analyzed by Western blot and probed with indicated antibodies. (F) Both Etoposide- and Mirin-induced HSV-1 reactivation are inhibited by PHLPP1-depletion using two different shRNAs. GFP-positive wells were scored after 6 d with mean ±s.e.m. (n=3). Knockdown efficiency of PHLPP1 in latently-infected SCG neurons was confirmed by immunoblotting (see Figure S4C). (G) TDP2-Flag overexpression hyper-activates AKT Ser473 phosphorylation in response to Etoposide. Uninfected SCG neurons were transduced with lentivirus expressing Flag epitope-tagged TDP2 (TDP2-Flag) for 3 d and then treated with Etoposide for the indicated times and analyzed by Western blot. (H) TDP2-dependent hyper-activation of AKT Ser473 phosphorylation by Etoposide requires DNA-PK activity. As in G except uninfected neurons transduced with TDP2-Flag were treated with Etoposide in the presence or absence of NU7441. (I) TDP2-Flag overexpression inhibits Etoposide-induced HSV-1 reactivation. HSV-1 latently-infected SCG neurons transduced with TDP2-Flag for 3 d were treated with Etoposide for 8 h. GFP-positive wells were scored after 3 d with mean ±s.e.m. (n=3).
Figure 6.
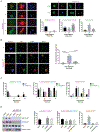
Figure 6.. AKT subcellular localization is controlled by both extracellular growth factor and nuclear DSB signaling
(A) Confocal microscopy images of uninfected SCG neurons untreated (0h) or treated with Etoposide for the indicated times (h) and subsequently immuno-stained with the indicated antibodies. Nuclear DNA was visualized using Hoechst stain (blue). The percentage of cells with either cytoplasmic, nuclear/cytoplasmic, or nuclear enriched AKT1 subcellular localization were quantified and displayed as bar graphs with mean ±s.e.m. (n=3). Representative images of AKT1 staining for cytoplasmic enriched (top panel, 0h), nuclear/cytoplasmic enriched (middle panel, 0h), and nuclear enriched (bottom panel, Etoposide 0.5h) are shown. Bar = 20μm. Images acquired from parallel cultures immuno-stained with anti-mTOR or TSC2 provide specificity controls. (B) Uninfected SCG neurons treated with Etoposide for the indicated time (h) were processed to detect chromatin-bound proteins in intact cells. Neurons were immuno-stained with the indicated antibodies and representative images of AKT1 and γH2AX co-localization are shown. The percentage of cells displaying 5 or more AKT1 nuclear foci per nuclei are quantified with mean ±s.e.m. (n=3). Bar = 10μm. (C) Comparing the impact of PHLPP1 shRNA knockdown versus non-silencing (NS) control shRNA on AKT subcellular distribution in uninfected SCG neurons treated with Etoposide for the indicated times (hrs). The percentage of cells with either cytoplasmic, nuclear/cytoplasmic, or nuclear enriched AKT1 subcellular localization were quantified and displayed as bar graphs with mean ±s.e.m. (n=3). (D) Cultured SCG neurons were treated with or without anti-NGF blocking antibody in the media to inhibit TrkA receptor activation and then treated with DMSO (vehicle control) or DSB inducers and samples were analyzed by Western blot as indicated. Subcellular AKT distribution was analyzed by immuno-staining and confocal microscopy imaging. The percentage of cells with either cytoplasmic, nuclear/cytoplasmic, or nuclear enriched AKT1 subcellular localization were quantified and displayed as bar graphs with mean ±s.e.m. (n=3).
Figure 7.
Figure 7.. A working model of how the spatial distribution of nuclear DNA damage and extracellular neurotrophic factor signaling coordinates AKT-mTORC1 activation
(A) Working model of how extracellular growth factor and TOP2β-mediated nuclear DNA damage signaling collaborate to sustain AKT-mTORC1 activation and maintain HSV-1 latency. NGF-dependent activation of TrKA leads to sustained AKT Thr308 phosphorylation. This step is critical for AKT to be phosphorylated on Ser473 by DNA-PK. DNA-PK is then activated from transient DSBs generated by TOP2βcc intermediates acted on by TDP2, which can occur at promoters of early-response host genes during normal neuronal activity (Madabhushi et al., 2015). The MRN complex is critical for the processing of TOP2βcc for both DNA repair (Hoa et al., 2016) and activation of DNA-PK (our study). We speculate that AKT undergoes continuous nucleocytoplasmic shuttling. AKT is likely phosphorylated on Thr308 at the plasma membrane by PDK1. This step is critical for initiating AKT nuclear translocation and phosphorylation by DNA-PK on Ser473, but negatively regulated by PHLPP1, leading to its nuclear export and activation of cytoplasmic AKT-mTORC1 canonical pathway. Continuous AKT-mTORC1 signaling is crucial for the maintenance of HSV-1 latency. Thus, sustained activation of the AKT-mTORC1 signaling axis in neurons requires consolidating two independent signals generated from potentially different cellular compartments (nuclear and plasma membrane/cytoplasm). During latency, histones at HSV-1 lytic promoters remain in a repressed state. Neuronal stress stimuli that trigger DLK/JIP3-mediated activation of JNK contribute to a histone methyl/phospho switch (Cliffe et al., 2015), and subsequent replacement by euchromatin-associated marks (not pictured).

Comment in

Similar articles

Cited by

References

    1. Anacker DC, and Moody CA (2017). Modulation of the DNA damage response during the life cycle of human papillomaviruses. Virus Res 231, 41–49. - PMC - PubMed
    1. Aparicio T, Baer R, Gottesman M, and Gautier J (2016). MRN, CtIP, and BRCA1 mediate repair of topoisomerase II-DNA adducts. J Cell Biol 212, 399–408. - PMC - PubMed
    1. Balasubramanian N, Bai P, Buchek G, Korza G, and Weller SK (2010). Physical interaction between the herpes simplex virus type 1 exonuclease, UL12, and the DNA double-strand break-sensing MRN complex. J Virol 84, 12504–12514. - PMC - PubMed
    1. Benboudjema L, Mulvey M, Gao Y, Pimplikar SW, and Mohr I (2003). Association of the herpes simplex virus type 1 Us11 gene product with the cellular kinesin light-chain-related protein PAT1 results in the redistribution of both polypeptides. J Virol 77, 9192–9203. - PMC - PubMed
    1. Bencherit D, Remy S, Le Vern Y, Vychodil T, Bertzbach LD, Kaufer BB, Denesvre C, and Trapp-Fragnet L (2017). Induction of DNA Damages upon Marek's Disease Virus Infection: Implication in Viral Replication and Pathogenesis. J Virol 91, pii: e01658–01617. doi: 01610.01128/JVI.01658-01617. - PMC - PubMed

Publication types

MeSH terms