. 2019 Apr 4;177(2):299-314.e16.
doi: 10.1016/j.cell.2019.02.013. Epub 2019 Mar 28.

Mitochondrial Permeability Uncouples Elevated Autophagy and Lifespan Extension

Affiliations

Mitochondrial Permeability Uncouples Elevated Autophagy and Lifespan Extension

Ben Zhou et al. Cell. .

Abstract

Autophagy is required in diverse paradigms of lifespan extension, leading to the prevailing notion that autophagy is beneficial for longevity. However, why autophagy is harmful in certain contexts remains unexplained. Here, we show that mitochondrial permeability defines the impact of autophagy on aging. Elevated autophagy unexpectedly shortens lifespan in C. elegans lacking serum/glucocorticoid regulated kinase-1 (sgk-1) because of increased mitochondrial permeability. In sgk-1 mutants, reducing levels of autophagy or mitochondrial permeability transition pore (mPTP) opening restores normal lifespan. Remarkably, low mitochondrial permeability is required across all paradigms examined of autophagy-dependent lifespan extension. Genetically induced mPTP opening blocks autophagy-dependent lifespan extension resulting from caloric restriction or loss of germline stem cells. Mitochondrial permeability similarly transforms autophagy into a destructive force in mammals, as liver-specific Sgk knockout mice demonstrate marked enhancement of hepatocyte autophagy, mPTP opening, and death with ischemia/reperfusion injury. Targeting mitochondrial permeability may maximize benefits of autophagy in aging.

Keywords: SGK; aging; autophagy; ischemia/reperfusion injury; longevity; mPTP; mTORC2; mitochondrial permeability.


Conflict of interest statement

DECLARATION OF INTERESTS

The authors declare no competing interests.

Figures
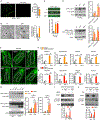
Figure 1.
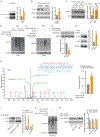
Figure 1.. mTORC2 Regulates Autophagy in Both C. elegans and Mouse Hepatocytes
(A) SGK-1::GFP detected by fluorescence microscopy, scale bar: 200 μm. (n = 67 worms for control and 69 for starvation, student’s t-test). (B) C. elegans sgk-1 mutants show increased autolysosomes (arrows) by electron microscopy versus wild type (wt), scale bar: 500 nm. (n = 59 and 87 for wt and sgk-1, respectively student’s t-test). (C) Increased autophagy levels in seam cells of rict-1 and sgk-1 mutants by GFP::LGG-1 puncta (n = 70, 73 and 71 for wt, rict-1, and sgk-1, respectively, one-way ANOVA). (D) Western blotting of LGG-1::GFP, LGG-1::GFP-PE and cleaved free GFP protein levels in fed and starved rict-1 and sgk-1 mutants (n = 8 biological replicates, one-way ANOVA). (E) Fluorescence microscopy of GFP::LGG-1 puncta in the proximal intestinal cells of rict-1 and sgk-1 mutants expressing wildtype LGG-1 or lipidation defective mutant LGG-1(G116A). (F and G) Quantification of GFP::LGG-1 puncta in the intestine, muscle, hypodermis and pharynx of rict-1 (F) and sgk-1 (G) mutants expressing LGG-1 or LGG-1(G116A). (n > 25 cells analyzed per group, two-way ANOVA). (H) GFP::LGG-1 and free GFP levels in wild type, rict-1, and sgk-1 mutants under vehicle and chloroquine (CQ, 100 mM for 18h) treatment. (n = 5 biological replicates, two-way ANOVA). (I) Autophagy in Sgk1 knockout (Sgk1(−/−)) AML12 hepatocytes as indicated by LC3A/B turnover in both full medium and Hank’s balanced salt solution (HBSS) starvation conditions (n = 6 for control and n = 5 HBSS, two-way ANOVA). (J) LC3A/B conversion in Sgk1(−/−) versus wild type (wt) AML12 cells with or without 50 μM chloroquine (CQ) for 4h (n =10 for vehicle and n = 6 for CQ, two-way ANOVA). See also Figure S1. *p < 0.05, **p < 0.01. All bars indicate means and SEM.
Figure 2.
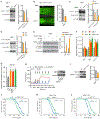
Figure 2.. Inhibition of Autophagy Restores Normal Lifespan in Short-Lived sgk-1 and rict-1 Mutants
(A-D) In sgk-1 and rict-1 mutants, RNAi of bec-1 (A and C) and lgg-1 (B and D) restores normal lifespan versus wild type (wt) worms treated with empty vector RNAi (ev) (log rank test). (E) GFP::LGG-1 puncta in the intestine are reduced by bec-1 RNAi in sgk-1 mutants, scale bar: 20 μm. (n = 45 worms for ev and n = 46 for bec-1, student’s t-test). (F and G) RNAi of unc-51 partially restores normal lifespan in sgk-1 (F) and rict-1 (G) mutants (log rank test). (H) HLH-30::GFP protein level in sgk-1 mutants and wildtype animals, scale bar: 200 μm. (n =20 worms for wt and n = 15 for sgk-1, student’s t-test). (I) Two different RNAi targeting hlh-30 both extend lifespan in sgk-1 and rict-1 mutants (log rank test). See also Figure S2. For tabular survival data and biological replicates see also Table S1. *p < 0.05, **p < 0.01, ***p < 0.001, ****p < 0.0001. All bars indicate means and SEM.
Figure 3.
Figure 3.. SGK-1 Regulates the mPTP Through Physical Interaction with VDAC-1
(A) Purified C. elegans Myc-tagged VDAC-1 protein is pulled down by GST-SGK-1 and not GST alone in vitro. (B) Endogenous VDAC1 is pulled down by native anti-SGK1 co-IP. (C) Endogenous SGK1 is pulled down by native anti-VDAC1 co-IP. (D) Calcium retention capacity assay in mouse Sgk1(−/−) and wt AML12 cells (arrows indicate calcium pulses). Equal numbers (1×10⁷) of cells were used and equivalent biomass was confirmed by western blotting for Actin (right panel). (E) RNAi of ant-1.1 restores normal lifespan in rict-1 and sgk-1 mutants (log rank test). (F) RNAi of vdac-1 partially restores normal lifespan in sgk-1 mutants (log rank test). (G) Lifespan extension by RNAi of F01G4.6 in sgk-1 mutants and wt C. elegans (log rank test). (H) RNAi of spg-7 extends lifespan in sgk-1 mutants (log rank test). (I) Fragmentation and abnormal cristae in sgk-1 mutants versus wt by electron microscopy (arrows indicate mitochondria), scale bar: 2 μm. (J) Oxygen consumption is decreased in both rict-1 and sgk-1 mutants versus wt (n = 6, one-way ANOVA). (K) Western blot for cytochrome C in wt animals and rict-1 and sgk-1 mutants. (n = 4, one-way ANOVA). See also Figure S3. For tabular survival data and biological replicates see also Table S1. *p < 0.05, **p < 0.01, ****p < 0.0001. All bars indicate means and SEM.
Figure 4.
Figure 4.. SGK1 Modulates VDAC1 Protein Ubiquitination and Degradation by Regulating Its Phosphorylation
(A) Western blot for VDAC-1::Flag protein levels in sgk-1 mutant worms versus wild type (n = 3, student’s t-test). (B) Western blotting for native VDAC1 protein in primary hepatocytes from Sgk1 liver specific knockout (Sgk1Lko) versus Sgk1flox/flox control mice (control) (n = 3 cell samples per group, each sample from 1 mouse, student’s t-test). (C) Native VDAC1 level by western blot in control Sgk1flox/flox and Sgk1Lko primary hepatocytes with or without proteasome inhibitor MG132 (5 μM for 16h) (n = 6 cell samples per group, each sample from 1 mouse, student’s t-test). (D-E) Overexpression of active SGK1-S422D (D) increases VDAC1 ubiquitination by western blotting for HA-Ub and (E) is unaffected by the PI3K inhibitor wortmannin. 293T cells were co-transfected with wildtype SGK1 (SGK1-WT) or active SGK1 (SGK1-S422D) with VDAC1-Myc and HA-ubiquitin for 48h. Results shown are representative of 3 biological replicates. (F) Overexpression of active SGK1-S422D decreases co-transfected VDAC1 protein level versus overexpression of inactive SGK1-S422A (n = 4, student’s t-test). (G) In vitro kinase assay shows increased serine phosphorylation of VDAC1 after incubation with SGK1 by western blot (n = 3, student’s t-test). (H) MS2 spectra identifies VDAC1 Ser104 (S#) as the SGK1 phosphorylation site (n = 2, student’s t-test). (I) SGK1 phosphorylates serine in wildtype VDAC1 but not VDAC1-S104A in vitro (n = 3, two-way ANOVA). (J) Ubiquitination of VDAC1 and VDAC1-S104A with overexpression of active SGK1-S422D by western blot. Results shown are representative of 3 biological replicates. (K) Overexpression of active SGK1-S422D decreases wildtype VDAC1, VDAC1-S101/102A but not VDAC1-S104A protein levels compared with inactive SGK1-S422A overexpression (n = 3, two-way ANOVA). See also Figure S4. *p < 0.05, **p < 0.01. All bars indicate means and SEM.
Figure 5.
Figure 5.. mPTP Opening Regulates Autophagy and Accelerates Aging
(A and B) RNAi of vdac-1 decreases GFP::LGG-1 and free GFP protein levels (A) and decreases GFP::LGG-1 foci (B) in intestine of sgk-1 mutants, scale bar: 20 μm (n = 3, two-way ANOVA for A; n = 60 for ev and n = 51 for vdac-1, student’s t-test for B). (C and D) In sgk-1 mutants, RNAi of ant-1.1 (C) or CsA treatment (D) decreases GFP::LGG-1 or free GFP protein levels (n = 3, two-way ANOVA). (E) Autophagic flux determined by LC3A/B I/II levels detected in 293T cells following overexpression of Vdac1 for 48h with and without 50 μM chloroquine (CQ) for 4h (n = 3, two-way ANOVA). (F and G) bec-1, lgg-1, unc-51 (F) and hlh-30 (G) mRNA levels in L4 stage wild type, rict-1, sgk-1 mutants and vdac-1 overexpression transgenics (n = 6, two-way ANOVA (F); n = 6, one-way ANOVA (G)). (H) mPTP opening by calcium retention assay (arrows indicate calcium pluses) in 293T cells expressing Myc-tagged mouse VDAC1 and C. elegans VDAC-1 (A). Equal numbers (2×10⁶) of cells were used and confirmed by blotting for Tubulin (right). (I) Decreased cytochrome C protein in vdac-1 transgenic C. elegans. (n = 3, student’s t-test). (J) vdac-1 overexpression shortens lifespan versus wt C. elegans (log rank test). (K-L) RNAi of bec-1 (K) or ant-1.1 (L) extends lifespan of the vdac-1 overexpression strain (log rank test). See also Figure S5. For tabular survival data and biological replicates see also Table S1. *p < 0.05, **p < 0.01, ****p < 0.0001. All bars indicate means and SEM.
Figure 6.
Figure 6.. Low Mitochondrial Permeability Is Required for Autophagy-Dependent Lifespan Extension
(A and B) Basal and maximal (FCCP) oxygen consumption (A) and ATP level (B) in sgk-1 mutants with empty vector (ev) or bec-1 RNAi. (n = 12, two-way ANOVA; n = 7, student’s t-test). (C) Cytochrome C western blot in sgk-1 mutants following RNAi of bec-1, lgg-1 or unc-51 (n = 4, one-way ANOVA). (D) bec-1 RNAi does not extend lifespan in mev-1(kn1);sgk-1 double mutants. (E) Larval knockdown of drp-1 extends lifespan in sgk-1 mutant worms (log rank test). (F-I) sgk-1 loss of function or overexpression of vdac-1 eliminate autophagy-dependent lifespan extension in both eat-2(ad465) mutants (F and H) and glp-1(e2141) mutants (G and I) (log rank test). (J) RNAi of frh-1 and nuo-6 extends lifespan in wild type worms but has no effect on vdac-1 transgenic worms (log rank test). See also Figure S6. For tabular survival data and biological replicates see also Table S1. *p < 0.05, **p < 0.01, ****p < 0.0001. All bars indicate means and SEM.
Figure 7.
Figure 7.. Mice lacking Sgk Are More Sensitive to Liver Ischemia/Reperfusion (I/R) Injury
(A) Hepatic warm I/R injury model. (B and C) Serum ALT (B) and AST (C) levels in 12-week-old Sgk1Lko versus control Sgk1flox/flox mice after hepatic I/R injury (n = 10 per group, student’s t-test). (D) Active, cleaved caspase 3 and LC3A/B II protein levels mice after hepatic I/R injury (n = 5 for control and n = 6 for Sgk1Lko, student’s t-test). (E) mRNA levels of inflammatory genes IL-1β and IL-6 by QPCR (n = 11 per group, student’s t-test). (F and G) Serum ALT (F) and AST (G) levels of 24-week-old SgkTKO mice versus Sgk1flox/flox control after hepatic I/R injury with or without cyclosporine A (CsA) pretreatment (n =8 for control and SgkTKO, and n = 7 for SgkTKO+CsA, one-way ANOVA). (H) Active, cleaved caspase 3 and LC3A/B protein levels in liver after hepatic I/R injury with or without CsA pretreatment (n =7 for control and SgkTKO+CsA, and n = 8 for SgkTKO, two-way ANOVA). (I) Model of the effect of autophagy on lifespan with facilitated opening of the mPTP (mPTP open) versus normal mitochondrial permeability (mPTP closed) conditions. *p < 0.05, **p < 0.01. All bars indicate means and SEM.

Comment in

Similar articles

Cited by

References

    1. Batandier C, Leverve X, and Fontaine E (2004). Opening of the mitochondrial permeability transition pore induces reactive oxygen species production at the level of the respiratory chain complex I. The Journal of biological chemistry 279, 17197–17204. - PubMed
    1. Betz C, Stracka D, Prescianotto-Baschong C, Frieden M, Demaurex N, and Hall MN (2013). Feature Article: mTOR complex 2-Akt signaling at mitochondria-associated endoplasmic reticulum membranes (MAM) regulates mitochondrial physiology. Proc Natl Acad Sci U S A 110, 12526–12534. - PMC - PubMed
    1. Bhamra GS, Hausenloy DJ, Davidson SM, Carr RD, Paiva M, Wynne AM, Mocanu MM, and Yellon DM (2008). Metformin protects the ischemic heart by the Akt-mediated inhibition of mitochondrial permeability transition pore opening. Basic Res Cardiol 103, 274–284. - PubMed
    1. Blackwell TK, Steinbaugh MJ, Hourihan JM, Ewald CY, and Isik M (2015). SKN-1/Nrf, stress responses, and aging in Caenorhabditis elegans. Free Radic Biol Med 88, 290–301. - PMC - PubMed
    1. Briston T, Roberts M, Lewis S, Powney B,J,MS, Szabadkai G, and Duchen MR (2017). Mitochondrial permeability transition pore: sensitivity to opening and mechanistic dependence on substrate availability. Sci Rep 7, 10492. - PMC - PubMed

Publication types

MeSH terms

Substances