. 2019 May 17;294(20):8197-8217.
doi: 10.1074/jbc.RA118.002829. Epub 2019 Mar 29.

The kinase PERK and the transcription factor ATF4 play distinct and essential roles in autophagy resulting from tunicamycin-induced ER stress

Affiliations

The kinase PERK and the transcription factor ATF4 play distinct and essential roles in autophagy resulting from tunicamycin-induced ER stress

Morten Luhr et al. J Biol Chem. .

Abstract

Endoplasmic reticulum (ER) stress is thought to activate autophagy via unfolded protein response (UPR)-mediated transcriptional up-regulation of autophagy machinery components and modulation of microtubule-associated protein 1 light chain 3 (LC3). The upstream UPR constituents pancreatic EIF2-α kinase (PERK) and inositol-requiring enzyme 1 (IRE1) have been reported to mediate these effects, suggesting that UPR may stimulate autophagy via PERK and IRE1. However, how the UPR and its components affect autophagic activity has not been thoroughly examined. By analyzing the flux of LC3 through the autophagic pathway, as well as the sequestration and degradation of autophagic cargo, we here conclusively show that the classical ER stressor tunicamycin (TM) enhances autophagic activity in mammalian cells. PERK and its downstream factor, activating transcription factor 4 (ATF4), were crucial for this induction, but surprisingly, IRE1 constitutively suppressed autophagic activity. TM-induced autophagy required autophagy-related 13 (ATG13), Unc-51-like autophagy-activating kinases 1/2 (ULK1/ULK2), and GABA type A receptor-associated proteins (GABARAPs), but interestingly, LC3 proteins appeared to be redundant. Strikingly, ATF4 was activated independently of PERK in both LNCaP and HeLa cells, and our further examination revealed that ATF4 and PERK regulated autophagy through separate mechanisms. Specifically, whereas ATF4 controlled transcription and was essential for autophagosome formation, PERK acted in a transcription-independent manner and was required at a post-sequestration step in the autophagic pathway. In conclusion, our results indicate that TM-induced UPR activates functional autophagy, and whereas IRE1 is a negative regulator, PERK and ATF4 are required at distinct steps in the autophagic pathway.

Keywords: GABA type A receptor-associated protein (GABARAP); activating transcription factor 4 (ATF4); autophagic degradation; autophagic sequestration; autophagy; endoplasmic reticulum stress (ER stress); inositol-requiring enzyme 1 (IRE1); microtubule-associated protein 1 light chain 3 (LC3); pancreatic EIF2-α kinase (PERK); protein degradation; signal transduction; tunicamycin (TM); unfolded protein response (UPR).


Conflict of interest statement

The authors declare that they have no conflicts of interest with the contents of this article

Figures
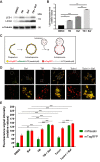
Figure 1.
Figure 1.
TM increases autophagic membrane flux in LNCaP cells. A, LNCaP cells were treated as indicated for 24 h, with Baf included the last 3 h only. Subsequently, protein extracts were prepared and subjected to immunoblotting for LC3 and α-tubulin as indicated. B, protein levels from three independent experiments as in A were quantified and normalized against α-tubulin (mean ± S.E. (error bars), n = 3). Red dots represent individual data points. Statistical significance was evaluated using repeated measures one-way ANOVA. *, p < 0.05; **, p < 0.01; ***, p < 0.001. C, illustration depicting the principle for the tandem fluorescent LC3 assay; mTagRFP-mWasabi-LC3 attached to phagophores and autophagosomes will be in an environment of neutral pH and therefore appear as yellow puncta (mix of green and red fluorescence). In contrast, mTagRFP-mWasabi-LC3 molecules that have reached the autolysosome will appear as red puncta because the green fluorescence from mWasabi, but not that from mTagRFP, is quenched in the acidic environment. D, LNCaP cells stably expressing mTagRFP-mWasabi-LC3 were treated for 24 h, as indicated, with Baf and Torin1 included the last 3 h only. Subsequently, cells were analyzed by live-cell fluorescence confocal microscopy. A representative image is shown for each treatment condition, and the white square insets in the top panels are shown in larger magnification in the bottom panels. Scale bar, 10 μm. E, LNCaP cells stably expressing mTagRFP-mWasabi-LC3 were treated for 24 h, as indicated, with Baf and Torin1 included the last 3 h only. Subsequently, cells were detached from the tissue culture plate and briefly treated with digitonin to permeabilize the plasma membrane and thereby deplete the cells of unconjugated, cytosolic mTagRFP-mWasabi-LC3 while preserving the conjugated, membrane-bound mTagRFP-mWasabi-LC3. Thereafter, the cells were analyzed for mWasabi and mTagRFP fluorescence intensity by flow cytometry. The results from three independent experiments are shown (mean ± S.E., n = 3). Black dots represent individual data points. Statistical significance was evaluated using repeated measures one-way ANOVA. **, p < 0.01; ***, p < 0.001.
Figure 2.
Figure 2.
TM increases autophagic sequestration and degradation activity in LNCaP cells. A, LNCaP cells were treated for 24 h, as indicated, with Baf and Torin1 included the last 3 h only, followed by determination of LDH sequestration (mean ± S. E. (error bars), n = 4). Bottom, the LDH sequestration assay measures autophagic sequestration of cytosol (autophagosome formation), using endogenous LDH as a cargo probe and a crude fractionation protocol to separate cytosolic (nonsedimentable) from sedimentable LDH (38–40, 46). In the presence of the lysosomal inhibitor Baf, the degradation of the LDH that resides inside autophagosomes is blocked, allowing specific analysis of autophagic sequestration activity. B, LNCaP cells transfected with siCtrl or siULK1 + siULK2 were treated for 24 h, as indicated, with Baf included the last 6 h only. LLPD was measured at 18–24 h (mean ± S.E., n = 3). Bottom, the LLPD assay measures endogenous degradation of long-lived proteins and is a classical method for monitoring autophagic flux (33, 48, 49). The method is a true end point assay of the autophagic pathway (i.e. it monitors the product of protein degradation). The proportion of autophagic–lysosomal LLPD is determined by treatment with Baf as well as by RNAi-mediated silencing of key autophagy-related genes, such as ULKs (49). Red dots represent individual data points. Statistical significance was evaluated using repeated measures one-way ANOVA for A and repeated measures two-way ANOVA for B. *, p < 0.05; **, p < 0.01; ***, p < 0.001. N.S., not significant.
Figure 3.
Figure 3.
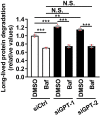
Silencing of GPT induces Baf-sensitive degradation of long-lived proteins. LNCaP cells were transfected with a nontargeting control siRNA (siCtrl) or two different GPT-targeting siRNAs. Subsequently, the cells were treated as indicated for 6 h, before measurement of LLPD (mean ± S.E. (error bars), n = 3). Red dots represent individual data points. Statistical significance was evaluated using repeated measures two-way ANOVA. **, p < 0.01; ***, p < 0.001. N.S., not significant.
Figure 4.
Figure 4.
TM induces Baf-sensitive degradation of long-lived proteins in HeLa and RPE-1 cells. HeLaT (A) or RPE-1 (B) cells were treated for 24 h, as indicated, with Baf included the last 4 h only. LLPD was measured at 20–24 h (mean ± S.E. (error bars), n ≥ 3 for HeLaT, n = 3 for RPE-1). Red dots represent individual data points. Statistical significance was evaluated using regular two-way ANOVA in A (HeLaT) and repeated measures two-way ANOVA in B (RPE-1). *, p < 0.05; **, p < 0.01; ***, p < 0.001. N.S., not significant.
Figure 5.
Figure 5.
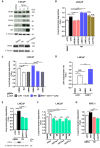
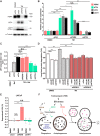
PERK and ATF4 are essential, whereas IRE1 restricts ER stress–induced autophagy. A, LNCaP cells were treated as specified and immunoblotted for the indicated proteins. Upward mobility shift in the PERK band reflects PERK phosphorylation, as verified in the bottom panel; PERKi reverses the shift. One representative of two independent experiments is shown. The blots were spliced at the locations indicated by the dotted lines. B–G, LNCaP (B–F) or RPE-1 (G) were transfected with the indicated siRNAs and treated as specified for 24 h (B, E, and F), 6 h (C), 4 h (D), or 22 h (G). LLPD was measured at 18–24 h (B, E, and F), 0–6 h (C), or 18–22 h (G). LDH sequestration was determined after 4 h of DMSO or Baf treatment (D). Results are the mean ± S.E. (error bars), n ≥ 3 (B), n = 3 (C and G), n ≥ 3 (D), n ≥ 4 (E), n = 4 (F). Red dots represent individual data points. Statistical significance was evaluated using regular (B and E) or repeated measures (G) one-way ANOVA and regular (D) or repeated measures (C and F) two-way ANOVA. *, p < 0.05; **, p < 0.01; ***, p < 0.001. N.S., not significant.
Figure 6.
Figure 6.
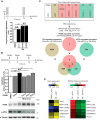
ATF4 regulates gene expression independently of PERK in TM-treated LNCaP cells. A, LNCaP cells were treated with DMSO for 24 h or with TM, which was washed out and replaced with DMSO after 1 h (0–1 h) or 18 h (0–18 h) or kept throughout (0–24 h). LLPD was measured at 18–24 h (mean ± S.E. (error bars), n = 4). B, LNCaP cells were treated as indicated, with PERKi present in the specified time periods. LLPD was measured at 18–24 h (mean ± S.E., n ≥ 4). Immunoblotting validated PERK inhibition by PERKi. C, LNCaP cells were siRNA-transfected, followed by treatment for 18 h, as indicated, and subjected to RNA-Seq. The Venn diagram displays the numbers and overlap of differentially expressed genes (padj < 0.05, log2 FC ≥ 1) in TM-treated siCtrl cells versus DMSO siCtrl cells (brown) and in TM-treated siCtrl cells versus TM-treated cells suppressed/silenced for PERK (red) or ATF4 (green) (n = 4). Genes were considered to be PERK-regulated (red) when mRNA expression was significantly altered (padj < 0.05, log2 FC ≥ 1.0) by all PERK-interfering conditions (PERKi, siPERK-1, and siPERK-2). Genes were considered to be ATF4-regulated (green) when mRNA expression was significantly altered (padj < 0.05, log2 FC ≥ 1.0) by all ATF4-interfering conditions (siATF4-1 and siATF4-2). The analysis was performed in this manner to eliminate genes that were altered due to nonspecific/off-target effects from chemical and genetic interference with PERK and ATF4. D, heat map depictions of RNA-Seq data for the six ATG genes whose expression was up-regulated more than 2-fold by TM (padj < 0.05). Left, normalized log2 reads count (expression). Right, log2 FCs of TM + siCtrl versus DMSO + siCtrl, and TM + siATF4–1 or -2 versus TM + siCtrl (differential expression). Red dots represent individual data points. Statistical significance was evaluated using repeated measures (A) or regular (B) one-way ANOVA or DESeq2 version 1.10.1 Bioconductor package (C and D). ***, p < 0.001. N.S., not significant.
Figure 7.
Figure 7.
ER stress–induced autophagy requires ATG13 and GABARAPs, but not WIPI1 or LC3s. A and B, LNCaP cells were siRNA-transfected, followed by treatment for 24 h, as indicated. LLPD was measured at 18–24 h (mean ± S.E. (error bars), n = 3). C, LNCaP cells were siRNA-transfected, followed by treatment for 24 h, as indicated, with Baf included the last 3 h only. LDH sequestration was determined at 21–24 h (mean ± S.E., n ≥ 3). D, LNCaP cells were transfected with siCtrl (0.025 nm) or siATG13 at the specified concentrations and treated for 24 h, as indicated. In parallel, we determined LLPD at 18–24 h (top; mean ± S.D. of three replicates), p-ATG13 and ATG13 protein levels by immunoblotting (middle), and ATG13 mRNA levels by real-time RT-PCR (bottom; mean ± S.D. of three replicates). One representative of two independent experiments is shown. E, LNCaP cells were siRNA-transfected, followed by treatment for 24 h, as indicated. LLPD was measured at 18–24 h (mean ± S.E., n = 3). Red dots represent individual data points. Statistical significance was evaluated using repeated measures two-way ANOVA (A, B, and E) or regular one-way ANOVA (C). **, p < 0.01; ***, p < 0.001. N.S., not significant.
Figure 8.
Figure 8.
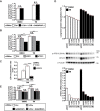
ATF4 and PERK act at distinct steps in the autophagic pathway. A, LNCaP cells were siRNA-transfected, followed by treatment for 18 h, as specified, and immunoblotted for the indicated proteins. B, protein levels from three independent experiments as in A were quantified and normalized against α-tubulin (mean ± S.E. (error bars), n = 3). C, LNCaP cells were siRNA-transfected, followed by treatment for 24 h, as indicated, with Baf included the last 3 h only. LDH sequestration was determined at 21–24 h (mean ± S.E., n = 3). D, LNCaP cells were siRNA-transfected, followed by treatment for 24 h, as indicated. LLPD was measured at 18–24 h (mean ± S.E., n = 4). E, LNCaP cells were siRNA-transfected, and total LDH sequestration was determined after 24 h DMSO or TM treatment (mean ± S.E., n ≥ 3). F, major findings of our study were as follows. TM induces autophagy via ER stress in a manner that requires the action of ATF4 and PERK at distinct steps in the autophagic pathway. ATF4 likely acts via transcription and is essential for autophagosome formation, which occurs in an ULK1/2-, ATG13-, and GABARAPs-dependent manner. TM-induced ER stress stimulates LC3 transcription and elevates LC3-I and -II protein levels via ATF4, but the implications of this remain to be determined, as TM-induced autophagy did not appear to require the LC3 protein family. Of note, TM-induced autophagy is nevertheless associated with LC3 flux through the pathway (not depicted). PERK regulates autophagy after phagophore closure, in a manner that is independent of ATF4 and likely also independent of transcription. This novel function of PERK was revealed in LNCaP and HeLa cells, where TM up-regulated ATF4 protein levels independently of PERK. In other cell lines where PERK and ATF4 are coupled (e.g. RPE-1 and PC3), PERK may regulate autophagy via ATF4 as well as via the novel ATF4-independent function revealed in the current study. Red dots represent individual data points. Statistical significance in B–D was determined using repeated measures one-way ANOVA, and in E it was determined using regular two-way ANOVA. *, p < 0.05; **, p < 0.01; ***, p < 0.001. N.S., not significant.

Similar articles

Cited by

References

    1. Hetz C., and Papa F. R. (2018) The unfolded protein response and cell fate control. Mol. Cell. 69, 169–181 10.1016/j.molcel.2017.06.017 - DOI - PubMed
    1. Yorimitsu T., Nair U., Yang Z., and Klionsky D. J. (2006) Endoplasmic reticulum stress triggers autophagy. J. Biol. Chem. 281, 30299–30304 10.1074/jbc.M607007200 - DOI - PMC - PubMed
    1. Bento C. F., Renna M., Ghislat G., Puri C., Ashkenazi A., Vicinanza M., Menzies F. M., and Rubinsztein D. C. (2016) Mammalian autophagy: how does it work? Annu. Rev. Biochem. 85, 685–713 10.1146/annurev-biochem-060815-014556 - DOI - PubMed
    1. Kabeya Y., Mizushima N., Ueno T., Yamamoto A., Kirisako T., Noda T., Kominami E., Ohsumi Y., and Yoshimori T. (2000) LC3, a mammalian homologue of yeast Apg8p, is localized in autophagosome membranes after processing. EMBO J. 19, 5720–5728 10.1093/emboj/19.21.5720 - DOI - PMC - PubMed
    1. Bestebroer J., V'kovski P., Mauthe M., and Reggiori F. (2013) Hidden behind autophagy: the unconventional roles of ATG proteins. Traffic 14, 1029–1041 10.1111/tra.12091 - DOI - PMC - PubMed

Publication types

MeSH terms