. 2019 Apr 16;116(16):7963-7972.
doi: 10.1073/pnas.1812413116. Epub 2019 Mar 28.

Ubiquitin C-terminal hydrolase L1 (UCH-L1) loss causes neurodegeneration by altering protein turnover in the first postnatal weeks

Affiliations

Ubiquitin C-terminal hydrolase L1 (UCH-L1) loss causes neurodegeneration by altering protein turnover in the first postnatal weeks

Anna T Reinicke et al. Proc Natl Acad Sci U S A. .

Abstract

Ubiquitin C-terminal hydrolase L1 (UCH-L1) is one of the most abundant and enigmatic enzymes of the CNS. Based on existing UCH-L1 knockout models, UCH-L1 is thought to be required for the maintenance of axonal integrity, but not for neuronal development despite its high expression in neurons. Several lines of evidence suggest a role for UCH-L1 in mUB homeostasis, although the specific in vivo substrate remains elusive. Since the precise mechanisms underlying UCH-L1-deficient neurodegeneration remain unclear, we generated a transgenic mouse model of UCH-L1 deficiency. By performing biochemical and behavioral analyses we can show that UCH-L1 deficiency causes an acceleration of sensorimotor reflex development in the first postnatal week followed by a degeneration of motor function starting at periadolescence in the setting of normal cerebral mUB levels. In the first postnatal weeks, neuronal protein synthesis and proteasomal protein degradation are enhanced, with endoplasmic reticulum stress, and energy depletion, leading to proteasomal impairment and an accumulation of nondegraded ubiquitinated protein. Increased protein turnover is associated with enhanced mTORC1 activity restricted to the postnatal period in UCH-L1-deficient brains. Inhibition of mTORC1 with rapamycin decreases protein synthesis and ubiquitin accumulation in UCH-L1-deficient neurons. Strikingly, rapamycin treatment in the first 8 postnatal days ameliorates the neurological phenotype of UCH-L1-deficient mice up to 16 weeks, suggesting that early control of protein homeostasis is imperative for long-term neuronal survival. In summary, we identified a critical presymptomatic period during which UCH-L1-dependent enhanced protein synthesis results in neuronal strain and progressive loss of neuronal function.

Keywords: UCH-L1; development; mTOR; neurodegeneration; protein synthesis.


Conflict of interest statement

The authors declare no conflict of interest.

Figures

Fig. 1.
Fig. 1.
Following a postnatal period of enhanced reflexes, Uch-l1+/d and Uch-l1d/d mice develop neurologic impairment. (A) qPCR for quantification of total brain UCH-L1 mRNA levels in 3- to 5-wk-old and 20- to 28-wk-old littermates; n = 5–7; **P < 0.01; n.d., not detected; n.s., not significant to +/+ weeks 20–28. (B) Frequency of genotypes resulting from heterozygous breeding; *P < 0.05 to Uch-l1+/+. (C) Development of body weight in Uch-l1+/d and Uch-l1d/d females and males; n = 16–20; ***P < 0.001 to Uch-l1+/+. (D) Micrographs of Uch-l1d/d at 25 wk, demonstrating muscle wasting of the hind legs in comparison with Uch-l1+/+. Postnatal reflexes such as (E) the cliff avoidance reflex postnatal day 5 (P5); n = 21–40 and (F) the righting reflex postnatal day 8 (P8) are enhanced in Uch-l1d/d and Uch-l1+/d mice; n = 21–40. Thereafter, neurological impairment is visible in the (G) accelerated rotarod at weeks 5 and 12 (W5, W12); n = 8–23, (H) open field test at week 7 (W7); n = 18–19, and (I) grip strength test at week 12 (W12); n = 18–19. *P < 0.05; **P < 0.01; ***P < 0.001 to age-matched Uch-l1+/+; §§P < 0.01; §§§P < 0.001 to Uch-l1+/d.
Fig. 2.
Fig. 2.
UCH-L1–deficient mice exhibit an age- and brain area-dependent reduction in monoubiquitin. (A) Western blot (WB) for monoubiquitin (mUB) and polyubiquitin (pUB) in Uch-l1+/d, Uch-l1d/d, and Uch-l1+/+ brain lysates of postnatal day 5 (P5), 3-wk-old (W3), and 20-wk-old (W20) mice. Densitometric quantification; 4 exp. n = 8–17; *P < 0.05, **P < 0.01 to Uch-l1+/+. (B) WB for mUB in five distinct brain areas of 3- and 25-wk-old mice. Graphs exhibit densitometric analysis; 3 exp. n = 5–8; *P < 0.05. (C) WB for mUB and UCH-L1 in cultured neurons from Uch-l1+/d, Uch-l1d/d, and Uch-l1+/+ littermates. Densitometric quantification; 4 exp. n = 7–8.
Fig. 3.
Fig. 3.
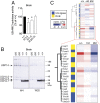
UCH-L1 deficiency is not significantly compensated by other DUBs. (A) UCH-based activity assay in brain lysates of 3- to 5-, 7- to 9-, and 20- to 25-wk-old Uch-l1d/d measures the hydrolysis of AMC from the synthetic substrate Ub-AMC by UCH deubiquitinating enzymes; n = 4–10; *P > 0.05 to Uch-l1+/+. (B) Ubiquitin-derived activity-based assay in brain lysates of 4- or 20-wk-old Uch-l1d/d or Uch-l1+/+ using the ubiquitin-vinylmethylester probe (HA-Ub-VME), which covalently binds to the active site (Cys) of DUBs. WB for the HA-tag exhibits active UCH-L1 with bound HA-Ub-VME probe at 38 kDa, which is absent in the Uch-l1d/d lysates. The other bands correspond to other active deubiquitinating enzymes as published (57); n = 3–5. (C) Proteome analyses of postnatal day 5 Uch-l1+/+, Uch-l1+/d, and Uch-l1d/d brains. Heat map shows extracted normalized label-free quantification (LFQ) intensities of all proteins assigned with deubiquitinase (DUB) activity or protein-ubiquitin ligase activity. The mean of each genotype is presented; n = 3. Significant alterations (FDR < 0.05, after correction for multiple testing) were UCH-L1 and HECTD1. The majority of DUB showed a decreased trend with knockout.
Fig. 4.
Fig. 4.
Proteasomal activity is enhanced in young UCH-L1–deficient mice followed by an age-dependent decline. (A) WB for the 20S core proteasomal subunit β5, which carries the chymotrypsin-like activity of the proteasome, of the regulatory 19S cap protein RPT1 and of the PA28α regulatory cap protein exhibits a postnatal and persistent up-regulation of proteasomal capacity in brain lysates of postnatal day 8 (P8), week 3 (W3), and week 20 (W20) Uch-l1d/d and Uch-l1+/+. Right graphs exhibit densitometric quantifications; 3 exp. n = 5–9; §§P < 0.01, §§§P < 0.001, §§§§P < 0.0001 (effect of genotype by two-way ANOVA). (B) Chymotrypsin-like activity of the proteasome; n = 5; *P > 0.05 to Uch-l1+/+. 10 µM MG132 was added to the brain lysate as an assay control. To assess proteasome function, UCH-L1–deficient mice were crossed to UBG78V-UB transgenic mice. (C) WB for UCH-L1, β5, and UBG76V-GFP in primary neurons from Uch-l1+/+, Uch-l1+/d, and Uch-l1d/d. Uch-l1d/d UBG76V-GFP neurons exhibit GFP accumulation despite increased proteasome levels; 3 exp. n = 7–10; *P < 0.05 to Uch-l1+/+. (D) Confocal images of UBG78V-GFP (green; DNA = blue) in the cerebellum of 20-wk-old Uch-l1d/d and Uch-l1+/+ UBG76V-GFP transgenic littermates exhibit GFP accumulation in neurons of Uch-l1d/d mice. (E) WB for UBG78V-GFP accumulation in four distinct brain areas of 3-wk- and 20-wk-old Uch-l1d/d versus Uch-l1+/+ UBG76V-GFP littermates, graph demonstrates densitometric quantification; 2 exp. n = 8–10; *P < 0.05; **P < 0.01; ***P < 0.001 to Uch-l1+/+.
Fig. 5.
Fig. 5.
Protein synthesis is enhanced in UCH-L1–deficient neurons. (A) Heat map of significantly changed eIF (eukaryotic translation initiation) subunit protein expression determined by proteomic analysis. Proteins of the eIF complex quantified with fold change of log2(d/d/control) or log2(d/+/control) larger 1 and FDR < 0.2, means per genotype; n = 3. (B and D) WB for the activation [phosphorylation (p)] of kinases involved in transcriptional activation such as the p70 ribosomal S6 protein kinases (S6K), ribosomal protein S6 (S6), the eukaryotic initiation factor 4E-binding proteins (4E-BPs), and for the large ribosomal subunit RPL7 in (B) postnatal day 5 (P5), 3-wk-old (W3), and 20-wk-old (W20) brain lysates of Uch-l1d/d and Uch-l1+/+ and in (D) cultured neurons. Right graphs demonstrate densitometric quantification in B 3 exp. n = 5–9; §P < 0.05, §§§P < 0.001, §§§§P < 0.0001 (effect of genotype by two-way ANOVA). In D 3 exp. n = 5–9; *P < 0.05 (Bonferroni test after one-way ANOVA). (C) Confocal images for ribosomal RPL7 (a and b), which localizes to NeuN positive neurons (a′ and b′) in frontal cortical neurons of 3-wk-old Uch-l1d/d and Uch-l1+/+. (E) Overlay of polysome profiles from neocortices of Uch-l1+/+, Uch-l1+/d, and Uch-l1d/d postnatal day 5. Graph: normalized polysome-to-monosome (p/m) ratio for Uch-l1+/d and Uch-l1d/d vs. Uch-l1+/+ neocortices; 3 exp. n = 3–6; *P < 0.05. (F) Bin analysis of changes in polysome fractions; 3 exp. n = 3–6; #P < 0.05 Uch-l1+/+ versus Uch-l1+/d and *P < 0.05 Uch-l1+/+ versus Uch-l1d/d at the indicated fraction, §P < 0.05 (effect of genotype x fraction, mixed two-way ANOVA). Note the significant shift of ribosomes from lighter to heavier polysomes in Uch-l1+/d and Uch-l1d/d. (G) Measurement of new protein synthesis rate in primary neurons by incorporation of the methionine analog l-AHA HCl during a 1-h pulse. Densitometric quantification of l-AHA incorporation; 3 exp. n = 8–14; **P < 0.01; ***P < 0.01 to Uch-l1+/+.
Fig. 6.
Fig. 6.
UCH-L1 defiency results in neuronal strain. Uch-l1d/d brains were analyzed for the occurrence of ER stress and for signs of energy depletion. (A) WB for the activation [phosphorylation (p)] of the sensor of unfolded proteins in the lumen of the ER, IRE1α, and of the molecular chaperone Grp78 in brain lysates of postnatal day 8 (P8), 3-wk-old (W3), and 20-wk-old (W20) Uch-l1d/d in comparison with Uch-l1+/+. Right graphs exhibit densitometric quantifications; 3 exp. n = 5–9; §§P < 0.01, §§§P < 0.001 (effect of genotype by two-way ANOVA). (B) Confocal images of pIRE1α (green), glial fibrillary acidic protein (GFAP, red), and DNA (blue) in cerebella of Uch-l1d/d in comparison with Uch-l1+/+ mice. Arrows: Purkinje cells. Note the enhanced signal for pIRE1α in the stratum granulosum in 3- and 20-wk-old Uch-l1d/d cerebella. (C) WB for Grp78 levels in primary neurons of Uch-l1d/d in comparison with Uch-l1+/+. Lower graph exhibits densitometric quantifications; 3 exp. n = 5–9; *P < 0.05 to Uch-l1+/+. WB for the mitochondrial membrane ATP synthase (ATPB) and the detoxifying enzyme manganese superoxide dismutase (MnSOD) in (D) brain lysates of postnatal day 8 (P8), 3-wk-old (W3), and 20-wk-old (W20) Uch-l1d/d; 3 exp. n = 5–15; and (E) in primary neurons of Uch-l1d/d in comparison with Uch-l1+/+. Graphs (D and E) exhibit densitometric quantifications; 3 exp. n = 8; §P < 0.05; *P < 0.05 to Uch-l1+/+, n.s., not significant. (F) Confocal images for ATBP in forebrain neurons of 3-wk-old Uch-l1d/d mice in comparison with Uch-l1+/+ mice. Arrows: Purkinje cells, note the enhanced signal for ATBP in Uch-l1d/d neurons.
Fig. 7.
Fig. 7.
mTORC1 inhibition by rapamycin reduces protein synthesis and ubiquitin accumulation in Uch-l1d/d cultured neurons. Primary neurons were treated for 1 h with rapamycin (rapa) or vehicle (veh). (A) Measurement of new protein synthesis rate by incorporation of the methionine analog l-AHA during a 1-h pulse and WB for biotin; pS6 to S6 ratio to control for mTORC1 inhibition. Right graph exhibits densitometric quantification of l-AHA incorporation; 4 exp. n = 4–22; *P < 0.05; **P < 0.01; ***P < 0.001 to Uch-l1+/+ vehicle, §P < 0.05 to Uch-l1+/d or to Uch-l1d/d vehicle. (B) WB for UCH-L1. Densitometric analyses exhibit the change of UCH-L1 protein levels with rapamycin treatment in individual (paired) neuronal cultures from Uch-l1+/+ or Uch-l1+/d littermate embryos; 2 exp. n = 4–9; *P < 0.05; **P < 0.01. (C) Confocal images for ubiquitin (green) and neurofilament (white) in primary neurons of Uch-l1d/d and Uch-l1+/+ with or without treatment with rapamycin or vehicle for 24 h. Arrows point toward ubiquitin aggregates in neurofilament positive processes. Graph exhibits quantification of mean intensity of fluorescence (MIF) of ubiquitin to neurofilament; 2 exp. n = 6; *P < 0.05 to Uch-l1+/+ vehicle; §P < 0.05 to Uch-l1d/d rapamycin.
Fig. 8.
Fig. 8.
Postnatal rapamycin treatment ameliorates neurodegenerative phenotype of UCH-L1–deficient mice. Litters from Uch-l1+/d females crossed with Uch-l1+/d males were treated on a daily basis with rapamycin (0.1 mg/kg) or vehicle (NaCl/ethanol) from postnatal day 1–8. Thereafter, treatment was stopped. (A) WB for the phosphorylation (p) status of mTORC1 substrate S6 ribosomal protein (S6) in brains from one litter. Graph demonstrates densitometric quantification; 4 litters n = 6–22; **P < 0.01, ***P < 0.001, ****P < 0.0001 to Uch-l1+/+; §P < 0.05, §§§§P < 0.0001 to Uch-l1+/d vehicle. (B) Chymotrypsin-like activity of the proteasome in brain lysates postnatal day 9 (P9), 24 h after termination of short-term treatment with rapamycin or vehicle; 3 litters n = 3–11; *P < 0.05 and ***P < 0.001 to Uch-l1+/+ vehicle; §§§P < 0.001 genotype comparison. (C) Measurement of the distance moved in the open field test and the maximal velocity performed at 12 wk of age, demonstrating partially rescued phenotype in Uch-l1d/d mice; 5 litters n = 5–17; *P < 0.05, ***P < 0.001 to Uch-l1+/+ vehicle; §P < 0.05; §§P < 0.01 genotype comparison. (D) Accelerated rotarod tests performed at 16 wk of age, demonstrating rescued neurological phenotype in Uch-l1+/d mice, 5 litters n = 2–15; ***P < 0.001 to Uch-l1+/+ vehicle, §§P < 0.01 to Uch-l1+/d vehicle. (E and F) Ubiquitin aggregates within the cerebellar white matter were quantified (E) and visualized (F) by immunofluorescent staining for ubiquitin (green), glial fibrillary acidic protein (GFAP, red), and DNA (blue). Graph exhibits quantification of five high power fields (hpf) of n = 3 mice per genotype and treatment; *P < 0.05 to vehicle Uch-l1+/+; §P < 0.05 to respective vehicle-treated genotype.

Similar articles

Cited by

References

    1. Komander D, Clague MJ, Urbé S. Breaking the chains: Structure and function of the deubiquitinases. Nat Rev Mol Cell Biol. 2009;10:550–563. - PubMed
    1. Day IN, Thompson RJ. UCHL1 (PGP 9.5): Neuronal biomarker and ubiquitin system protein. Prog Neurobiol. 2010;90:327–362. - PubMed
    1. Wilkinson KD, et al. The neuron-specific protein PGP 9.5 is a ubiquitin carboxyl-terminal hydrolase. Science. 1989;246:670–673. - PubMed
    1. Meyer-Schwesinger C, et al. A new role for the neuronal ubiquitin C-terminal hydrolase-L1 (UCH-L1) in podocyte process formation and podocyte injury in human glomerulopathies. J Pathol. 2009;217:452–464. - PubMed
    1. Miyoshi Y, et al. High expression of ubiquitin carboxy-terminal hydrolase-L1 and -L3 mRNA predicts early recurrence in patients with invasive breast cancer. Cancer Sci. 2006;97:523–529. - PMC - PubMed

Publication types

Substances