Modeling Patient-Derived Glioblastoma with Cerebral Organoids
- PMID: 30893594
- PMCID: PMC6625753
- DOI: 10.1016/j.celrep.2019.02.063
Modeling Patient-Derived Glioblastoma with Cerebral Organoids
Abstract
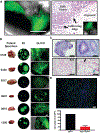
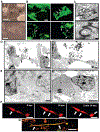
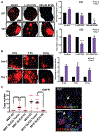
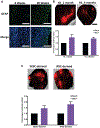
The prognosis of patients with glioblastoma (GBM) remains dismal, with a median survival of approximately 15 months. Current preclinical GBM models are limited by the lack of a "normal" human microenvironment and the inability of many tumor cell lines to accurately reproduce GBM biology. To address these limitations, we have established a model system whereby we can retro-engineer patient-specific GBMs using patient-derived glioma stem cells (GSCs) and human embryonic stem cell (hESC)-derived cerebral organoids. Our cerebral organoid glioma (GLICO) model shows that GSCs home toward the human cerebral organoid and deeply invade and proliferate within the host tissue, forming tumors that closely phenocopy patient GBMs. Furthermore, cerebral organoid tumors form rapidly and are supported by an interconnected network of tumor microtubes that aids in the invasion of normal host tissue. Our GLICO model provides a system for modeling primary human GBM ex vivo and for high-throughput drug screening.
Keywords: brain tumors; cancer stem cells; cerebral organoids; glioblastoma; glioma; glioma stem cells; human embryonic stem cells; stem-cell-based disease models; tissue engineering; tumor microtubes.
Copyright © 2019 The Author(s). Published by Elsevier Inc. All rights reserved.
Conflict of interest statement
DECLARATION OF INTERESTS
The authors declare no competing interests.
Figures


Comment in
-
New approaches to model glioblastoma in vitro using brain organoids: implications for precision oncology.Transl Cancer Res. 2019 Dec;8(Suppl 6):S606-S611. doi: 10.21037/tcr.2019.09.08. Transl Cancer Res. 2019. PMID: 35117142 Free PMC article. No abstract available.
Similar articles
-
Patient-derived glioblastoma stem cells transfer mitochondria through tunneling nanotubes in tumor organoids.Biochem J. 2021 Jan 15;478(1):21-39. doi: 10.1042/BCJ20200710. Biochem J. 2021. PMID: 33245115 Free PMC article.
-
Spontaneous Glioblastoma Spheroid Infiltration of Early-Stage Cerebral Organoids Models Brain Tumor Invasion.SLAS Discov. 2018 Sep;23(8):862-868. doi: 10.1177/2472555218764623. Epub 2018 Mar 15. SLAS Discov. 2018. PMID: 29543559
-
Altered lipid metabolism marks glioblastoma stem and non-stem cells in separate tumor niches.Acta Neuropathol Commun. 2021 May 31;9(1):101. doi: 10.1186/s40478-021-01205-7. Acta Neuropathol Commun. 2021. PMID: 34059134 Free PMC article.
-
Development of glioblastoma organoids and their applications in personalized therapy.Cancer Biol Med. 2023 Jun 5;20(5):353-68. doi: 10.20892/j.issn.2095-3941.2023.0061. Cancer Biol Med. 2023. PMID: 37283493 Free PMC article. Review.
-
Utility of the Cerebral Organoid Glioma 'GLICO' Model for Screening Applications.Cells. 2022 Dec 30;12(1):153. doi: 10.3390/cells12010153. Cells. 2022. PMID: 36611949 Free PMC article. Review.
Cited by
-
Advanced Spheroid, Tumouroid and 3D Bioprinted In-Vitro Models of Adult and Paediatric Glioblastoma.Int J Mol Sci. 2021 Mar 15;22(6):2962. doi: 10.3390/ijms22062962. Int J Mol Sci. 2021. PMID: 33803967 Free PMC article. Review.
-
Receptor Tyrosine Kinase Signaling and Targeting in Glioblastoma Multiforme.Int J Mol Sci. 2021 Feb 12;22(4):1831. doi: 10.3390/ijms22041831. Int J Mol Sci. 2021. PMID: 33673213 Free PMC article. Review.
-
Practical Review on Preclinical Human 3D Glioblastoma Models: Advances and Challenges for Clinical Translation.Cancers (Basel). 2020 Aug 19;12(9):2347. doi: 10.3390/cancers12092347. Cancers (Basel). 2020. PMID: 32825103 Free PMC article. Review.
-
Engineered Hydrogels for Brain Tumor Culture and Therapy.Biodes Manuf. 2020 Sep;3(3):203-226. doi: 10.1007/s42242-020-00084-6. Epub 2020 Jun 30. Biodes Manuf. 2020. PMID: 32754347 Free PMC article.
-
Modeling nervous system tumors with human stem cells and organoids.Cell Regen. 2023 Mar 1;12(1):4. doi: 10.1186/s13619-022-00150-7. Cell Regen. 2023. PMID: 36854987 Free PMC article. Review.
References
-
- Anisimov VN, Ukraintseva SV, and Yashin AI (2005). Cancer in rodents: does it tell us about cancer in humans? Nat. Rev. Cancer 5, 807–819. - PubMed
-
- Bao S, Wu Q, McLendon RE, Hao Y, Shi Q, Hjelmeland AB, Dewhirst MW, Bigner DD, and Rich JN (2006). Glioma stem cells promote radioresistance by preferential activation of the DNA damage response. Nature 444, 756–760. - PubMed
Publication types
MeSH terms
Grants and funding
LinkOut - more resources
Full Text Sources
Other Literature Sources
Medical
Research Materials
Miscellaneous

