Tumor response to irinotecan is associated with CYP3A5 expression in colorectal cancer
- PMID: 30881507
- PMCID: PMC6403523
- DOI: 10.3892/ol.2019.10043
Tumor response to irinotecan is associated with CYP3A5 expression in colorectal cancer
Abstract
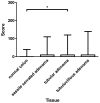
Recently, a tumor-autonomous cytochrome P450 (CYP)-3A5-mediated resistance to cancer therapy has been demonstrated in pancreatic ductal adenocarcinoma. Expression of CYP3A5, which is involved in the degradation of irinotecan, has also been reported in colorectal cancer (CRC). The aim of the present study was to analyze CYP3A5 expression in the normal colon, colon adenoma, CRC and normal tissues, as well as to examine whether CYP3A5 expression in CRC has an impact on tumor response to irinotecan treatment. Immunohistochemistry was used to assess 85 tissue samples from 65 patients with CRC, along with 15 samples of normal colon and 45 samples of colon adenoma (including tubular, tubulovillous, and sessile serrated adenomas), and a tissue microarray (TMA) comprised of 26 different normal tissue types. Expression of CYP3A5 was evaluated with a semi-quantitative score. Tumor response to irinotecan therapy was assessed according to the Response Evaluation Criteria in Solid Tumors (RECIST) 1.1 guidelines. In normal tissues, CYP3A5 was expressed in epithelial cells of the colon, gallbladder, kidney, liver, small intestine, stomach, thyroid gland and tonsil, as well as in nerves. Expression in colon mucosa was heterogeneous, with only weak staining in the minority of specimens. CYP3A5 exhibited markedly higher expression in adenomas compared with normal colon tissues. A statistically significant inverse correlation was identified between CYP3A5 expression in CRC tissues and tumor response to irinotecan therapy. Irinotecan treatment itself did not alter CYP3A5 expression in CRC tissues. As CYP3A5 is involved in the degradation of irinotecan, the significantly higher intratumoral expression of CYP3A5 in patients with CRC who do not respond to irinotecan-based chemotherapy may indicate a causal role of CYP3A5 in tumor resistance.
Keywords: RECIST; colorectal adenoma; colorectal cancer; cytochrome P450 3A5; immunohistochemistry; irinotecan; resistance.
Figures


Similar articles
-
Decreased expression of cytochrome P450 protein in non-malignant colonic tissue of patients with colonic adenoma.BMC Gastroenterol. 2005 Nov 10;5:34. doi: 10.1186/1471-230X-5-34. BMC Gastroenterol. 2005. PMID: 16281975 Free PMC article.
-
Nucleophosmin 1, upregulated in adenomas and cancers of the colon, inhibits p53-mediated cellular senescence.Int J Cancer. 2013 Oct 1;133(7):1567-77. doi: 10.1002/ijc.28180. Epub 2013 Apr 30. Int J Cancer. 2013. PMID: 23536448
-
Immunohistochemical Assessment of Transthyretin Association with Colorectal Adenocarcinoma.Clin Lab. 2021 Mar 1;67(3). doi: 10.7754/Clin.Lab.2020.200641. Clin Lab. 2021. PMID: 33739034
-
Implications of ABCG2 Expression on Irinotecan Treatment of Colorectal Cancer Patients: A Review.Int J Mol Sci. 2017 Sep 7;18(9):1926. doi: 10.3390/ijms18091926. Int J Mol Sci. 2017. PMID: 28880238 Free PMC article. Review.
-
Cellular irinotecan resistance in colorectal cancer and overcoming irinotecan refractoriness through various combination trials including DNA methyltransferase inhibitors: a review.Cancer Drug Resist. 2021 Nov 2;4(4):946-964. doi: 10.20517/cdr.2021.82. eCollection 2021. Cancer Drug Resist. 2021. PMID: 35582377 Free PMC article. Review.
Cited by
-
The Role of Cancer Stem Cells in Colorectal Cancer: From the Basics to Novel Clinical Trials.Cancers (Basel). 2021 Mar 4;13(5):1092. doi: 10.3390/cancers13051092. Cancers (Basel). 2021. PMID: 33806312 Free PMC article. Review.
-
Cellular Mechanisms Accounting for the Refractoriness of Colorectal Carcinoma to Pharmacological Treatment.Cancers (Basel). 2020 Sep 11;12(9):2605. doi: 10.3390/cancers12092605. Cancers (Basel). 2020. PMID: 32933095 Free PMC article. Review.
-
Persister cell phenotypes contribute to poor patient outcomes after neoadjuvant chemotherapy in PDAC.Nat Cancer. 2023 Sep;4(9):1362-1381. doi: 10.1038/s43018-023-00628-6. Epub 2023 Sep 7. Nat Cancer. 2023. PMID: 37679568 Free PMC article.
-
Research progress of traditional Chinese medicine as sensitizer in reversing chemoresistance of colorectal cancer.Front Oncol. 2023 Mar 13;13:1132141. doi: 10.3389/fonc.2023.1132141. eCollection 2023. Front Oncol. 2023. PMID: 36994201 Free PMC article. Review.
-
Emerging actionable targets to treat therapy-resistant colorectal cancers.Cancer Drug Resist. 2022 Jan 4;5(1):36-63. doi: 10.20517/cdr.2021.96. eCollection 2022. Cancer Drug Resist. 2022. PMID: 35582524 Free PMC article. Review.
References
LinkOut - more resources
Full Text Sources
Research Materials
