. 2019 Mar;567(7748):341-346.
doi: 10.1038/s41586-019-0993-x. Epub 2019 Mar 6.

Gboxin is an oxidative phosphorylation inhibitor that targets glioblastoma

Affiliations

Gboxin is an oxidative phosphorylation inhibitor that targets glioblastoma

Yufeng Shi et al. Nature. 2019 Mar.

Abstract

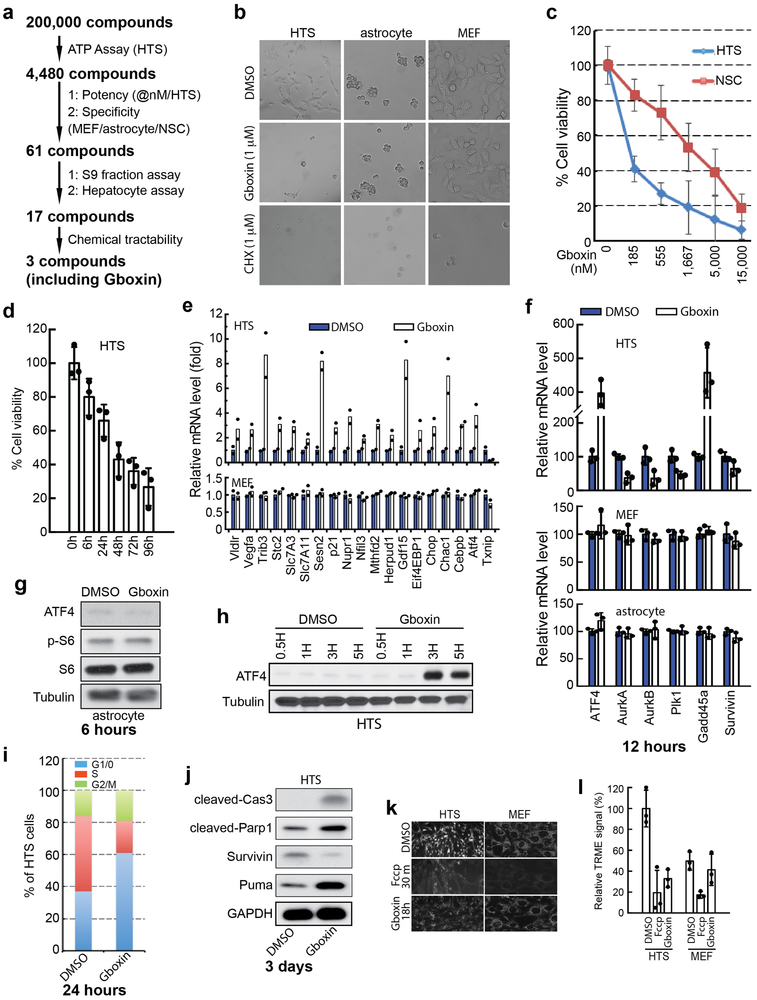
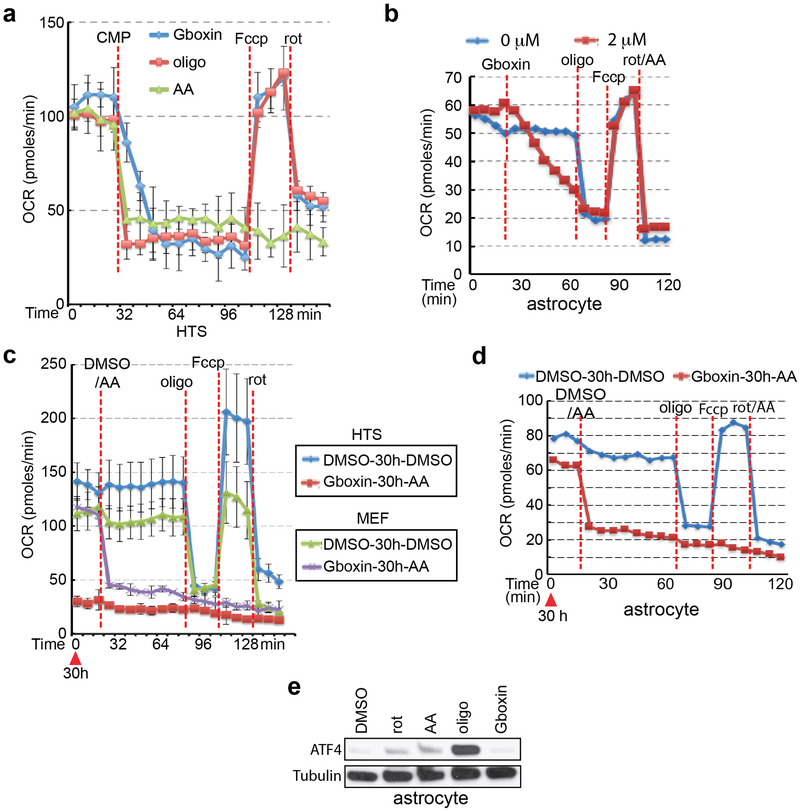
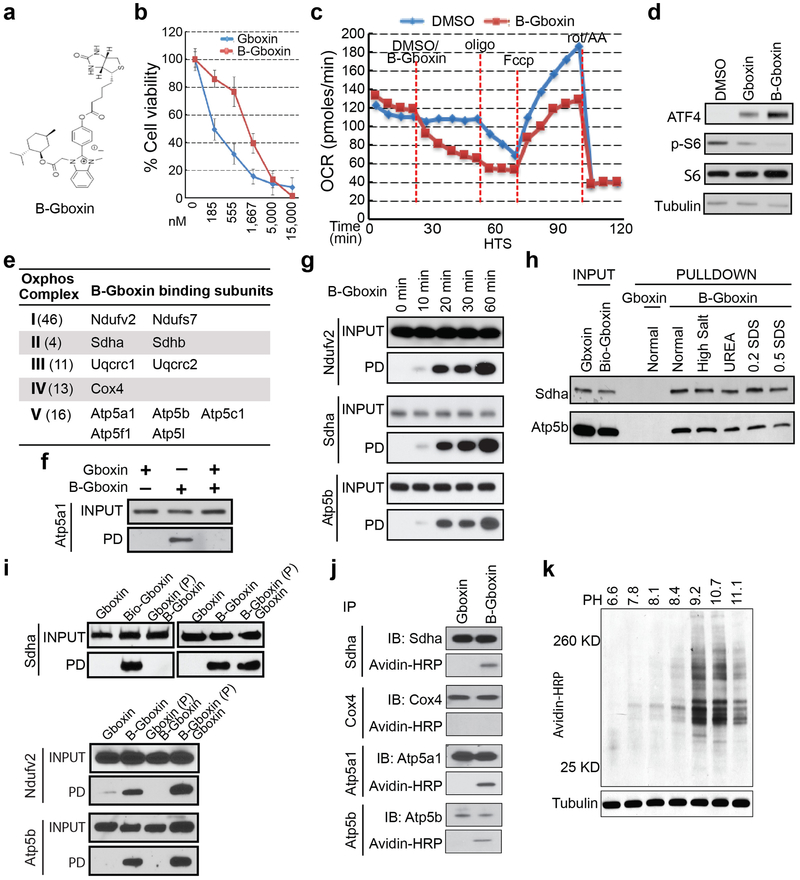
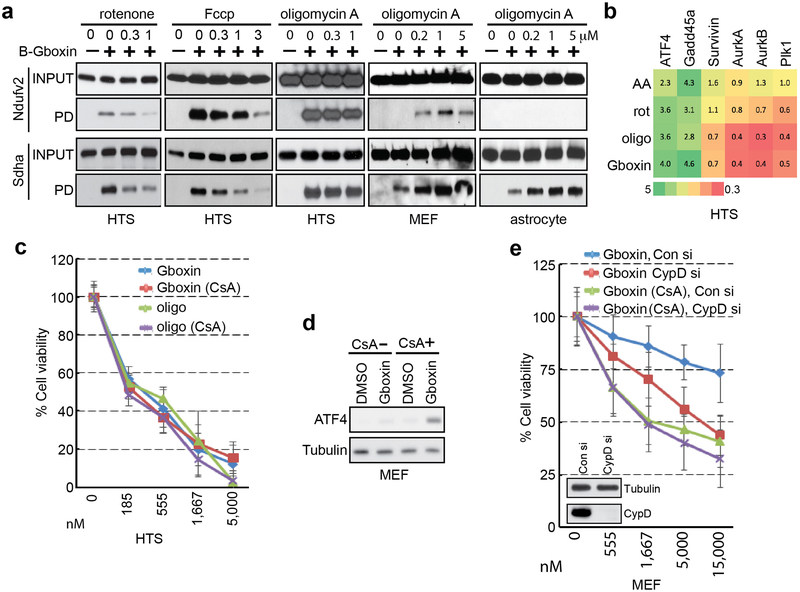
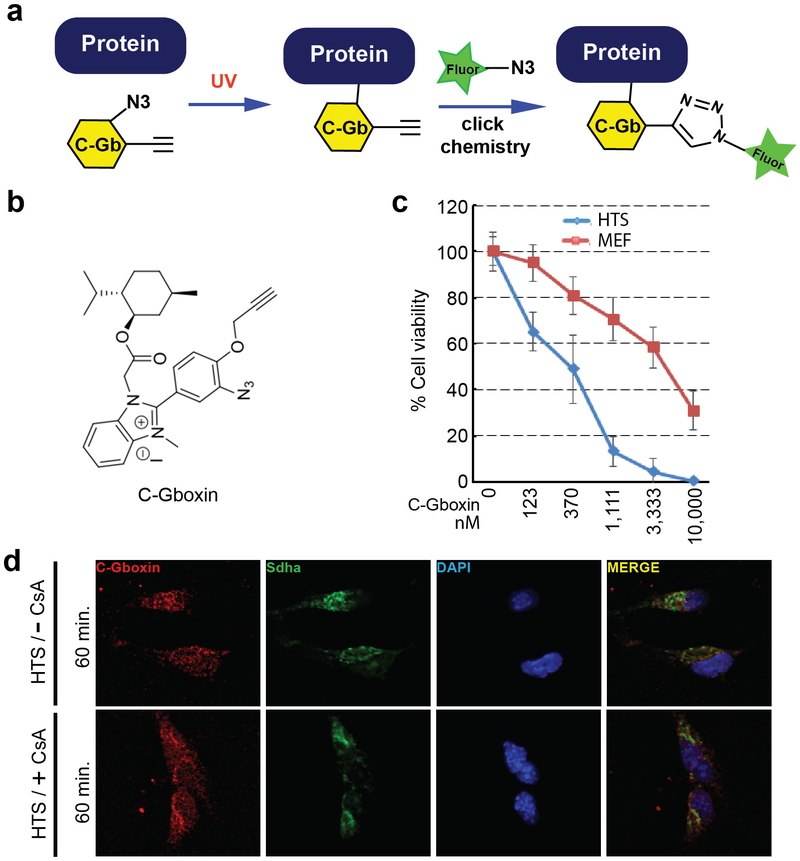
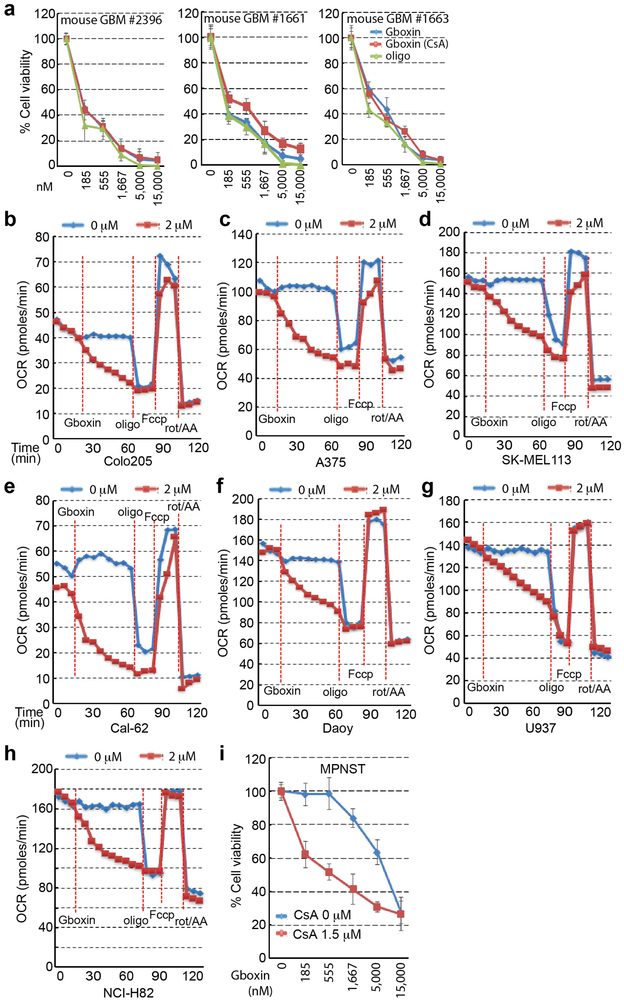
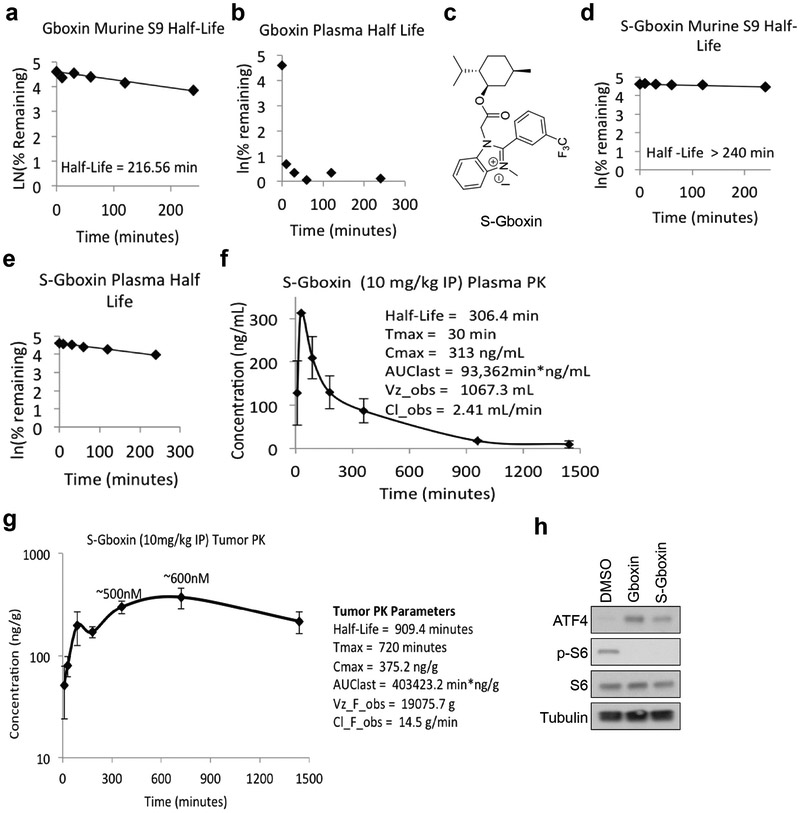
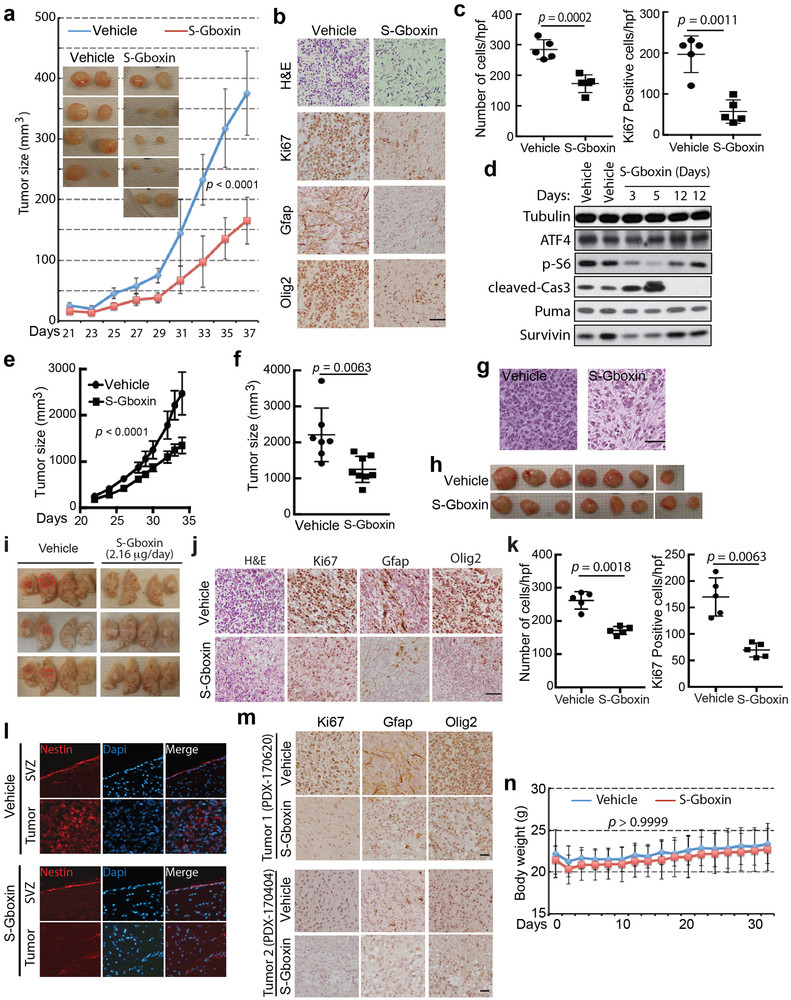
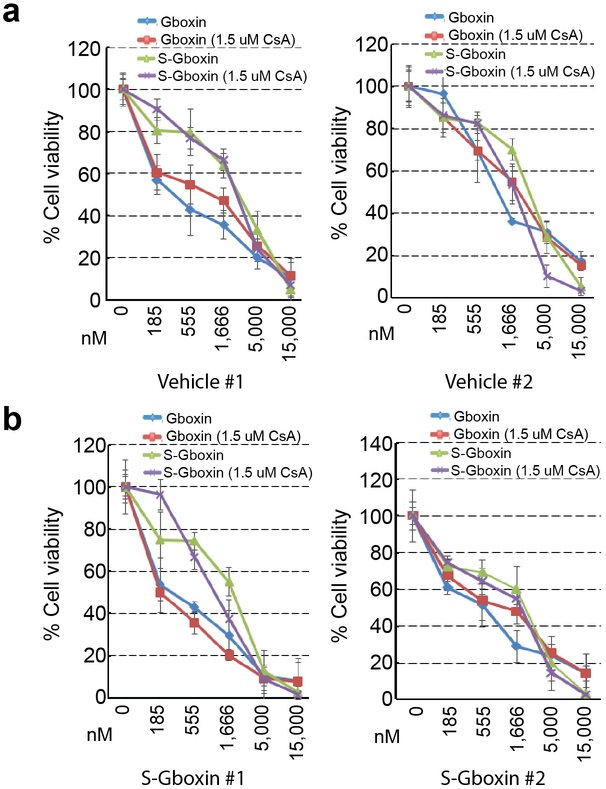
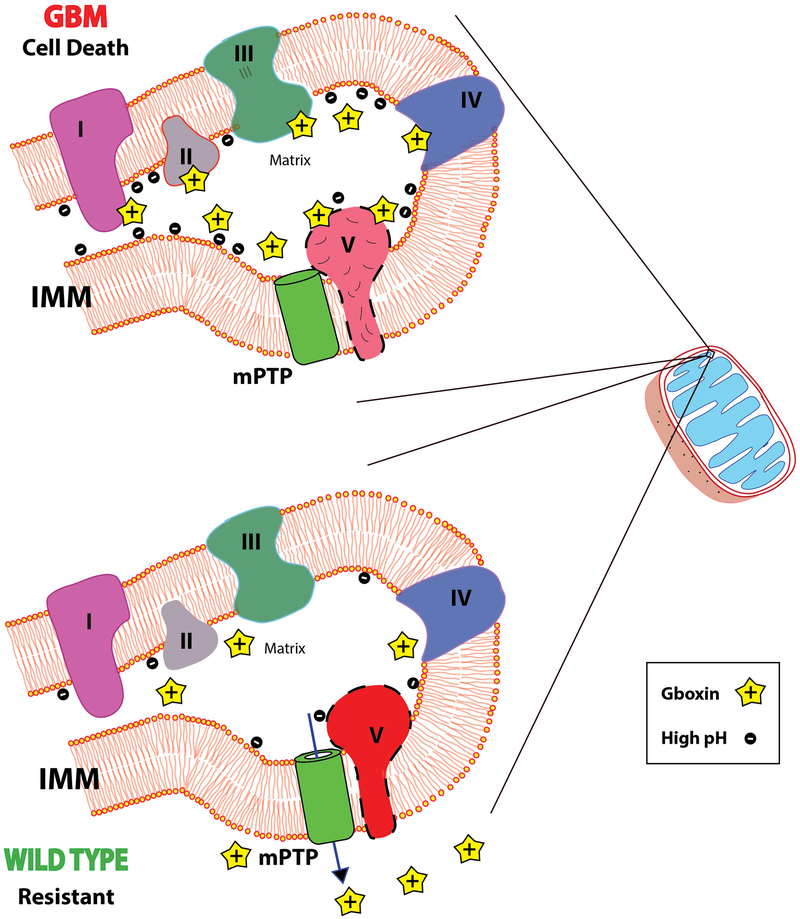
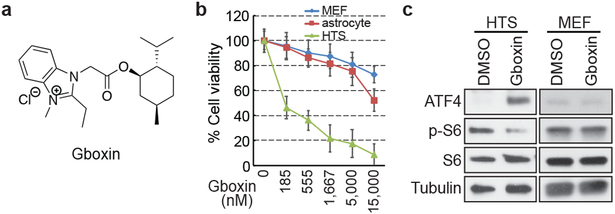
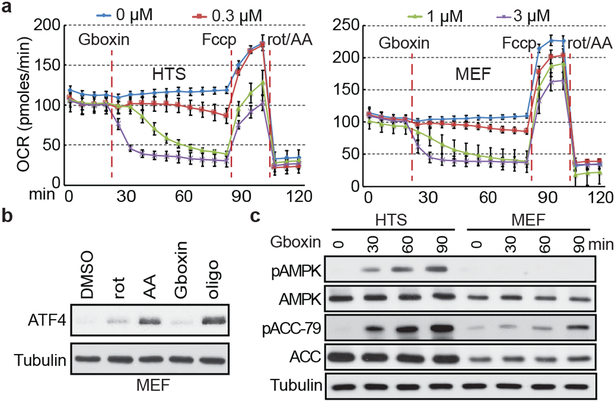
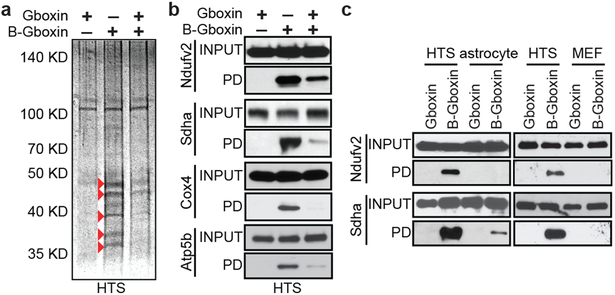
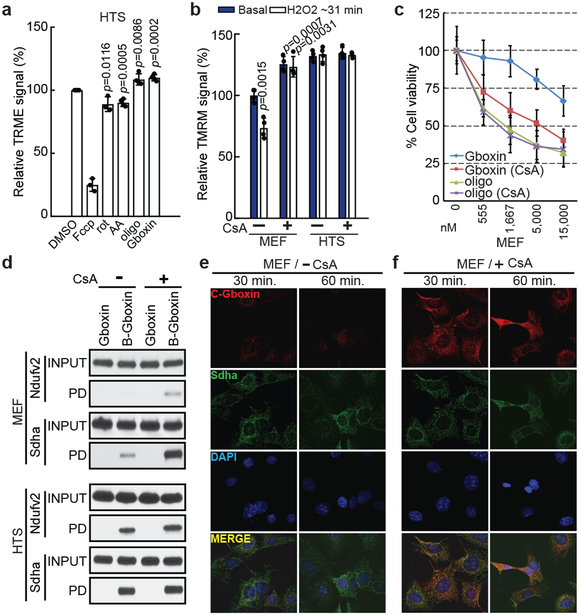
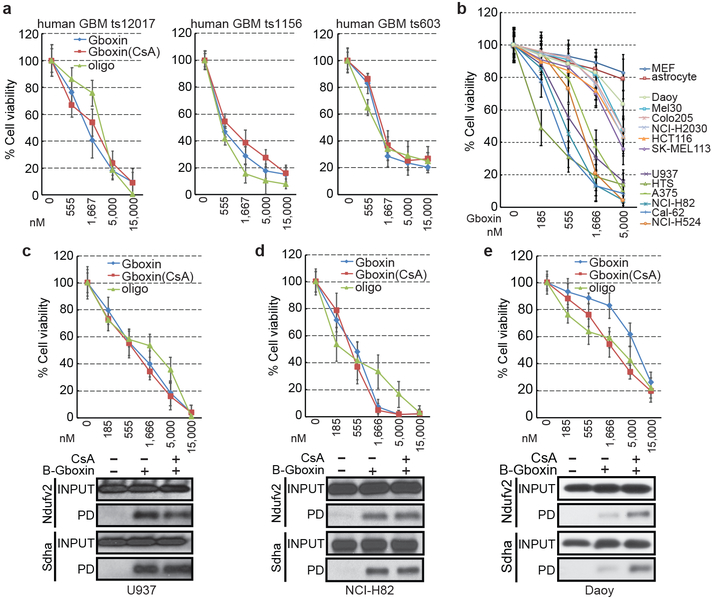
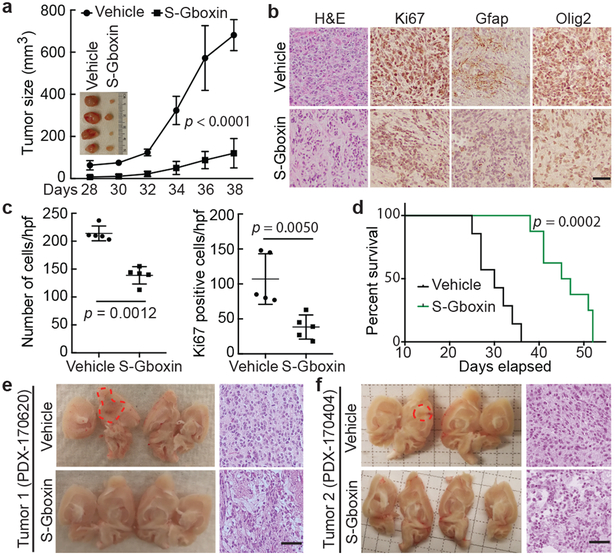
Cancer-specific inhibitors that reflect the unique metabolic needs of cancer cells are rare. Here we describe Gboxin, a small molecule that specifically inhibits the growth of primary mouse and human glioblastoma cells but not that of mouse embryonic fibroblasts or neonatal astrocytes. Gboxin rapidly and irreversibly compromises oxygen consumption in glioblastoma cells. Gboxin relies on its positive charge to associate with mitochondrial oxidative phosphorylation complexes in a manner that is dependent on the proton gradient of the inner mitochondrial membrane, and it inhibits the activity of F0F1 ATP synthase. Gboxin-resistant cells require a functional mitochondrial permeability transition pore that regulates pH and thus impedes the accumulation of Gboxin in the mitochondrial matrix. Administration of a metabolically stable Gboxin analogue inhibits glioblastoma allografts and patient-derived xenografts. Gboxin toxicity extends to established human cancer cell lines of diverse organ origin, and shows that the increased proton gradient and pH in cancer cell mitochondria is a mode of action that can be targeted in the development of antitumour reagents.


Figures

Extended Data Figure 1.
Extended Data Figure 1.. Gboxin, isolated from 200,000 compound screen, specifically inhibits GBM growth (HTS cells) but not MEFs or astrocytes.
a. Flow chart of the primary and secondary compound screens performed with HTS, MEF, astrocyte and neural/progenitor stem cells (NSCs). b. Representative live cell images show Gboxin specific toxicity of HTS cells. Cells were treated with DMSO, Gboxin (1 μM) or cycloheximide (CHX, 1 μM) for 3 days. n = 4. c. Cell viability assays for SVZ derived primary neural stem/progenitor cells (NSCs) and HTS cells treated with increasing doses of Gboxin indicate a therapeutic window for HTS cells. n = 3; mean ± SD. d. Cell viability assays show irreversible growth inhibition in HTS cells as early as 6-hours following Gboxin (1 μM) exposure. Cells were exposed to Gboxin for the indicated time periods followed by culturing in Gboxin free medium. Assay was performed 96 hours after initial compound treatment. n = 3; mean ± SD. e. Gboxin induces specific transcription alterations in HTS cells. mRNA specific RT-qPCR analyses in MEFs and HTS cells treated with DMSO or Gboxin for 12 hours. n = 2. f. mRNA specific RT-qPCR assays in HTS, MEF and astrocyte cells treated with DMSO or Gboxin (1 μM) for 12 hours demonstrate HTS specific up and down regulation of gene expression. Mean ± SD; n = 3. g. Representative western blot analyses with astrocyte cells treated with DMSO or Gboxin (1 μM) for 6 hours indicate no effect of Gboxin on expression of ATF4 and phospho-S6 (p-S6). n = 3. h. Representative western blot analyses using HTS cells exposed to DMSO or Gboxin (1 μM) detect ATF4 upregulation within 3 hours after Gboxin treatment. n = 2. i. HTS cell cycle progression analyzed by flow cytometry of cells treated with DMSO or Gboxin (1 μM) for 24 hours indicates an increase of G1/0:S ratio. j. Representative western blot analyses for proteins involved in apoptosis and survival with HTS cells treated with DMSO or Gboxin (1 μM) for 3 days. n = 3. k. Extended Gboxin exposure causes reduction of mitochondrial membrane potential in HTS cells. Representative images for TMRE staining show HTS cell specific neutralization of mitochondrial membrane potential after an 18-hour incubation with Gboxin. n = 3. l. quantification for k. Mean ± SD.
Extended Data Figure 2.
Extended Data Figure 2.. Gboxin mediated OxPhos inhibition is reversible in wildtype MEFs and astrocytes.
a-d. Graphs show oxygen consumption rates (OCR) as measured by Seahorse analyzer. a. OCR inhibition of HTS cells by three different compounds (CMP; 32 min.): Gboxin (blue), oligomycin A (red), and antimycin A (green). Fccp (112 min.) and rotenone (136 min.). n = 3; mean ± SEM. b. Gboxin causes acute OCR inhibition in primary neonatal astrocytes (2 μM, red line, 24 min.), oligomycin A (66 min.), Fccp (84 min.), and a mixture of rotenone and antimycin A (102 min.); n = 2. Mean is shown. c. MEFs (green and purple) but not HTS cells (blue and red) regain normal OCR in the presence of Gboxin. Cells pretreated with DMSO (blue and green) or Gboxin (red and purple) for 30 hours (time = 0; red arrowhead). Following the addition of DMSO (blue and green) or antimycin A (red and purple) at 24 min., oligomycin A (88 min.), Fccp (112 min.), and rotenone (136 min.). n = 3; mean ± SEM. d. Astrocytes overcome Gboxin mediated inhibition of OCR. Cells were pretreated with DMSO (blue line) or Gboxin (red lines) for 30 hours (time=0; red arrowhead), followed by the addition of DMSO (blue) or antimycin A (red) at 30hrs. + 18 min., oligomycin A (66 min.), Fccp (84 min.) and a mixture of rotenone and antimycin A (102 min.). n = 2; Mean is shown. e. Representative western blot analyses with astrocytes indicate that, unlike known OxPhos inhibitors, Gboxin treatment does not induce ATF4 expression after a 12-hour exposure. n = 3. rot: rotenone; AA: antimycin A; oligo: oligomycin A; rot/AA: a mixture of rotenone and antimycin A.
Extended Data Figure 3.
Extended Data Figure 3.. B-Gboxin interacts with OxPhos proteins.
a. B-Gboxin: structure of Gboxin with covalently linked biotin moiety. b. B-Gboxin toxicity on HTS cells at a higher IC50 (150 nM vs. 1,530 nM). n = 3; mean ± SD. c. B-Gboxin inhibits OCR in HTS cells. OCR was measured under basal conditions and following addition of DMSO (blue) or B-Gboxin (red line; 10 μM) at 24 min., oligomycin A (oligo; 54 min.), Fccp (72 min.), and a mixture of rotenone and antimycin A (rot/AA; 102 min.). n = 2; mean is shown. d. B-Gboxin mediates induction of ATF4 and suppression of p-S6 expression in HTS cells. Cells were treated with DMSO, Gboxin (1 μM), or B-Gboxin (10 μM) for 12 hours. n = 2. e. B-Gboxin associates with multiple components of OxPhos chain. B-Gboxin pulldown followed by mass-spectrometry analyses performed with purified mitochondria from HTS cells treated with Gboxin, B-Gboxin, or Gboxin followed by B-Gboxin. Number in parentheses shows the total known subunits for indicated OxPhos complexes. f-g. Representative western blot analyses validate interactions between B-Gboxin and OxPhos proteins. f. Western blot following biotin pulldown of B-Gboxin verifies complex V, Atp5a1, interaction that can be competed by Gboxin. HTS cells were treated with Gboxin, B-Gboxin, or Gboxin followed by B-Gboxin; n = 3; g. B-Gboxin/OxPhos protein interactions can be detected by pulldown within 10 minutes. HTS cells were treated with B-Gboxin for the indicated time periods; n = 2; h-k. (see Supplementary Results), Evidence of covalent interaction between B-Gboxin and OxPhos proteins. h. Input: Western blots for OxPhos proteins Atp5b or Sdha of HTS cells incubated with Gboxin or B-Gboxin. Pulldown: No signal with Gboxin. B-Gboxin pulldowns were not disrupted by pretreatment of sample with high salt (NaCl 300 mM), Urea (3 M) or SDS (0.2% and 0.5%). n = 2. i. Incubation with Gboxin after preincubation with B-Gboxin cannot displace B-Gboxin interactions with OxPhos proteins, however preincubation with Gboxin followed by B-Gboxin can displace these interactions. HTS cell pulldown assays were treated as indicated. P: preincubated. n = 2. j. Western blot analysis for OxPhos proteins and B-Gboxin binding proteins following immunoprecipitation (IP) assays for corresponding OxPhos proteins as indicated. IB: immunoblot. n = 2. k. Western blot images for B-Gboxin interaction with cell lysate proteins as a function of increasing pH. HTS cell lysates were incubated with B-Gboxin, and pH was adjusted using sodium hydroxide. n = 3.
Extended Data Figure 4.
Extended Data Figure 4.. Gboxin interacts with OxPhos proteins in a mitochondrial membrane potential dependent manner, leading to complex V inhibition.
a. Depolarization of mitochondrial inner membrane potential dissipates Gboxin association with OxPhos proteins in HTS cells while increase in membrane potential enhances MEF and astrocyte interactions. HTS, MEF, or astrocyte cells pretreated with different doses of OxPhos inhibitors for 10 minutes and followed by incubating with B-Gboxin for 1 hour. Fccp and rotenone depolarize or decrease mitochondrial inner membrane potential respectively. Oligomycin A mediates increase in membrane potential. PD: pulldown. n = 2. b. RT-qPCR analyses for gene expression change in HTS cells treated with antimycin A, rotenone, oligomycin A, or Gboxin. Fold change in gene expression was compared to DMSO treated cells show enhanced up regulation of Survivin, aurora kinases and Plk1 in oligomycin A and Gboxin treated cells. n = 2. c. Cell viability assays for cells treated with increasing doses of Gboxin or oligomycin A in the presence or absence of CsA. HTS cells are unresponsive to CsA mPTP blockade. Mean ± SD; n = 3. d. MEF mPTP inhibition (CsA) elicits ATF4 cell stress response to Gboxin. Representative western blot for ATF4 expression in MEFs treated with Gboxin (1 μM) in the presence/absence of CsA for 6 hours. n = 2. e. Cell viability assays for MEFs transfected with control siRNA (Con si) or Cyclophilin D siRNA (CypD si) exposed to increasing doses of Gboxin in the presence/absence of CsA (1 μM). Inset shows western blot image for efficiency of CypD knockdown. Mean ± SD; n = 3. rot: rotenone; AA: antimycin A; oligo: oligomycin A.
Extended Data Figure 5.
Extended Data Figure 5.. C-Gboxin, a functional Gboxin analog amenable for live cell UV crosslink conjugation and click chemistry.
a. scheme for C-Gboxin (C-Gb) detection in live cells following UV crosslinking and fluorophore click chemistry. b. C-Gboxin structure. c. Cell viability assays show C-Gboxin inhibits HTS cells (IC ~350nm) and not MEF cells (IC50>5um) treated with increasing doses of C-Gboxin. n = 3; mean ± SD. d. C-Gboxin spontaneously accumulates in HTS GBM cell mitochondria. n = 3.
Extended Data Figure 6.
Extended Data Figure 6.. Gboxin exerts toxicity on primary mouse GBM cells and inhibits OCR in sampled human cancer cell lines.
a. Gboxin inhibition of three primary mouse GBM cell cultures (#2396, #1661, and #1663), established from NF1/Trp53/Pten mutant GBM, treated with increasing doses of oligomycin A (oligo) or Gboxin in the presence/absence of CsA (1 μM). n = 3, mean ± SD. b-h. OCR Seahorse measurements in sampled cell lines (Colo205, A375, SK-MEL113, Cal-62, Daoy, U937, NCI-H82) under basal conditions and following addition of DMSO or Gboxin (blue or red lines respectively; 18 min.), oligomycin A (oligo; 66 min.), Fccp (84 min.), and a mixture of rotenone and antimycin A (rot/AA; 102 min.). n = 2; mean is shown. i. Viability assay for primary mouse malignant peripheral nerve sheath tumor (MPNST) cells carrying Trp53 and NF1 mutations indicates Gboxin resistance and induced sensitivity by inhibition of mPTP. Thus, Gboxin sensitivity is not directly linked to NF1 and Trp53 driver mutations. n = 3; mean ± SD.
Extended Data Figure 7.
Extended Data Figure 7.. S-Gboxin is pharmacokinetically stable and suitable for in vivo studies.
a. Gboxin S9 half-life. n = 1. b. Gboxin plasma half-life. n = 1. c. S-Gboxin structure. d. S-Gboxin S9 half-life. n = 1. e. S-Gboxin plasma half-life. n = 1. f. S-Gboxin plasma PK data. n = 3; mean ± SD. g. S-Gboxin tumor PK data. n = 3 to 6 at each time point; mean ± SD. Plasma (f) and tumor (g) PK data indicates S-Gboxin is suitable for in vivo studies. h. Representative western blots show S-Gboxin, like its original compound Gboxin, upregulates ATF4 and suppresses p-S6 expression in HTS GBM cells. Cells were treated with DMSO, Gboxin (1 μM), or S-Gboxin (1 μM) for 12 hours. n = 2.
Extended Data Figure 8.
Extended Data Figure 8.. S-Gboxin inhibits mouse and human GBM growth in vivo.
a-c. 105 HTS cells subcutaneously injected into flanks of nude mice were treated IP daily with vehicle or S-Gboxin commencing 2 weeks after allograft. a. Tumor growth by volume (W x L x H) assessed every 2 days. Insets are representative images for vehicle or S-Gboxin treated tumors harvested after mice were sacrificed. Vehicle: n=8, S-Gboxin: n=11; Mean ± SD; two-way ANOVA. b. Representative H&E and immunohistochemical staining for Ki67, GFAP and Olig2 indicating reduced cellularity, proliferation, and expression of glioma markers after S-Gboxin treatment. Scale bar = 50 μm. n = 2. c. Quantification of tumor cellular density (top panel) and Ki67 positive cells (bottom panel) in vehicle or S-Gboxin treated mouse flank tumors. For each graph, 5 representative images from 2 different tumors were used. Hpf: high power field; Mean ± SD; paired t test, two-tailed. d. Molecular analysis shows S-Gboxin inhibition of p-S6 and transient induction of tumor cell apoptosis as manifested by upregulated cleaved-Cas3 and down regulated Survivin expression at day 3 and 5 after treatment. n = 2. e-h. 2×10⁵ primary PDX cells (ts1156) mixed with matrigel subcutaneously injected into flanks of nude mice were IP treated daily with vehicle or S-Gboxin commencing 3 days after xenograft implantation. e. Graph represents tumor growth measured by tumor volume (W x L x H) assessed every 2 days. Vehicle: n=7, S-Gboxin: n=8; mean ± SEM; two-way ANOVA. f. Quantification of tumor size on the day mice were sacrificed. Vehicle: n=7, S-Gboxin: n=8; unpaired t test, two-tailed. g. Representative H&E staining images for PDX tumors (ts1156) treated with vehicle or S-Gboxin show reduced cellularity after S-Gboxin treatment. Scale bar = 25 μm. n = 2. h. Images show reduced size of S-Gboxin treated PDX tumors (ts1156) harvested after mice were sacrificed. i-k. Intracranial transplantation of primary mouse GBM cells (#1663), followed by installation of subcutaneous minipumps with intracranial catheters after 2 weeks for local delivery of vehicle or S-Gboxin (2.16 μg/day). n=5 for each group. i. Representative images of tumor bearing brains following vehicle or S-Gboxin treatment. Note the marked hemorrhage of tumors (dotted redlines) from vehicle treated brains. j. Representative H&E and immunohistochemical staining of Ki67 and glioma markers (Gfap and Olig2) indicating reduced cellularity, proliferation, and glioma markers in S-Gboxin treated brains. k. Quantification of tumor cellular density (left) and Ki67 positive cells (right) in DMSO/S-Gboxin treated tumors. For each group, 5 representative images from 2 different tumors were used. Mean ± SD; paired t test, two-tailed. l. Intracranial S-Gboxin treatment reduces Nestin expression in tumors but not in adjacent normal SVZ. Representative immunofluorescence staining for Nestin and Dapi staining for intracranial tumors from i. n = 2. m. Immunohistochemical staining for Ki67 and glioma markers (GFAP and Olig2) for intracranial PDX tumors shown in Figure 7 (e and g) indicates reduced proliferation and expression of glioma markers in S-Gboxin treated brains. Upper panel, For Tumor 1, PDX-170620; and bottom panel, for Tumor 2, PDX-170404; Scale bar = 25 μm. n =2. n. Mice treated with S-Gboxin at 10 mg/kg/day for a 32-day period do not exhibit weight variation as compared with vehicle treated mice. Vehicle (n=20); S-Gboxin (n=20); two-way ANOVA.
Extended Data Figure 9.
Extended Data Figure 9.. Primary explants from residual S-Gboxin treated tumors retain Gboxin/S-Gboxin sensitivity in culture.
a, b. Cell viability assays show primary tumor cultures from Vehicle (a) or S-Gboxin (b) treated tumors as in Figure 7a. Mean ± SD; n = 3. Residual S-Gboxin treated tumor cells remain sensitive to Gboxin/S-Gboxin and have blunted mPTP response.
Extended Data Figure 10.
Extended Data Figure 10.. Model for Gboxin mediated OxPhos inhibition in GBM cells.
Upper panel: High GBM cell mitochondrial matrix pH and inner mitochondrial membrane (IMM) potential leads to accumulation of positively charged Gboxin that is persistent due to blunted mPTP activity. At high concentration, Gboxin associates with multiple OxPhos proteins and inhibits CV activity causing cell death. Lower panel: In wildtype Gboxin resistant cells, mPTP function stabilizes mitochondrial membrane potential, maintains lower pH limiting mitochondrial Gboxin accumulation, thus limiting OxPhos inhibition and sustaining cell survival. mPTP (Green cylinder) is depicted adjacent to F0F1 ATPase CV. The precise nature and contribution of CV to mPTP remains controversial.
Figure 1.
Figure 1.. Gboxin, a benzimidazolium compound kills primary GBM (HTS) cells but not MEFs or astrocytes.
a. Gboxin structure. b. Cell viability assays (% Cell viability) for HTS, MEF and astrocyte cells exposed to increasing doses of Gboxin (96 hours. Mean ± SD; n=3). c. HTS specific upregulation of ATF4 and suppression of phospho-S6 (p-S6) by western blot analyses (DMSO or Gboxin; 1 μM; 6 hours ). n=3.
Figure 2.
Figure 2.. Gboxin inhibits cellular oxygen consumption.
a. Seahorse analyzer assays show HTS (left) and MEF (right) cells undergo acute oxygen consumption (OCR) inhibition. Gboxin (24 min.) at 4 doses (represented by 4 colored lines), Fccp (84 min.); and mixture of rotenone and antimycin A (rot/AA, 112 min.). Mean ± SD; n=3. b. Western blot analyses indicate ATF4 induction in MEFs treated with oligomycin A (oligo, 1 μM), rotenone (rot, 1 μM) or antimycin A (AA, 1 μM) for 6 hours, but not when treated with Gboxin (1 μM). n=3. c. Western blot analyses indicating Gboxin (1 μM) mediated activation of phospho-AMPK (pAMPK) and phospho-ACC-79 (pACC-79) in HTS cells but not MEFs treated for the indicated time periods. n=2.
Figure 3.
Figure 3.. B-Gboxin interacts with GBM OxPhos proteins.
a. SDS gel protein silver stain from B-Gboxin pull down assay using live HTS cells treated with: Gboxin, B-Gboxin, or Gboxin followed by B-Gboxin, demonstrates Gboxin specific interactions. Red arrowheads highlight reduced or absent protein bands following Gboxin pretreatment. n=4. b. Biotin pulldown followed by western blot with specific antibodies for Ndufv2, Sdha, Cox4, and Atp5b validate OxPhos protein interaction with Gboxin moiety of B-Gboxin. HTS cells treated with Gboxin, B-Gboxin, or Gboxin followed by B-Gboxin. n=3. c. Reduced MEF and astrocyte OxPhos protein association with B-Gboxin. n=3.
Figure 4.
Figure 4.. Gboxin mirrors oligomycin activity and resistance requires functional mPTP.
a. Acute increase of mitochondrial inner membrane potential (relative TRME signal analyzed by flow cytometry) shows similarity between Gboxin and oligomycin A (oligo, CV inhibitor) contrasted with acute membrane depolarization by inhibitors of other complexes. HTS cells treated with DMSO, Fccp (ionophore), rotenone (rot, CI inhibitor), antimycin A (AA, CIII inhibitor), oligomycin A or Gboxin for 10 minutes. Mean ± SD; n=3 for Fccp and rotenone, and n=4 for the rest. Note: CI and CIII inhibitors cause acute reduction of mitochondrial membrane potential. b. H2O2 reduces basal membrane potential in MEFs but not HTS cells. Cyclosporin A (CsA) mPTP inhibition enhances MEF membrane potential and renders them insensitive to ROS (H2O2). HTS cells exhibit higher basal membrane potential and are unresponsive to ROS and CsA. Mean ± SD; n=4. c. CsA sensitizes MEF toxicity to Gboxin > ten-fold. Mean ± SD; n=3. d. MEF mPTP inhibition by CsA elicits B-Gboxin association with OxPhos proteins. Western blots for OxPhos proteins from B-Gboxin pulldown assay using HTS and MEF cells treated with Gboxin or B-Gboxin in CsA presence or absence. PD: pulldown. n=3. e. Minimal C-Gboxin accumulation in MEF mitochondria. n=3. f. CsA induces rapid and sustained mitochondrial accumulation of C-Gboxin comparable in MEFs. n=3. C-Gboxin was probed with an Azide Fluor, and mitochondria were stained with CII Sdha antibody.
Figure 5.
Figure 5.. Gboxin toxicicity on primary human GBM cells and tumor cell lines.
a. Gboxin inhibition of three primary human GBM cell cultures harboring different mutational spectra (ts12017, ts1156 and ts603; see Methods for details) treated with increasing doses of oligomycin A or Gboxin in the presence/absence of CsA (1 μM). n=3. Mean ± SD. b. Gboxin toxicity in multiple human cancer cell lines compared to resistant primary MEFs and astrocytes. All cells tested with the exception of Daoy cells demonstrate a therapeutic index. Mean ± SD; n=3. c-e. Top panels (Mean ± SD): Cell viability assays for Gboxin sensitive U937 & NCI-H82 (c,d), and resistant Daoy (e; IC50: 8,256 nM) human cancer cells treated with increasing doses of oligomycin A or Gboxin in the presence/absence of CsA (1 μM). Daoy cells acquire sensitivity in the presence of CsA (IC50: 1,867 nM). Bottom panels: Western blot images for OxPhos proteins from pull down assays using cells treated with B-Gboxin in the presence/absence of CsA (1 μM). Resistant Daoy cells acquire enhanced OxPhos protein interaction with B-Gboxin only in the presence of CsA. n=3.
Figure 6.
Figure 6.. S-Gboxin inhibits GBM growth in vivo.
a-d, 105 HTS cells injected subcutaneously treated daily with vehicle/S-Gboxin (intraperitoneally; IP) commencing 3 days after allograft. a. Graph indicates tumor growth by volume (WxLxH) assessed every 2 days. Inset image of representative tumors. Vehicle: n=6, S-Gboxin: n=9; Mean ± SD; two-way ANOVA. b. H&E and immunohistochemical staining indicate reduced cellularity, proliferation, and glioma marker expression (Gfap and Olig2) in S-Gboxin treated tumors. n=2. c. Quantification of tumor cellular density (left) and Ki67 positive cells (right) in DMSO/S-Gboxin treated mouse flank tumors. For each group, 5 representative images from 2 tumors/group were used. Mean ± SD; paired t test, two-tailed. d. Kaplan-Meier survival analysis of mice indicating death when tumor volume > 300 mm3. Vehicle: n=7, S-Gboxin n=8; log-rank (Mantel-Cox) test. e-f. Intracranial transplantation of two independent primary passage patient derived GBM tumors (PDX-170620 and PDX-170404) treated via minipumps with vehicle or S-Gboxin. Vehicle: PDX-170620 (n=1) and PDX-170404 (n=1); S-Gboxin: PDX-170620 (n=1) and PDX-170404 (n=2). Dissected brains (left in e and f) and H&E staining (right in e and f) indicating reduced cellularity. Dotted red lines trace the main tumor area. See also Extended data Fig. 8m. Scale bar = 50 μm; Hpf-high power field.

Comment in

Similar articles

Cited by

References

    1. Stupp R et al. Radiotherapy plus concomitant and adjuvant temozolomide for glioblastoma. N Engl J Med 352, 987–996, doi:10.1056/NEJMoa043330 (2005). - DOI - PubMed
    1. Wen PY & Kesari S Malignant gliomas in adults. N Engl J Med 359, 492–507, doi:10.1056/NEJMra0708126 (2008). - DOI - PubMed
    1. Chen J et al. A restricted cell population propagates glioblastoma growth after chemotherapy. Nature 488, 522–526, doi:10.1038/nature11287 (2012). - DOI - PMC - PubMed
    1. Viale A & Draetta GF Metabolic Features of Cancer Treatment Resistance. Recent Results Cancer Res 207, 135–156, doi:10.1007/978-3-319-42118-6_6 (2016). - DOI - PubMed
    1. Viale A et al. Oncogene ablation-resistant pancreatic cancer cells depend on mitochondrial function. Nature 514, 628–632, doi:10.1038/nature13611 (2014). - DOI - PMC - PubMed

MeSH terms

Substances

LinkOut - more resources