

Gut mucosal virome alterations in ulcerative colitis
- PMID: 30842211
- PMCID: PMC6582748
- DOI: 10.1136/gutjnl-2018-318131
Gut mucosal virome alterations in ulcerative colitis
Abstract
Objective: The pathogenesis of UC relates to gut microbiota dysbiosis. We postulate that alterations in the viral community populating the intestinal mucosa play an important role in UC pathogenesis. This study aims to characterise the mucosal virome and their functions in health and UC.
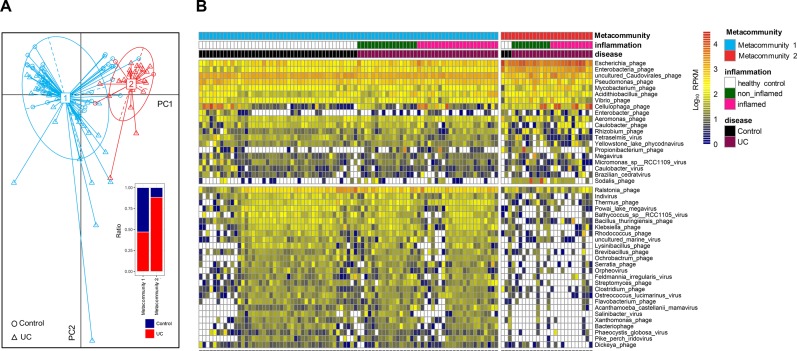
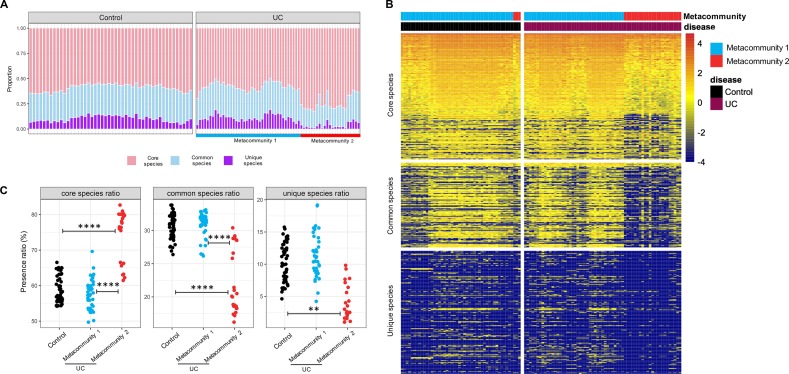
Design: Deep metagenomics sequencing of virus-like particle preparations and bacterial 16S rRNA sequencing were performed on the rectal mucosa of 167 subjects from three different geographical regions in China (UC=91; healthy controls=76). Virome and bacteriome alterations in UC mucosa were assessed and correlated with patient metadata. We applied partition around medoids clustering algorithm and classified mucosa viral communities into two clusters, referred to as mucosal virome metacommunities 1 and 2.
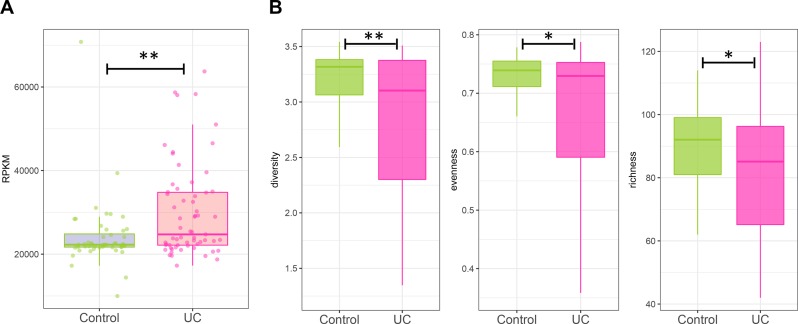
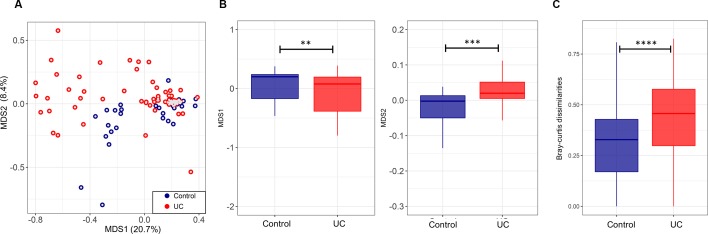
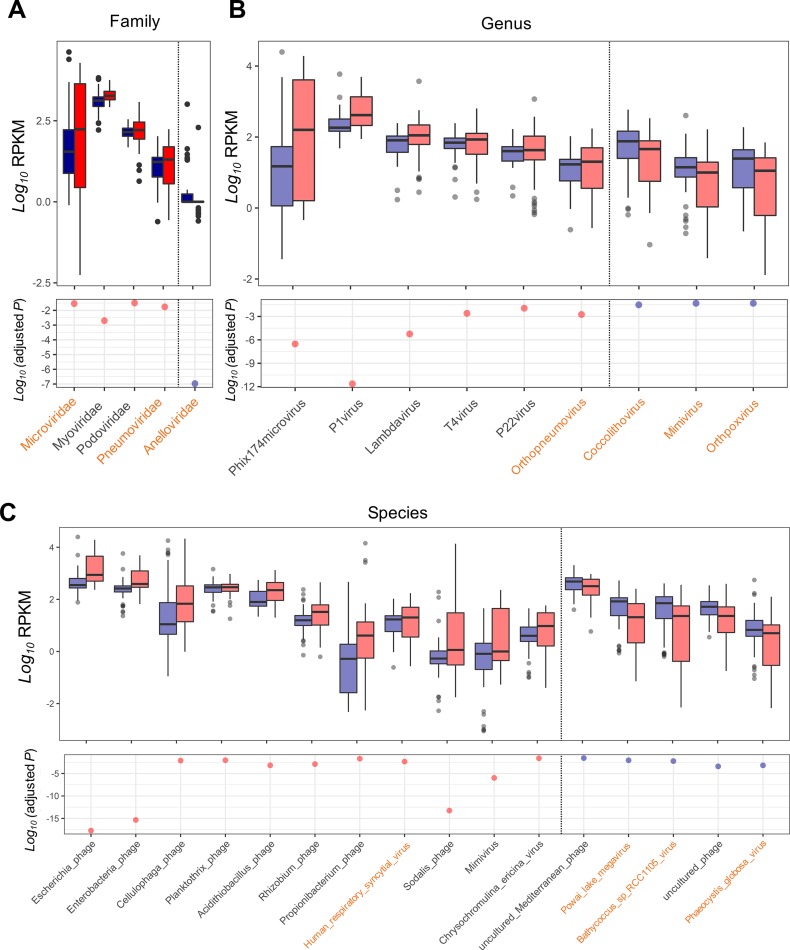
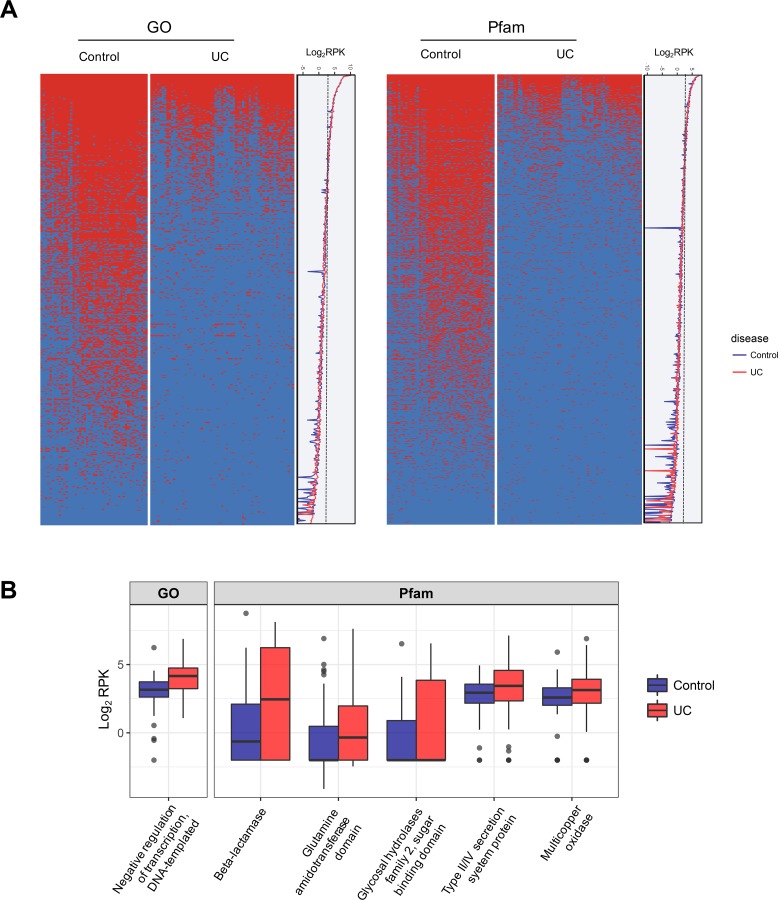
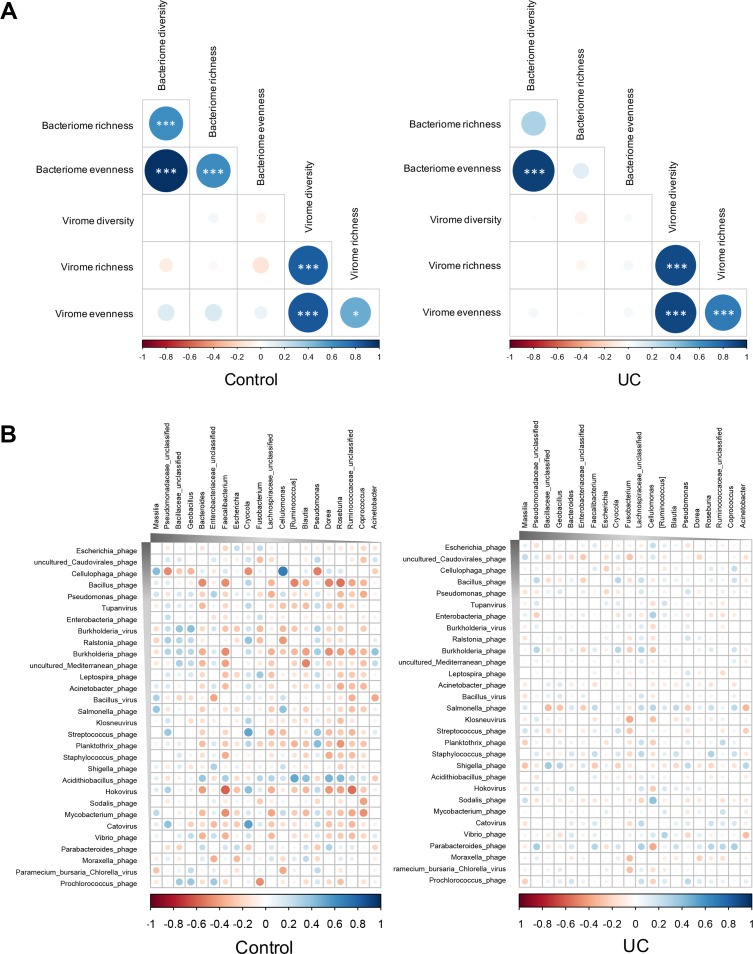
Results: In UC, there was an expansion of mucosa viruses, particularly Caudovirales bacteriophages, and a decrease in mucosa Caudovirales diversity, richness and evenness compared with healthy controls. Altered mucosal virome correlated with intestinal inflammation. Interindividual dissimilarity between mucosal viromes was higher in UC than controls. Escherichia phage and Enterobacteria phage were more abundant in the mucosa of UC than controls. Compared with metacommunity 1, metacommunity 2 was predominated by UC subjects and displayed a significant loss of various viral species. Patients with UC showed substantial abrogation of diverse viral functions, whereas multiple viral functions, particularly functions of bacteriophages associated with host bacteria fitness and pathogenicity, were markedly enriched in UC mucosa. Intensive transkingdom correlations between mucosa viruses and bacteria were significantly depleted in UC.
Conclusion: We demonstrated for the first time that UC is characterised by substantial alterations of the mucosa virobiota with functional distortion. Enrichment of Caudovirales bacteriophages, increased phage/bacteria virulence functions and loss of viral-bacterial correlations in the UC mucosa highlight that mucosal virome may play an important role in UC pathogenesis.
Keywords: bacteria; gut mucosa; ulcerative colitis; virome; virome metacommunity.
© Author(s) (or their employer(s)) 2019. Re-use permitted under CC BY-NC. No commercial re-use. See rights and permissions. Published by BMJ.
Conflict of interest statement
Competing interests: None declared.
Figures
Comment in
-
Gut mucosal virome altered in ulcerative colitis.Nat Rev Gastroenterol Hepatol. 2019 May;16(5):262. doi: 10.1038/s41575-019-0141-y. Nat Rev Gastroenterol Hepatol. 2019. PMID: 30926942 No abstract available.
-
Giant oversights in the human gut virome.Gut. 2020 Jul;69(7):1357-1358. doi: 10.1136/gutjnl-2019-319067. Epub 2019 Jun 11. Gut. 2020. PMID: 31186296 No abstract available.
-
Authors response: giant oversights in the human gut virome.Gut. 2020 Jul;69(7):1358. doi: 10.1136/gutjnl-2019-319357. Epub 2019 Jul 11. Gut. 2020. PMID: 31300514 No abstract available.
Similar articles
-
Disease-specific alterations in the enteric virome in inflammatory bowel disease.Cell. 2015 Jan 29;160(3):447-60. doi: 10.1016/j.cell.2015.01.002. Epub 2015 Jan 22. Cell. 2015. PMID: 25619688 Free PMC article.
-
Enteric Virome and Bacterial Microbiota in Children With Ulcerative Colitis and Crohn Disease.J Pediatr Gastroenterol Nutr. 2019 Jan;68(1):30-36. doi: 10.1097/MPG.0000000000002140. J Pediatr Gastroenterol Nutr. 2019. PMID: 30169455 Free PMC article.
-
Metagenomic analysis of intestinal mucosa revealed a specific eukaryotic gut virome signature in early-diagnosed inflammatory bowel disease.Gut Microbes. 2019;10(2):149-158. doi: 10.1080/19490976.2018.1511664. Epub 2018 Sep 25. Gut Microbes. 2019. PMID: 30252582 Free PMC article.
-
Crosstalk between the Intestinal Virome and Other Components of the Microbiota, and Its Effect on Intestinal Mucosal Response and Diseases.J Immunol Res. 2022 Sep 27;2022:7883945. doi: 10.1155/2022/7883945. eCollection 2022. J Immunol Res. 2022. PMID: 36203793 Free PMC article. Review.
-
Cross Talk between Gut Microbiota and Intestinal Mucosal Immunity in the Development of Ulcerative Colitis.Infect Immun. 2021 Aug 16;89(9):e0001421. doi: 10.1128/IAI.00014-21. Epub 2021 Aug 16. Infect Immun. 2021. PMID: 33526559 Free PMC article. Review.
Cited by
-
Gut Microbiota Resilience: Definition, Link to Health and Strategies for Intervention.Front Microbiol. 2020 Sep 15;11:572921. doi: 10.3389/fmicb.2020.572921. eCollection 2020. Front Microbiol. 2020. PMID: 33042082 Free PMC article. Review.
-
Spinal Cord Injury Changes the Structure and Functional Potential of Gut Bacterial and Viral Communities.mSystems. 2021 May 11;6(3):e01356-20. doi: 10.1128/mSystems.01356-20. mSystems. 2021. PMID: 33975974 Free PMC article.
-
Temporal landscape of human gut RNA and DNA virome in SARS-CoV-2 infection and severity.Microbiome. 2021 Apr 14;9(1):91. doi: 10.1186/s40168-021-01008-x. Microbiome. 2021. PMID: 33853691 Free PMC article.
-
Exploring Mucin as Adjunct to Phage Therapy.Microorganisms. 2021 Feb 28;9(3):509. doi: 10.3390/microorganisms9030509. Microorganisms. 2021. PMID: 33670927 Free PMC article. Review.
-
The role of gut microbiome in inflammatory bowel disease diagnosis and prognosis.United European Gastroenterol J. 2022 Dec;10(10):1091-1102. doi: 10.1002/ueg2.12338. Epub 2022 Dec 3. United European Gastroenterol J. 2022. PMID: 36461896 Free PMC article. Review.
References
Publication types
MeSH terms
LinkOut - more resources
Full Text Sources
Other Literature Sources
Medical