Licochalcone A Inhibits Cellular Motility by Suppressing E-cadherin and MAPK Signaling in Breast Cancer
- PMID: 30841634
- PMCID: PMC6468539
- DOI: 10.3390/cells8030218
Licochalcone A Inhibits Cellular Motility by Suppressing E-cadherin and MAPK Signaling in Breast Cancer
Abstract
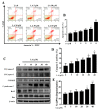
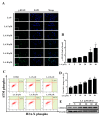
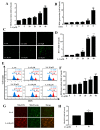
A compound isolated from Glycyrrhizauralensis, licochalcone A (LA) exhibits anti-inflammatory and anti-tumor properties in various cell lines. LA has been found to promote autophagy and suppress specificity protein 1, inducing apoptosis in breast cancer cells. However, the regulation of breast cancer cell invasion and migration by LA is elusive. Thus, the present study investigated whether LA induces apoptosis and cellular motility in MDA-MB-231 breast cells, and investigated the underlying molecular mechanisms. MDA-MB-231 cells treated with LA and cell viability measured by cell counting kit-8 assay. Apoptotic signal proteins checked by flow cytometry, fluorescent staining, and Western blot. LA effectively suppressed cell migration, and modulated E-cadherin and vimentin expression by blocking MAPK and AKT signaling. LA inhibited cell proliferation and cell cycle, modulated mitochondrial membrane potential and DNA damage, and reduced oxidative stress in MDA-MB-231 cells. LA also activated cleaved-caspase 3 and 9, significantly decreased Bcl-2 expression, ultimately causing the release of cytochrome c from the mitochondria into the cytoplasm. Overall, our findings suggest that LA decreases cell proliferation and increases reactive oxygen species production for induced apoptosis, and regulates E-cadherin and vimentin by reducing MAPK and AKT signaling, resulting in suppressed MDA-MB-231 cell migration and invasion.
Keywords: MDA-MB-231 cells; apoptosis; caspase-3; cellular motility; licochalcone A.
Conflict of interest statement
The authors have no conflicts of interest to declare.
Figures


Similar articles
-
Sophoraflavanone G from Sophora flavescens induces apoptosis in triple-negative breast cancer cells.Phytomedicine. 2019 Aug;61:152852. doi: 10.1016/j.phymed.2019.152852. Epub 2019 Jan 29. Phytomedicine. 2019. PMID: 31035052
-
The investigational Aurora kinase A inhibitor alisertib (MLN8237) induces cell cycle G2/M arrest, apoptosis, and autophagy via p38 MAPK and Akt/mTOR signaling pathways in human breast cancer cells.Drug Des Devel Ther. 2015 Mar 16;9:1627-52. doi: 10.2147/DDDT.S75378. eCollection 2015. Drug Des Devel Ther. 2015. PMID: 25834401 Free PMC article.
-
ERK-modulated intrinsic signaling and G(2)/M phase arrest contribute to the induction of apoptotic death by allyl isothiocyanate in MDA-MB-468 human breast adenocarcinoma cells.Int J Oncol. 2012 Dec;41(6):2065-72. doi: 10.3892/ijo.2012.1640. Epub 2012 Sep 24. Int J Oncol. 2012. PMID: 23008020
-
Role of Licochalcone A in Potential Pharmacological Therapy: A Review.Front Pharmacol. 2022 May 23;13:878776. doi: 10.3389/fphar.2022.878776. eCollection 2022. Front Pharmacol. 2022. PMID: 35677438 Free PMC article. Review.
-
Therapeutic potential and action mechanisms of licochalcone B: a mini review.Front Mol Biosci. 2024 Jul 3;11:1440132. doi: 10.3389/fmolb.2024.1440132. eCollection 2024. Front Mol Biosci. 2024. PMID: 39021879 Free PMC article. Review.
Cited by
-
Licochalcone A Inhibits Proliferation and Metastasis of Colon Cancer by Regulating miR-1270/ADAM9/Akt/NF-κB axis.Iran J Public Health. 2023 Sep;52(9):1962-1972. doi: 10.18502/ijph.v52i9.13578. Iran J Public Health. 2023. PMID: 38033851 Free PMC article.
-
Programmed Cell Death Alterations Mediated by Synthetic Indole Chalcone Resulted in Cell Cycle Arrest, DNA Damage, Apoptosis and Signaling Pathway Modulations in Breast Cancer Model.Pharmaceutics. 2022 Feb 24;14(3):503. doi: 10.3390/pharmaceutics14030503. Pharmaceutics. 2022. PMID: 35335879 Free PMC article.
-
Immune Effect of Active Components of Traditional Chinese Medicine on Triple-Negative Breast Cancer.Front Pharmacol. 2021 Dec 3;12:731741. doi: 10.3389/fphar.2021.731741. eCollection 2021. Front Pharmacol. 2021. PMID: 34925002 Free PMC article. Review.
-
Anticancer Potential of Natural Chalcones: In Vitro and In Vivo Evidence.Int J Mol Sci. 2023 Jun 19;24(12):10354. doi: 10.3390/ijms241210354. Int J Mol Sci. 2023. PMID: 37373500 Free PMC article. Review.
-
Licochalcone A: a review of its pharmacology activities and molecular mechanisms.Front Pharmacol. 2024 Aug 12;15:1453426. doi: 10.3389/fphar.2024.1453426. eCollection 2024. Front Pharmacol. 2024. PMID: 39188947 Free PMC article. Review.
References
-
- Oeffinger K.C., Fontham E.T., Etzioni R., Herzig A., Michaelson J.S., Shih Y.C., Walter L.C., Church T.R., Flowers C.R., LaMonte S.J., et al. Breast cancer screening for women at average risk: 2015 guideline update from the american cancer society. JAMA. 2015;314:1599–1614. doi: 10.1001/jama.2015.12783. - DOI - PMC - PubMed
Publication types
MeSH terms
Substances
LinkOut - more resources
Full Text Sources
Medical
Research Materials
Miscellaneous

