

Fusobacterium nucleatum promotes colorectal cancer by inducing Wnt/β-catenin modulator Annexin A1
- PMID: 30833345
- PMCID: PMC6446206
- DOI: 10.15252/embr.201847638
Fusobacterium nucleatum promotes colorectal cancer by inducing Wnt/β-catenin modulator Annexin A1
Abstract
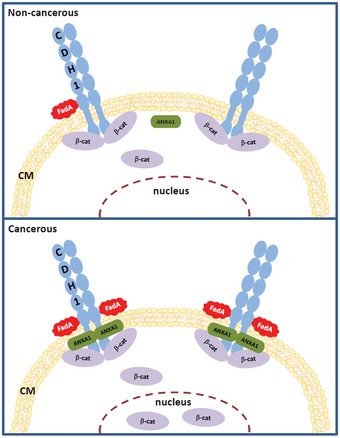
Fusobacterium nucleatum, a Gram-negative oral anaerobe, is a significant contributor to colorectal cancer. Using an in vitro cancer progression model, we discover that F. nucleatum stimulates the growth of colorectal cancer cells without affecting the pre-cancerous adenoma cells. Annexin A1, a previously unrecognized modulator of Wnt/β-catenin signaling, is a key component through which F. nucleatum exerts its stimulatory effect. Annexin A1 is specifically expressed in proliferating colorectal cancer cells and involved in activation of Cyclin D1. Its expression level in colon cancer is a predictor of poor prognosis independent of cancer stage, grade, age, and sex. The FadA adhesin from F. nucleatum up-regulates Annexin A1 expression through E-cadherin. A positive feedback loop between FadA and Annexin A1 is identified in the cancerous cells, absent in the non-cancerous cells. We therefore propose a "two-hit" model in colorectal carcinogenesis, with somatic mutation(s) serving as the first hit, and F. nucleatum as the second hit exacerbating cancer progression after benign cells become cancerous. This model extends the "adenoma-carcinoma" model and identifies microbes such as F. nucleatum as cancer "facilitators".
Keywords: Fusobacterium nucleatum; Annexin A1; FadA; colorectal cancer; two‐hit model.
© 2019 The Authors.
Conflict of interest statement
P.D. receives royalties and/or stocks from OncoMed Pharmaceuticals, Inc., Quanticel Pharmaceuticals, Inc. (now a fully owned subsidiary of Celgene), and Forty Seven, Inc. as a co‐inventor of several patents and patent applications.
Figures
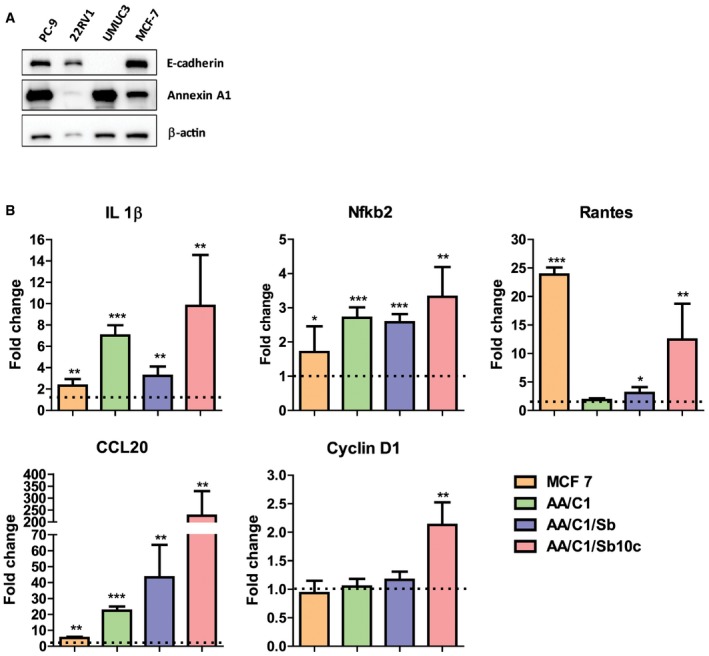
Western blot analysis of E‐cadherin and Annexin A1 expression in lung cancer cells PC‐9, prostate cancer cells 22RV1, bladder cancer cells UMUC3, and breast cancer cells MCF‐7. β‐Actin was included as an internal control.
Real‐time qPCR analysis of Il‐1β, Nfkb2, Rantes, CCL20, and CCND1 mRNA in MCF‐7, AA/C1, AA/C1/SB (aka SB), and AA/C1/SB/10C (aka 10C) either untreated or following incubation with wild‐type F. nucleatum 12230. Results obtained from untreated controls were designated as 1. Data were mean values ± SD. The experiment was performed in duplicates and repeated twice. *P < 0.05, **P < 0.01, and ***P < 0.001 (Student's t‐test).
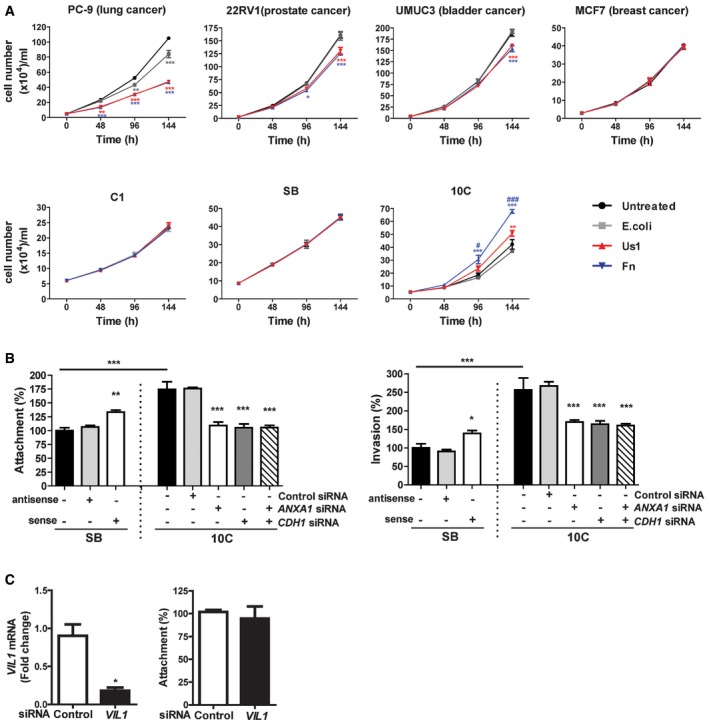
Lung cancer cells PC‐9, prostate cancer cells 22RV1, bladder cancer cells UMUC3, breast cancer cells MCF‐7, colonic adenoma‐derived non‐cancerous cells AA/C1 (aka C1) and AA/C1/SB (aka SB), or cancerous cells AA/C1/SB/10C (aka 10C) were incubated with wild‐type F. nucleatum 12230 (Fn), the fadA‐deletion mutant US1 (US1), or E. coli DH5α (E. coli) at multiplicity of infection (MOI) of 1,000:1. Cell numbers are mean values ± SEM. The experiment was performed in triplicates and repeated three times. *P < 0.05, **P < 0.01, ***P < 0.001, compared to untreated controls; # P < 0.05, ### P < 0.001, compared to US1‐treated cells (two‐way ANOVA).
Attachment (left panel) and invasion (right panel) of wild‐type F. nucleatum 12230 (Fn) to the non‐cancerous SB cells, either untreated or transfected with antisense or sense ANXA1, and to the cancerous 10C cells, either untreated or transfected with control or ANXA1‐ or CDH1‐specific siRNA or both (MOI 50:1). F. nucleatum attachment and invasion to the untreated SB cells were designated as 100%, respectively; all other values were expressed as relative to those obtained with untreated SB. Data are mean values ± SEM. The experiment was performed in triplicates and repeated four times. *P < 0.05, **P < 0.01, and ***P < 0.001 (one‐way ANOVA).
Left panel: qPCR analysis of Villin 1 (VIL1) mRNA levels in 10C cells treated with control siRNA or VIL1‐specific siRNA, demonstrating knockdown of Villin 1. Right panel: Attachment of F. nucleatum 12230 to 10C cells treated with control siRNA or VIL1‐specific siRNA. Data are mean values ± SD. The experiment was performed in triplicates and repeated twice. *P < 0.05 (Student's t‐test).
- A–C
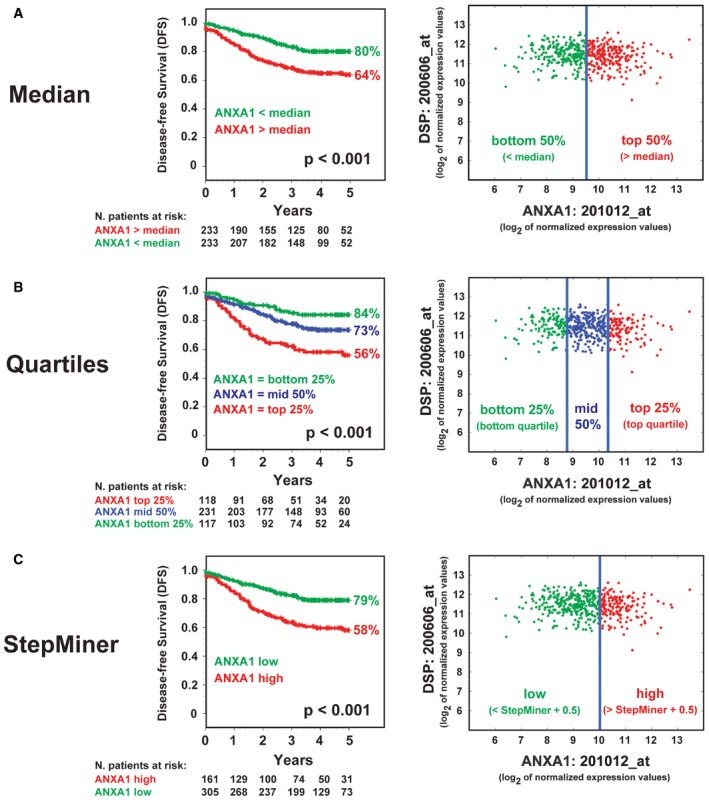
Relationship between ANXA1 mRNA expression levels and disease‐free survival (DFS) in colon cancer patients. The relationship between ANXA1 mRNA expression levels and DFS was investigated in a database of 466 primary colon carcinomas, assembled by pooling four independent gene‐expression array datasets from the NCBI‐GEO online repository (GSE14333, GSE17538, GSE31595, GSE37892), as previously described 34. The association between ANXA1 expression levels and DFS was tested using Kaplan–Meier survival curves, after patient stratification in groups with high, medium, and low ANXA1 expression, using three different methods: (A) based on the median of ANXA1 mRNA expression levels (high 50% versus low 50%); (B) based on the quartile distribution of ANXA1 mRNA expression levels (high 25% versus middle 50% versus low 25%); and (C) based on ANXA1 mRNA expression thresholds calculated using the StepMiner algorithm (low versus high), as previously described 35, 36. Overall, high ANXA1 mRNA expression levels were associated with a statistically significant reduction in DFS (P < 0.001, log‐rank test), irrespective of the method used for the stratification. Differences in ANXA1 mRNA expression levels did not appear to correlate with differences in each tumor's relative content of epithelial cells in the analyzed biospecimens (i.e., tumor cell density) as revealed by the lack of visual correlations with the epithelial cell marker Desmoplakin (DSP).
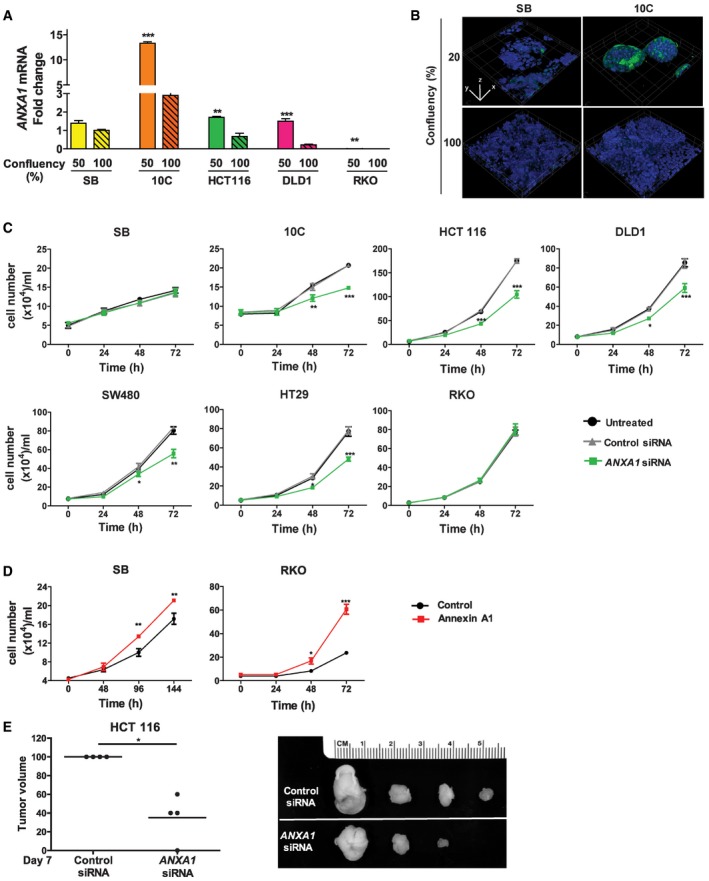
Real‐time qPCR analysis of ANXA1 expression using mRNA extracted from the non‐cancerous SB, cancerous 10C, and human CRC cell lines HCT116, DLD1, and RKO, each grown to 50 or 100% confluency. All results were normalized to the ANXA1 mRNA levels in SB cells of 100% confluency, which was designated as 1. Data are mean values ± SEM. The experiment was performed in triplicates and repeated twice. **P < 0.01 and ***P < 0.001 (Student's t‐test).
Confocal microscopy analysis of SB and 10C cells grown to 20% (top panels) or 100% (bottom panels) confluency followed by immunofluorescence staining of Annexin A1 (green). The nuclei were stained with DAPI (blue). A series of 20–50 consecutive images in the z‐axis were stacked together to generate the 3D figure at 400× magnification. Annexin A1 is most abundantly expressed on the outer layer of 20% confluent 10C (also see Movie EV1), compared to 100% confluent 10C, or SB of either confluency. Scale bars, x = 1 μm, y = 1 μm, z = 1.6 μm. The experiment was repeated at least twice.
Cell proliferation assay of adenoma‐derived non‐cancerous SB and cancerous 10C and human CRC cell lines HCT116, DLD1, SW480, HT29, and RKO either untreated (black lines) or following treatment with control siRNA (gray lines) or ANXA1‐specific siRNA (green lines). Data are mean values ± SEM. The experiment was performed in triplicates and repeated three times. *P < 0.05, **P < 0.01, and ***P < 0.001, compared to the untreated cells (two‐way ANOVA).
Cell proliferation assay of SB (left panel) and RKO (right panel) cells transfected with ANXA1 (red line), as compared to the control cells (black lines). Data are mean values ± SEM. The experiment was performed in triplicates and repeated three times. *P < 0.05, **P < 0.01, and ***P < 0.001 (two‐way ANOVA).
Xenografted tumor growth in nude mice following subcutaneous and bilateral inoculation of HCT116 cells transfected with control siRNA or ANXA1‐specific siRNA (n = 4). The tumor volumes were measured after 7 days postinjection (left panel). For each mouse, the tumor resulting from ANXA1‐specific siRNA‐treated cells was normalized to that from control siRNA‐treated cells, which was designated 100%. The line represents the average. *P < 0.05 (paired t‐test). The individual tumor pairs are shown on the right panel: top, tumors arising from control siRNA‐treated cells; bottom, tumors arising from ANXA1‐specific siRNA‐treated cells.
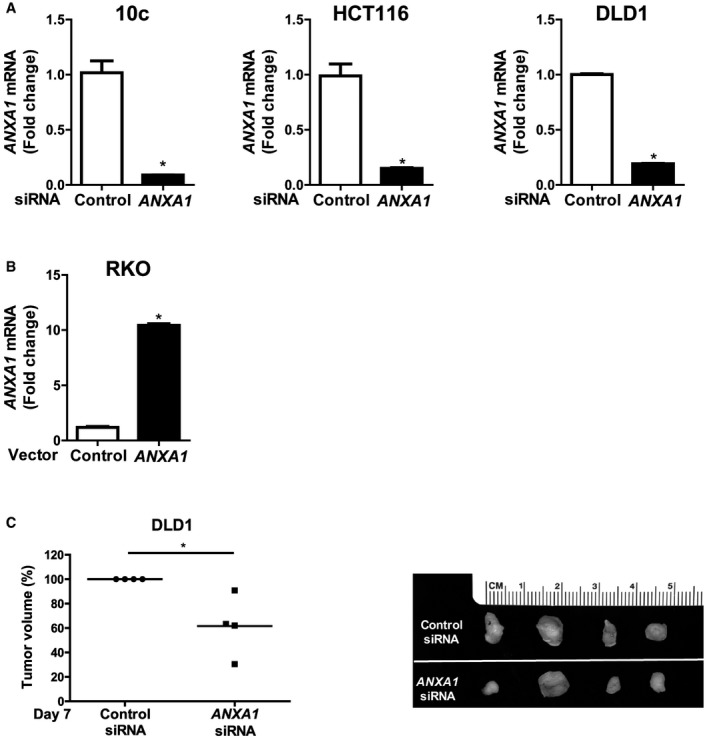
qPCR analysis of ANXA1 mRNA levels in 10C, HCT116, DLD1 cells transfected with control siRNA or ANXA1‐specific siRNA, demonstrating knockdown of ANXA1. The experiment was performed in triplicates. Data are mean values ± SEM. *P < 0.05 (Student's t‐test).
qPCR analysis of ANXA1 mRNA levels in RKO cells transfected with control vector or ANXA1, demonstrating knock‐in of ANXA1. The experiment was performed in triplicates. Data are mean values ± SEM. *P < 0.05 (Student's t‐test).
Xenografted tumor growth in nude mice following subcutaneous and bilateral inoculation of DLD1 cells transfected with control siRNA or ANXA1‐specific siRNA (n = 4). The tumor volumes were measured after 8 days postinjection (left panel). For each mouse, the tumor resulting from ANXA1‐specific siRNA‐treated cells was normalized to that from control siRNA‐treated cells, which was designated as 100%. The line represents the average. *P < 0.05 (paired t‐test). The individual tumor pairs are shown on the right panel: top, tumors arising from control siRNA treated cells; bottom, tumors arising from ANXA1‐specific siRNA‐treated cells.
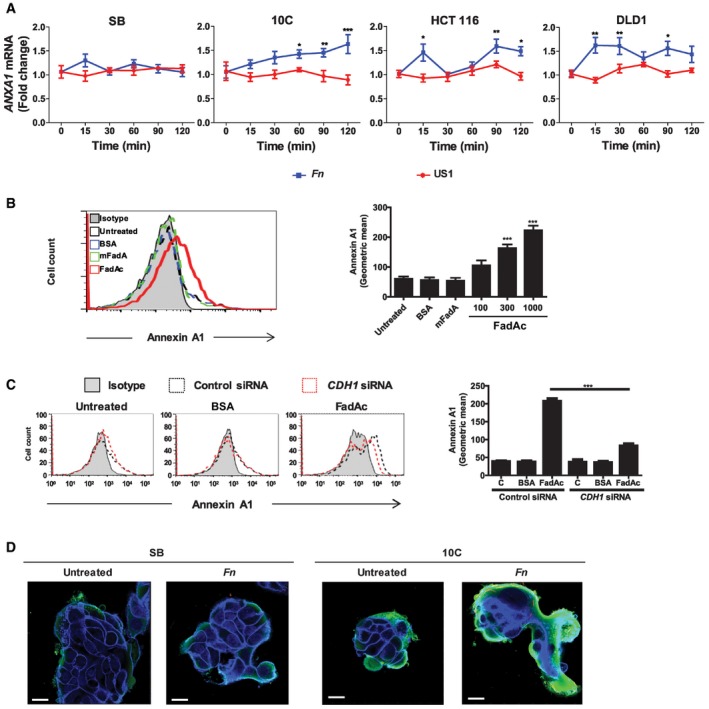
Real‐time qPCR analysis of ANXA1 mRNA levels in SB, 10C, HCT116, and DLD1 cells incubated with wild‐type F. nucleatum 12230 (Fn) or fadA‐deletion mutant US1 (US1) at MOI of 50:1 for the indicated time periods. The results were normalized to those obtained with untreated cells and were the mean of three independent experiments each performed in triplicates. Data are mean values ± SEM. *P < 0.05, **P < 0.01, and ***P < 0.001 (two‐way ANOVA).
Flow cytometry analysis of Annexin A1 expression in 10C cells either untreated, or incubated with BSA (1,000 μg/ml), or mFadA (1,000 μg/ml), or FadAc (100, 300, or 1,000 μg/ml) for 1 h. Data are mean values ± SD. The experiment was performed in triplicates and repeated more than three times. ***P < 0.001 (one‐way ANOVA).
Flow cytometry analysis of Annexin A1 in 10C cells transfected with control siRNA (dotted black line) or CDH1‐specific siRNA (dotted red line) followed by no treatment (untreated), or incubation with BSA (1,000 μg/ml) or FadAc (1,000 μg/ml) for 1 h. Data are mean values ± SD. The experiment was performed in triplicates and repeated twice. ***P < 0.001 (two‐way ANOVA).
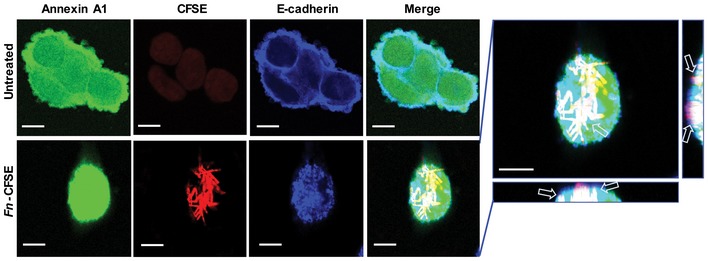
Confocal microscopy analysis of SB and 10C cells either untreated or following incubation with CFSE‐labeled F. nucleatum 12230 (Fn) for 1 h at MOI of 5:1. Annexin A1 was stained green and E‐cadherin blue. Imagines are 800× magnification. Note the enhanced expression of Annexin A1 in 10C compared to SB and its location on the outer layer of the cell mass. The experiment was repeated three times. Scale bar, 250 nm.
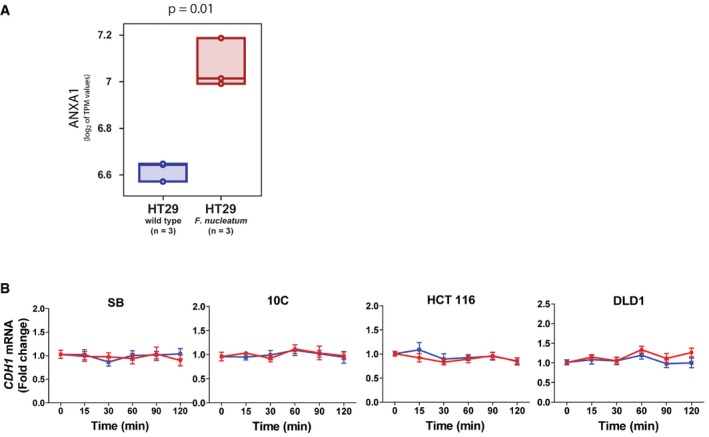
Statistical analysis of associations between exposure to F. nucleatum and up‐regulation of ANXA1 mRNA expression levels in colon cancer cell HT29. The ANXA1 mRNA levels in HT29 cells were analyzed in an RNA‐sequencing (RNA‐seq) dataset publicly available from the NCBI‐GEO online repository (GSE90944) and containing global gene‐expression measurements from HT29 cells, both at baseline and following incubation with F. nucleatum ATCC25586 in triplicates 14. The distribution of ANXA1 mRNA expression levels in the two sample groups (baseline versus infected) was visualized using boxplots, using the log2 of their TPM (transcripts per million) expression values as a metric. Individual data points were represented as circles, and box‐plots were drawn to span the inter‐quartile range (from the 25th to the 75th percentile) with an internal band to identify the median. Differences in mean log2 TPM values between HT29 cells at baseline (n = 3) and following incubation with F. nucleatum (n = 3) were tested for statistical significance using a two‐tailed t‐test for continuous variables. The analysis revealed that HT29 cells exposed to F. nucleatum were characterized by increased levels of ANXA1 mRNA expression, as compared to HT29 cells at baseline (P = 0.01).
Real‐time qPCR analysis of E‐cadherin (CDH1) mRNA levels in SB, 10C, HCT116, and DLD1 cells following incubation with F. nucleatum 12230 (Fn) and fadA‐deletion mutant US1 (US1) for indicated time periods. All results were normalized to those of the untreated cells. Data are mean values ± SEM of three independent experiments each performed in triplicates.
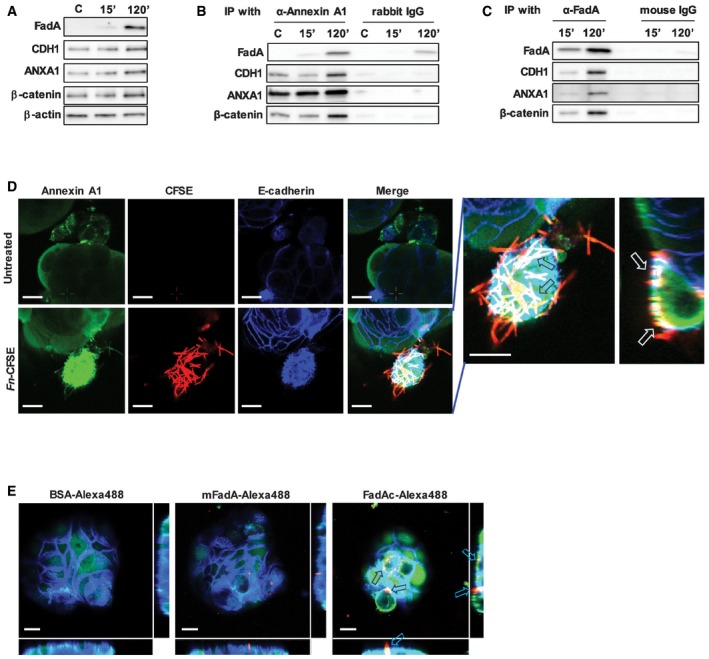
Western blot analysis of FadA, E‐cadherin (CDH1), Annexin A1 (ANXA1), and β‐catenin in DLD1 cells following incubation with FadAc for 15 or 120 min. C, untreated cells. β‐Actin was included as an internal control. The experiment was repeated three times.
Co‐immunoprecipitation with Annexin A1. DLD1 cell lysates were incubated with FadAc for 15 or 120 min and then mixed with agarose beads conjugated with rabbit anti‐Annexin A1 polyclonal antibody (α‐Annexin A1) or control rabbit IgG. FadA, E‐cadherin (CDH1), Annexin A1 (ANXA1), and β‐catenin in the eluates were detected by Western blot. C, untreated control. The experiment was repeated three times.
Co‐immunoprecipitation with FadA. DLD1 cell lysates were incubated with FadAc for 15 or 120 min and then mixed with agarose beads conjugated with mouse anti‐FadA monoclonal antibody (α‐FadA) or control mouse IgG. FadA, E‐cadherin (CDH1), Annexin A1 (ANXA1), and β‐catenin in the eluates were detected by Western blot. The experiment was repeated three times.
Confocal microscopy analysis of 10C cells either untreated (top panel) or following incubation with CFSE‐labeled F. nucleatum 12230 (red, bottom panel) for 3 h and then immunofluorescent‐stained for Annexin A1 (green) and E‐cadherin (blue). Images are 1,200× magnification. A side view of the enlarged image is shown on the far right. Note the enhanced expression of Annexin A1 in the F. nucleatum‐bound cells and the co‐localization of Annexin A1, E‐cadherin, and F. nucleatum on the cell membranes (arrows). The experiment was repeated more than three times. Scale bar, 500 nm.
Confocal microscopy analysis of 10C cells following incubation with Alexa Fluor™ 488‐conjugated BSA, mFadA, or FadAc (red) for 1 h followed by immunostaining of Annexin A1 (green) and E‐cadherin (blue). Images are 1,200× magnification. Note the enhanced expression of Annexin A1 and its co‐localization with E‐cadherin in the presence of FadAc (arrows), but not with BSA or mFadA. The experiment was repeated twice. The side views are shown to the right and bottom of each image. Scale bar, 500 nm.
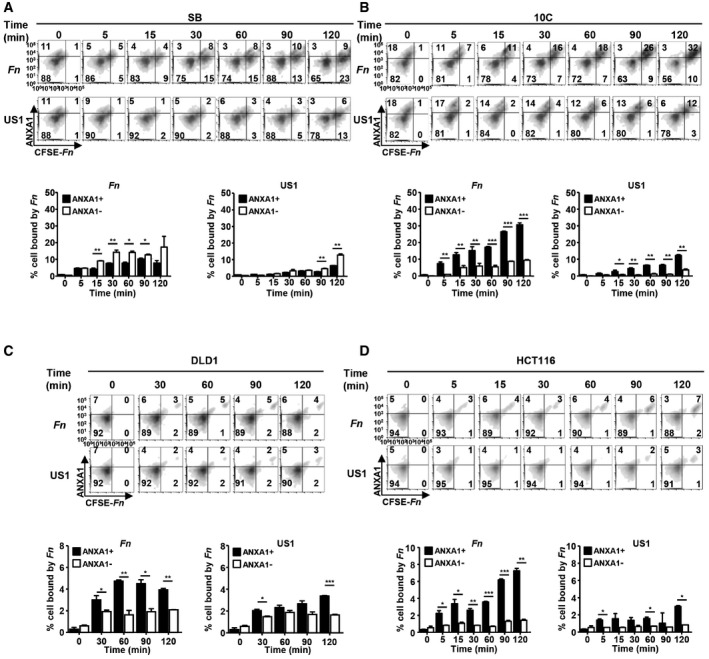
- A–D
Flow cytometry analysis of SB (A), 10C (B), DLD1 (C), and HCT116 (D) cells incubated with CFSE‐labeled F. nucleatum 12230 (Fn) or its fadA‐deletion mutant US1 (US1) at MOI of 10–20:1 for the indicated time and immunostained with anti‐Annexin A1 antibodies. Shown on the top panels are the density plots. x‐axis, CFSE‐labeled F. nucleatum or US1 (CFSE‐Fn); y‐axis, Annexin A1 (ANXA1). Shown on the bottom panels are the percentages of Annexin A1‐positive (solid bars) or negative (clear bars) cells bound by F. nucleatum or US1 out of the total number of cells analyzed. Data are mean values ± SD. The experiments were performed in triplicates and repeated 2–3 times. *P < 0.05, **P < 0.01, ***P < 0.001 (two‐way ANOVA).
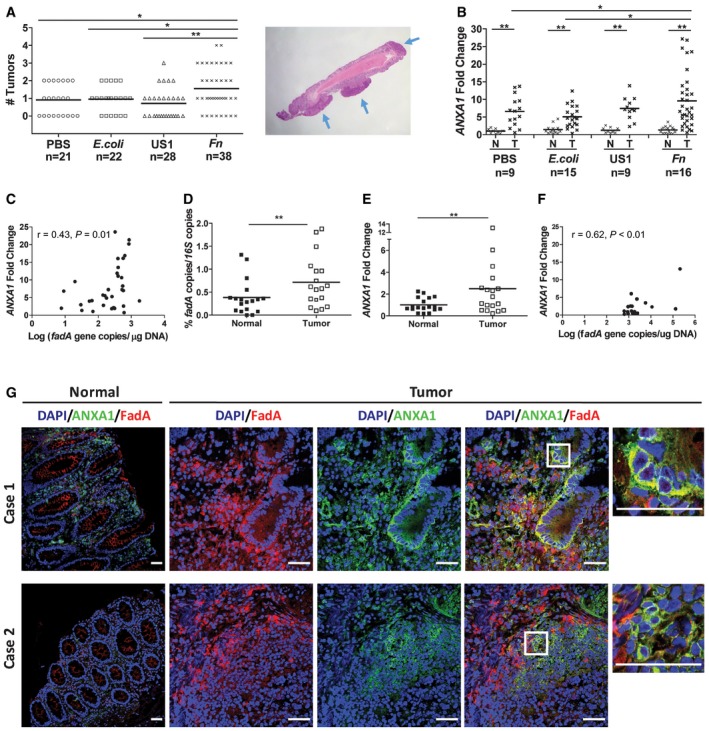
Colorectal tumors generated in Apc min/+ mice following treatment with PBS, E. coli DH5α (E. coli), fadA‐deletion mutant US1 (US1), or F. nucleatum 12230 (Fn). Each symbol represents one mouse. Horizontal lines represent mean values. Representative tumors formed in the mouse colon are shown on the right, pointed by blue arrows. *P < 0.05, **P < 0.01 (one‐way ANOVA).
ANXA1 mRNA levels in Apc min/+ mouse paired normal colonic and tumor tissues as measured by real‐time qPCR. Each symbol represents one mouse. Horizontal lines represent mean values. *P < 0.05, **P < 0.01) (two‐way ANOVA).
Positive correlation between fadA gene copy numbers (x‐axis) and ANXA1 mRNA levels (y‐axis) in F. nucleatum‐induced Apc min/+ mouse colonic tumors (n = 34; Pearson's correlation r = 0.43, P = 0.01). Each dot represents the average of qPCR results performed in duplicates.
Abundance of fadA in the paired normal and adenocarcinoma tissues from human CRC patients (n = 18) expressed as ratio of fadA over total 16S rRNA genes determined by qPCR. Each symbol shows the average of duplicate qPCR results from one patient. Horizontal lines represent mean values. **P < 0.01 (paired t‐test).
ANXA1 mRNA levels in paired normal and adenocarcinoma tissues from CRC patients (n = 18). Each symbol shows the average of duplicate qPCR results from one patient. Horizontal lines represent mean values. **P < 0.01 (paired t‐test).
Positive correlation between fadA gene copy numbers (x‐axis) and ANXA1 mRNA levels (y‐axis) in human colorectal adenocarcinoma tissues (n = 18; Pearson's correlation r = 0.62, P < 0.01). Each dot represents the average of qPCR results performed in duplicates.
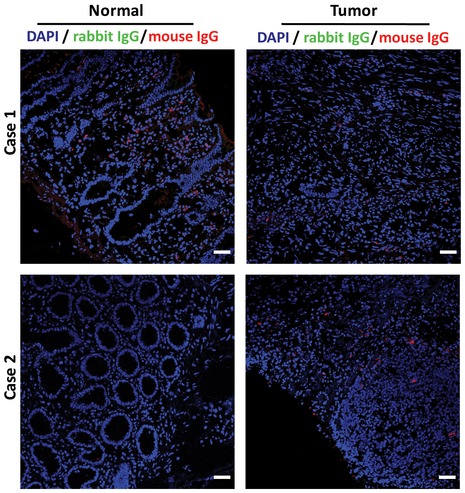
Confocal microscopy analysis of paired normal and carcinoma tissues from two colon cancer patients. The frozen sections were incubated with rabbit anti‐Annexin A1 polyclonal antibodies and 5G11 mouse anti‐FadA monoclonal antibodies. The slides were then stained with Alexa Fluor ®680‐conjugated donkey anti‐rabbit and Alexa Fluor® 555‐conjugated goat anti‐mouse, washed, and covered in mounting medium containing DAPI. The scanning confocal microscopy mages were taken with a Nikon Ti Eclipse inverted microscope at 200× magnification for the normal tissues and 400× for the carcinomas. Scale bar, 50 μm. Co‐localization of FadA (red) and Annexin A1 (green) was observed in carcinomas but not in the paired normal tissues. See Fig EV5 for isotype (rabbit and mouse IgG) controls.
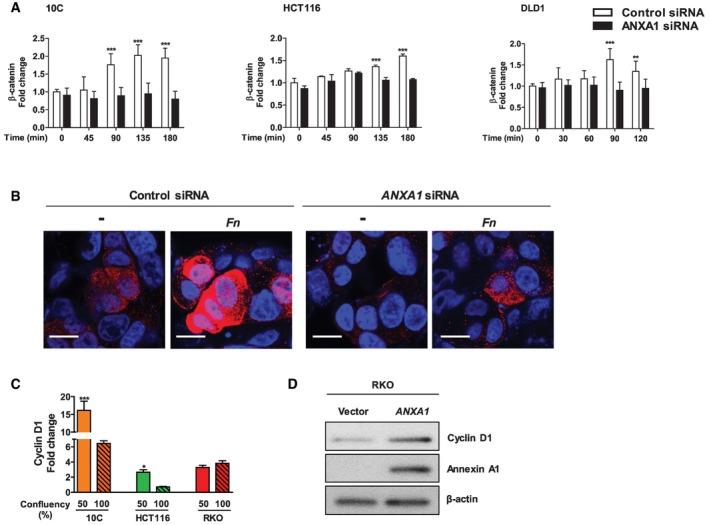
Flow cytometry analysis of β‐catenin expression in 10C, HCT116, and DLD1 cells transfected with control siRNA (clear bars) or ANXA1‐specific siRNA (solid bars) following incubation with F. nucleatum 12230 at MOI of ˜20:1 for indicated time periods. The geometric means of cells treated with control siRNA at time 0 were designated as 1. Data are mean values ± SD. The experiment was performed in duplicates or triplicates and repeated 1–3 times. **P < 0.01, ***P < 0.001 (two‐way ANOVA).
Immunostaining of β‐catenin in 10C cells transfected with control siRNA or ANXA1‐specific siRNA following incubation with F. nucleatum 12230 (Fn) at MOI of ˜100:1 for 2 h. β‐Catenin was stained with Alexa Fluor® 680 (red) and the nuclei with DAPI (blue). The images were captured with confocal microscope at 800× magnification. ‐, no bacteria added. Note the increased expression of β‐catenin and its nucleus translocation in response to F. nucleatum in control siRNA‐treated cells, but not in ANXA1 siRNA‐treated cells. The experiment was repeated twice. Scale bar, 200 nm.
Real‐time qPCR analysis of CCND1 expression using mRNA extracted from the cancerous 10C, HCT116 and RKO, each grown to 50 or 100% confluency. Data are mean values ± SEM. The experiment was performed in triplicates and repeated twice. *P < 0.05, ***P < 0.001 (Student's t‐test).
Western blot analysis of Cyclin D1, Annexin A1, and β‐actin in RKO cells transfected with control vector or ANXA1. Induction of Cyclin D1 was observed in response to transfection of Annexin A1. The experiment was repeated twice.
Similar articles
-
[Banxia Xiexin Decoction inhibiting colitis-associated colorectal cancer infected with Fusobacterium nucleatum by regulating Wnt/β-catenin pathway].Zhongguo Zhong Yao Za Zhi. 2024 Mar;49(5):1266-1274. doi: 10.19540/j.cnki.cjcmm.20231114.701. Zhongguo Zhong Yao Za Zhi. 2024. PMID: 38621974 Chinese.
-
Invasive Fusobacterium nucleatum activates beta-catenin signaling in colorectal cancer via a TLR4/P-PAK1 cascade.Oncotarget. 2017 May 9;8(19):31802-31814. doi: 10.18632/oncotarget.15992. Oncotarget. 2017. PMID: 28423670 Free PMC article.
-
FadA promotes DNA damage and progression of Fusobacterium nucleatum-induced colorectal cancer through up-regulation of chk2.J Exp Clin Cancer Res. 2020 Sep 29;39(1):202. doi: 10.1186/s13046-020-01677-w. J Exp Clin Cancer Res. 2020. PMID: 32993749 Free PMC article.
-
Association of Fusobacterium nucleatum with immunity and molecular alterations in colorectal cancer.World J Gastroenterol. 2016 Jan 14;22(2):557-66. doi: 10.3748/wjg.v22.i2.557. World J Gastroenterol. 2016. PMID: 26811607 Free PMC article. Review.
-
Fusobacterium nucleatum: an emerging bug in colorectal tumorigenesis.Eur J Cancer Prev. 2015 Sep;24(5):373-85. doi: 10.1097/CEJ.0000000000000116. Eur J Cancer Prev. 2015. PMID: 25569450 Review.
Cited by
-
Exploring the oral-gut linkage: Interrelationship between oral and systemic diseases.Mucosal Immunol. 2024 Feb;17(1):147-153. doi: 10.1016/j.mucimm.2023.11.006. Epub 2023 Nov 24. Mucosal Immunol. 2024. PMID: 38007003 Free PMC article. Review.
-
Peryton: a manual collection of experimentally supported microbe-disease associations.Nucleic Acids Res. 2021 Jan 8;49(D1):D1328-D1333. doi: 10.1093/nar/gkaa902. Nucleic Acids Res. 2021. PMID: 33080028 Free PMC article.
-
Assessment of Prognostic Factors, Clinical Features Including the Microbiome, and Treatment Outcomes in Patients with Cancer of Unknown Primary Site.Cancers (Basel). 2024 Oct 8;16(19):3416. doi: 10.3390/cancers16193416. Cancers (Basel). 2024. PMID: 39410035 Free PMC article.
-
Immunomodulation aspects of gut microbiome-related interventional strategies in colorectal cancer.Med Oncol. 2024 Aug 20;41(9):231. doi: 10.1007/s12032-024-02480-9. Med Oncol. 2024. PMID: 39162936 Review.
-
Fusobacterium nucleatum promotes colorectal cancer cells adhesion to endothelial cells and facilitates extravasation and metastasis by inducing ALPK1/NF-κB/ICAM1 axis.Gut Microbes. 2022 Jan-Dec;14(1):2038852. doi: 10.1080/19490976.2022.2038852. Gut Microbes. 2022. PMID: 35220887 Free PMC article.
References
-
- ACS (2012) Cancer Facts & Figures 2012. In pp 1–66. American Cancer Society (ACS)
-
- Vogelstein B, Kinzler KW (1993) The multistep nature of cancer. Trends Genet 9: 138–141 - PubMed
-
- Akkari L, Gocheva V, Kester JC, Hunter KE, Quick ML, Sevenich L, Wang HW, Peters C, Tang LH, Klimstra DS et al (2014) Distinct functions of macrophage‐derived and cancer cell‐derived cathepsin Z combine to promote tumor malignancy via interactions with the extracellular matrix. Genes Dev 28: 2134–2150 - PMC - PubMed
Publication types
MeSH terms
Substances
Grants and funding
LinkOut - more resources
Full Text Sources
Medical
Molecular Biology Databases
Research Materials
