Epigenetic control of early dendritic cell lineage specification by the transcription factor IRF8 in mice
- PMID: 30796024
- PMCID: PMC6484390
- DOI: 10.1182/blood-2018-06-857789
Epigenetic control of early dendritic cell lineage specification by the transcription factor IRF8 in mice
Abstract
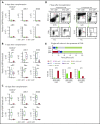
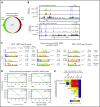
Dendritic cells (DCs), which are vital for immune responses, are derived from bone marrow hematopoietic stem cells via common DC progenitors (CDPs). DC lineage fate decisions occurring at stages much earlier than CDPs have recently been recognized, yet the mechanism remains elusive. By single-cell RNA-sequencing, in vivo cell transfer experiments, and an assay for transposase-accessible chromatin sequencing using wild-type, IRF8-GFP chimera knock-in or IRF8-knockout mice, we demonstrate that IRF8 regulates chromatin at the lymphoid-primed multipotent progenitor (LMPP) stage to induce early commitment toward DCs. A low but significant expression of IRF8, a transcription factor essential for DC and monocyte development, was initiated in a subpopulation within LMPPs. These IRF8+ LMPPs were derived from IRF8- LMPPs and predominantly produced DCs, especially classical DC1s, potentially via known progenitors, such as monocyte-DC progenitors, CDPs, and preclassical DCs. IRF8+ LMPPs did not generate significant numbers of monocytes, neutrophils, or lymphocytes. Although IRF8- and IRF8+ LMPPs displayed very similar global gene expression patterns, the chromatin of enhancers near DC lineage genes was more accessible in IRF8+ LMPPs than in IRF8- LMPPs, an epigenetic change dependent on IRF8. The majority of the genes epigenetically primed by IRF8 were still transcriptionally inactive at the LMPP stage, but were highly expressed in the downstream DC lineage populations such as CDPs. Therefore, early expression of the key transcription factor IRF8 changes chromatin states in otherwise multipotent progenitors, biasing their fate decision toward DCs.
© 2019 by The American Society of Hematology.
Conflict of interest statement
Conflict-of-interest disclosure: The authors declare no competing financial interests.
Figures


Comment in
-
Priority lane to cDC1 open for IRF8+ progenitors.Blood. 2019 Apr 25;133(17):1795-1797. doi: 10.1182/blood-2019-03-900936. Blood. 2019. PMID: 31023741 No abstract available.
Similar articles
-
IRF-8 extinguishes neutrophil production and promotes dendritic cell lineage commitment in both myeloid and lymphoid mouse progenitors.Blood. 2012 Mar 1;119(9):2003-12. doi: 10.1182/blood-2011-06-364976. Epub 2012 Jan 11. Blood. 2012. PMID: 22238324 Free PMC article.
-
A RUNX-CBFβ-driven enhancer directs the Irf8 dose-dependent lineage choice between DCs and monocytes.Nat Immunol. 2021 Mar;22(3):301-311. doi: 10.1038/s41590-021-00871-y. Epub 2021 Feb 18. Nat Immunol. 2021. PMID: 33603226
-
Cryptic activation of an Irf8 enhancer governs cDC1 fate specification.Nat Immunol. 2019 Sep;20(9):1161-1173. doi: 10.1038/s41590-019-0450-x. Epub 2019 Aug 12. Nat Immunol. 2019. PMID: 31406378 Free PMC article.
-
Interferon regulatory factor 8 and the regulation of neutrophil, monocyte, and dendritic cell production.Curr Opin Hematol. 2016 Jan;23(1):11-7. doi: 10.1097/MOH.0000000000000196. Curr Opin Hematol. 2016. PMID: 26554887 Review.
-
Transcriptional and Epigenetic Regulation of Innate Immune Cell Development by the Transcription Factor, Interferon Regulatory Factor-8.J Interferon Cytokine Res. 2016 Jul;36(7):433-41. doi: 10.1089/jir.2015.0138. J Interferon Cytokine Res. 2016. PMID: 27379865 Review.
Cited by
-
ROS regulation in gliomas: implications for treatment strategies.Front Immunol. 2023 Dec 7;14:1259797. doi: 10.3389/fimmu.2023.1259797. eCollection 2023. Front Immunol. 2023. PMID: 38130720 Free PMC article. Review.
-
A Tale of Two Fimbriae: How Invasion of Dendritic Cells by Porphyromonas gingivalis Disrupts DC Maturation and Depolarizes the T-Cell-Mediated Immune Response.Pathogens. 2022 Mar 8;11(3):328. doi: 10.3390/pathogens11030328. Pathogens. 2022. PMID: 35335652 Free PMC article. Review.
-
Dendritic cells in cancer immunology.Cell Mol Immunol. 2022 Jan;19(1):3-13. doi: 10.1038/s41423-021-00741-5. Epub 2021 Sep 3. Cell Mol Immunol. 2022. PMID: 34480145 Free PMC article. Review.
-
Epigenetic Changes Induced by Maternal Factors during Fetal Life: Implication for Type 1 Diabetes.Genes (Basel). 2021 Jun 8;12(6):887. doi: 10.3390/genes12060887. Genes (Basel). 2021. PMID: 34201206 Free PMC article. Review.
-
Origin, Phenotype, and Function of Mouse Dendritic Cell Subsets.Methods Mol Biol. 2023;2618:3-16. doi: 10.1007/978-1-0716-2938-3_1. Methods Mol Biol. 2023. PMID: 36905505
References
-
- Orkin SH, Zon LI. Hematopoiesis and stem cells: plasticity versus developmental heterogeneity. Nat Immunol. 2002;3(4):323-328. - PubMed
-
- Naik SH, Perié L, Swart E, et al. . Diverse and heritable lineage imprinting of early haematopoietic progenitors. Nature. 2013;496(7444):229-232. - PubMed
-
- Yu VW, Yusuf RZ, Oki T, et al. . Epigenetic memory underlies cell-autonomous heterogeneous behavior of hematopoietic stem cells [published correction appears in Cell. 2017;160(5):P944-P945]. Cell. 2016;167(5):1310-1322. - PubMed
Publication types
MeSH terms
Substances
LinkOut - more resources
Full Text Sources
Molecular Biology Databases

