. 2019 Apr 17;93(9):e00111-19.
doi: 10.1128/JVI.00111-19. Print 2019 May 1.

Modeling Herpes Simplex Virus 1 Infections in Human Central Nervous System Neuronal Cells Using Two- and Three-Dimensional Cultures Derived from Induced Pluripotent Stem Cells

Affiliations

Modeling Herpes Simplex Virus 1 Infections in Human Central Nervous System Neuronal Cells Using Two- and Three-Dimensional Cultures Derived from Induced Pluripotent Stem Cells

Leonardo D'Aiuto et al. J Virol. .

Abstract

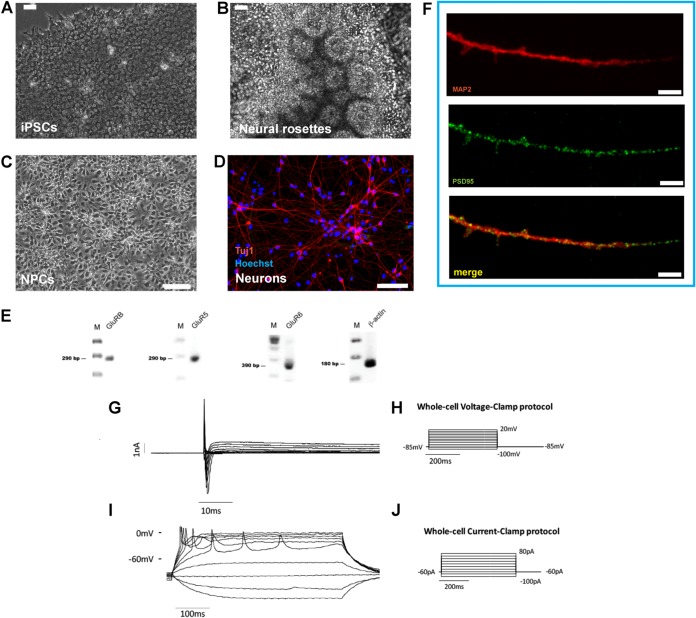
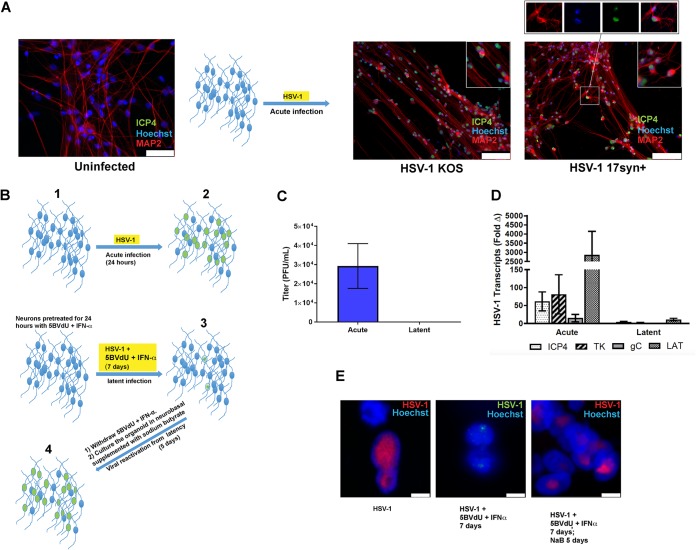
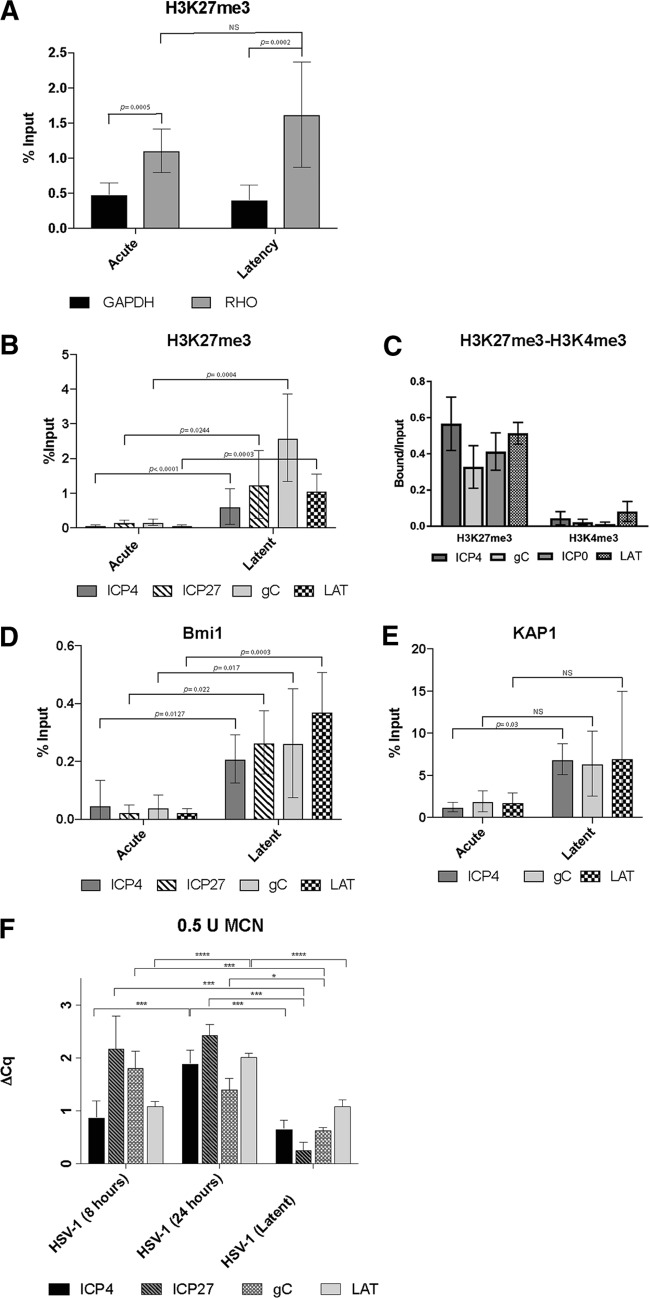
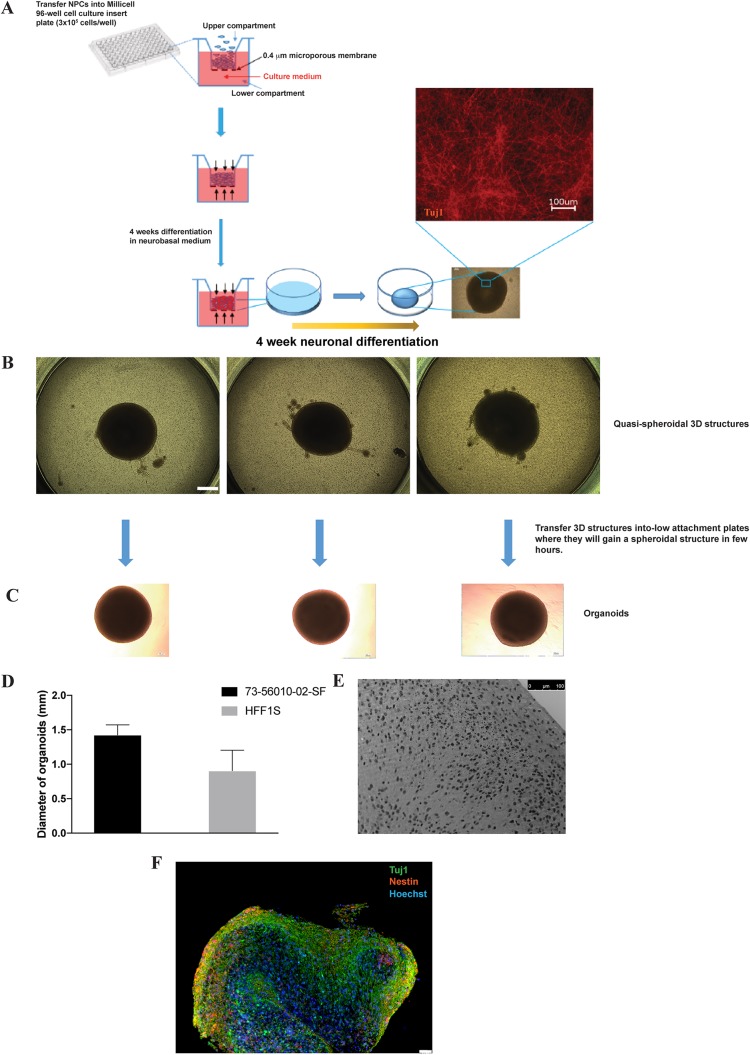
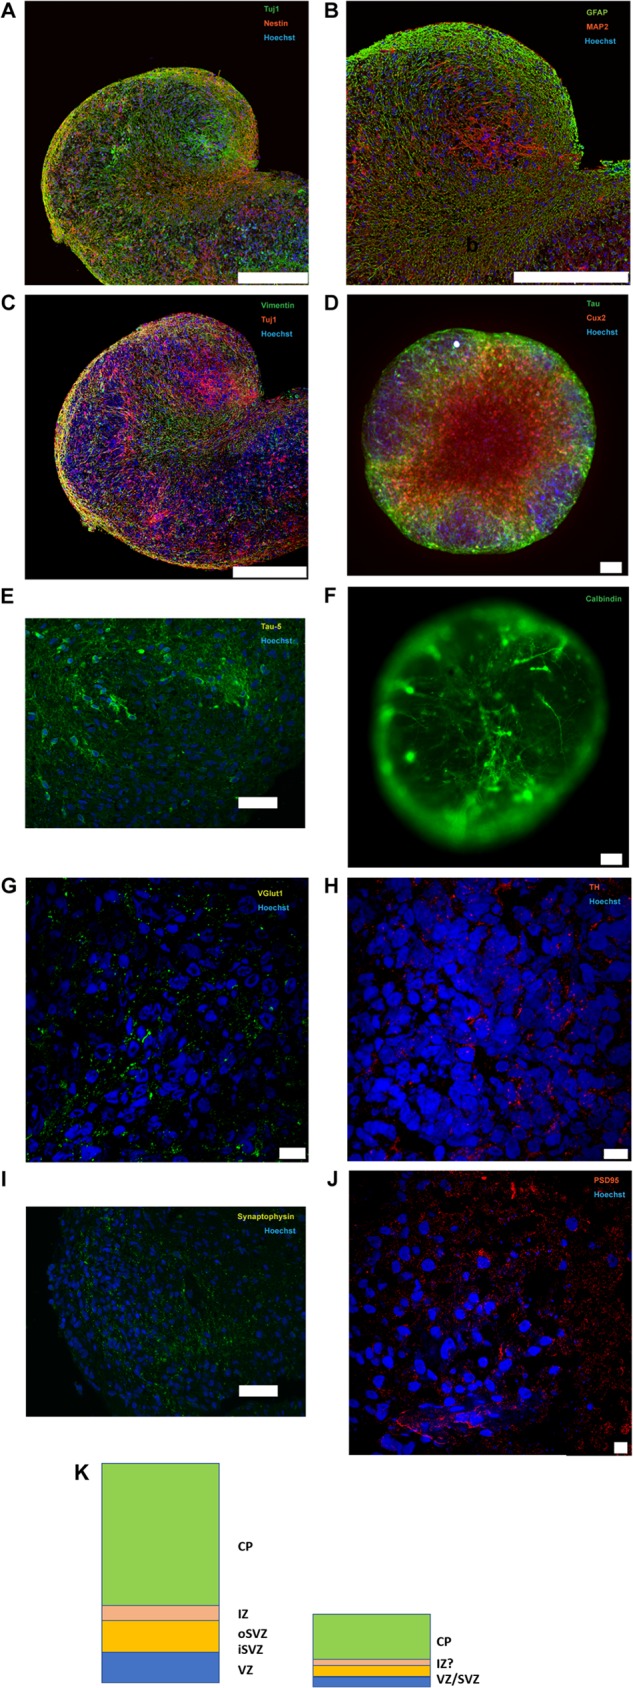
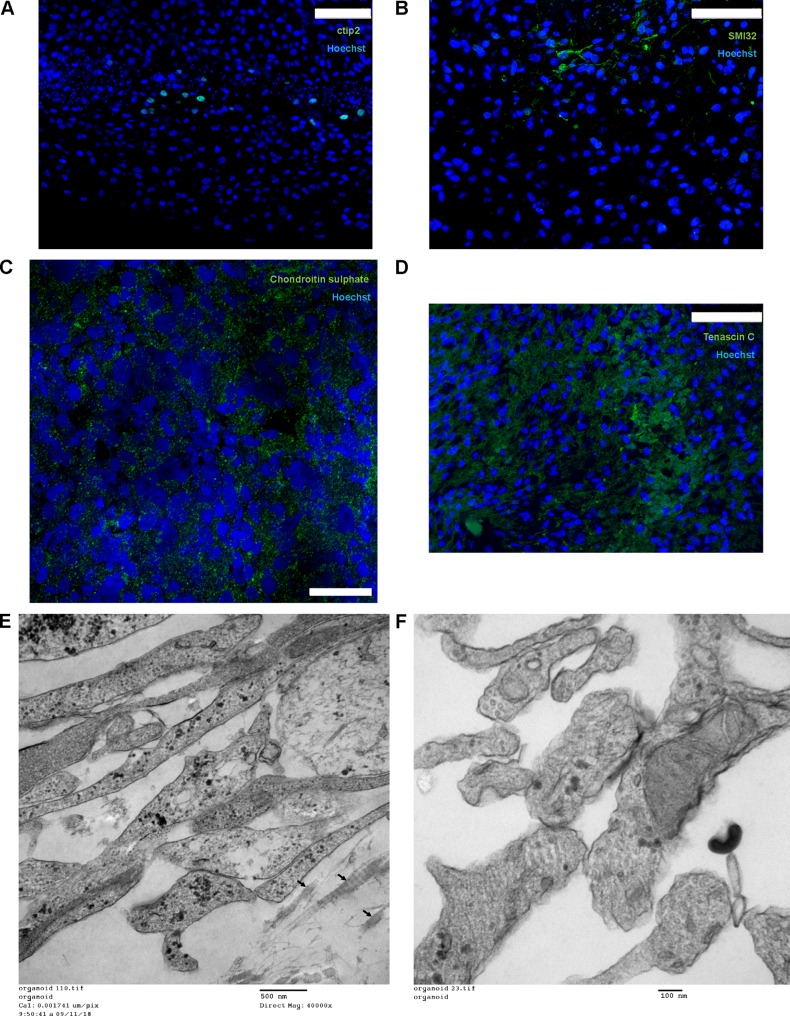
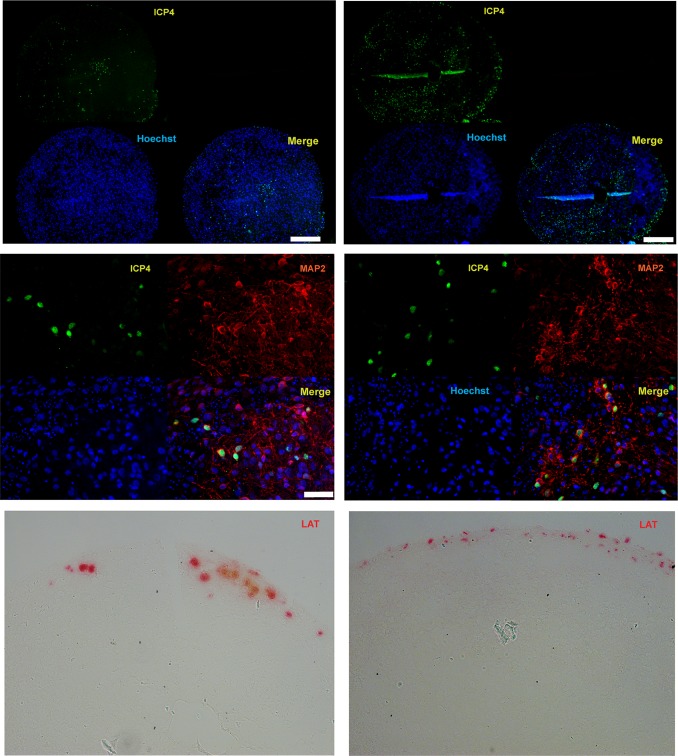
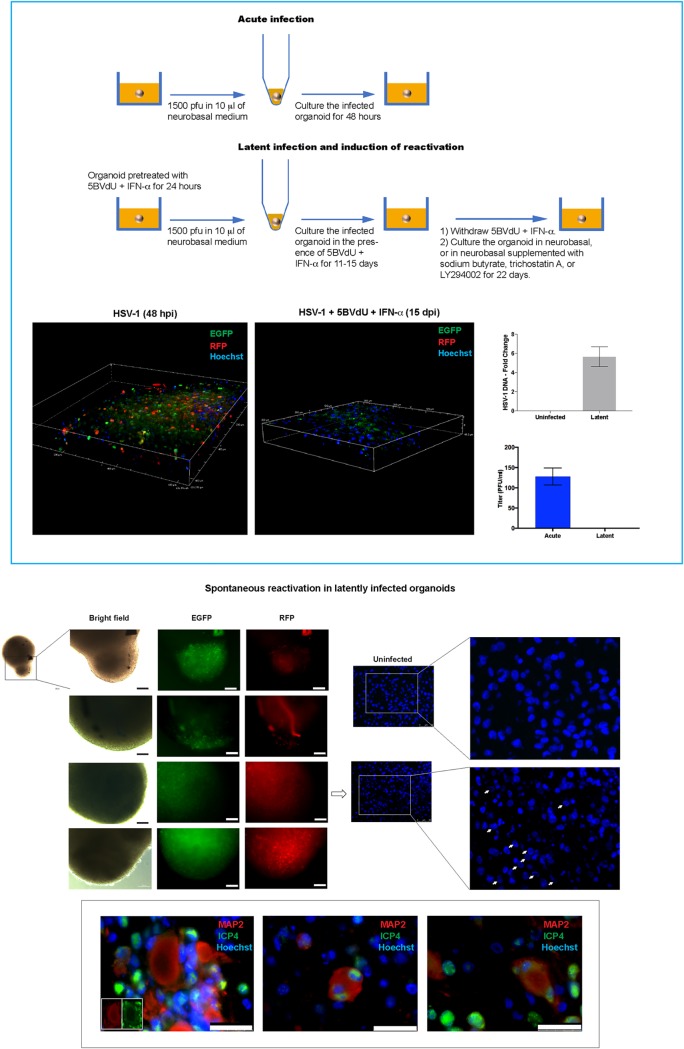
Herpes simplex virus 1 (HSV-1) establishes latency in both peripheral nerve ganglia and the central nervous system (CNS). The outcomes of acute and latent infections in these different anatomic sites appear to be distinct. It is becoming clear that many of the existing culture models using animal primary neurons to investigate HSV-1 infection of the CNS are limited and not ideal, and most do not recapitulate features of CNS neurons. Human induced pluripotent stem cells (hiPSCs) and neurons derived from them are documented as tools to study aspects of neuropathogenesis, but few have focused on modeling infections of the CNS. Here, we characterize functional two-dimensional (2D) CNS-like neuron cultures and three-dimensional (3D) brain organoids made from hiPSCs to model HSV-1-human-CNS interactions. Our results show that (i) hiPSC-derived CNS neurons are permissive for HSV-1 infection; (ii) a quiescent state exhibiting key landmarks of HSV-1 latency described in animal models can be established in hiPSC-derived CNS neurons; (iii) the complex laminar structure of the organoids can be efficiently infected with HSV, with virus being transported from the periphery to the central layers of the organoid; and (iv) the organoids support reactivation of HSV-1, albeit less efficiently than 2D cultures. Collectively, our results indicate that hiPSC-derived neuronal platforms, especially 3D organoids, offer an extraordinary opportunity for modeling the interaction of HSV-1 with the complex cellular and architectural structure of the human CNS.IMPORTANCE This study employed human induced pluripotent stem cells (hiPSCs) to model acute and latent HSV-1 infections in two-dimensional (2D) and three-dimensional (3D) CNS neuronal cultures. We successfully established acute HSV-1 infections and infections showing features of latency. HSV-1 infection of the 3D organoids was able to spread from the outer surface of the organoid and was transported to the interior lamina, providing a model to study HSV-1 trafficking through complex neuronal tissue structures. HSV-1 could be reactivated in both culture systems; though, in contrast to 2D cultures, it appeared to be more difficult to reactivate HSV-1 in 3D cultures, potentially paralleling the low efficiency of HSV-1 reactivation in the CNS of animal models. The reactivation events were accompanied by dramatic neuronal morphological changes and cell-cell fusion. Together, our results provide substantive evidence of the suitability of hiPSC-based neuronal platforms to model HSV-1-CNS interactions in a human context.

Keywords: herpes simplex virus 1 (HSV-1); human induced pluripotent stem cells (hiPSCs); neurodegeneration; organoid; three-dimensional (3D) neuronal cultures.


Figures

FIG 1
FIG 1
Neuronal differentiation of human iPSCs (hiPSCs) in 2D cultures. (A to F) hiPSCs (A) are differentiated into columnar epithelial cells, forming neural rosettes (B). (C) hiPSC-derived neural rosettes are expanded as monolayer cultures of neural stem cells/neural progenitor cells (collectively referred as neural precursor cells [NPCs] in this study). (D) NPCs are further differentiated into neurons, illustrated using Tuj1 immunofluorescence (red) with Hoechst 33342 counterstaining of nuclei (blue). (E) These cells express the glutamate receptors GluRB, GluR5, and GluR6. Lanes M, molecular size markers. (F) Coimmunostaining of hiPSC-derived neurons with PSD-95 (green) and MAP2 (red) revealed PSD-95-labeled dendritic protrusions resembling a spine. (A to C) Phase-contrast microscopy; (D, F) confocal fluorescence microscopy. Bars, 50 μm (A and B), 100 μm (C), 75 μm (D), 5 μm (F). (G to J) Electrophysiological recordings of hiPSC-derived neurons. In voltage clamp experiments on cells with a resting potential equal to or more negative than −40 mV, when the membrane potential was depolarized from −100 mV to 20 mV starting from a holding potential of −85 mV, two notable currents were evoked: a fast inward Na+ component (evoked starting from −30 mV until 20 mV, with a maximum value of current at −30 mV of −2,263 ± 329.4 pA; mean ± SEM, n = 4 cells) and a slower outward K+ component (evoked starting from −30 mV until 20 mV, with a maximum value of current at 20 mV of 1,020 ± 179.5 pA; mean ± SEM, n = 4 cells). In current clamp mode, depolarizing steps of current from −100 pA to 80 pA were used to detect the ability of the cells to generate action potentials. hiPSC-derived neurons showed repetitive evoked action potentials that were in line with the recorded currents. (G) Voltage clamp recording. The currents recorded consist of an inward Na+ component and of an outward K+ component. (H) Currents were recorded using a voltage clamp protocol consisting of depolarizing steps from −100 mV to 20 mV starting from a holding potential of −85 mV. (I and J) A representative trace of evoked action potentials obtained in current clamp mode (I) injecting depolarizing steps of current from −100 pA to 80 pA (J).
FIG 2
FIG 2
Establishment of latent HSV-1 infection in CNS neurons in 2D cultures. (A) Microphotographs depicting uninfected and HSV-1 acutely infected neurons (strains 17syn+ and KOS). Cells were processed using antibodies generated against ICP4 and MAP2 48 h after the infection. (Insets) Enlarged details. In particular, the inset at the top right shows that the HSV-1 antigen ICP4 is detected in the Hoechst-negative areas of infected neuronal nuclei. (B) Flow chart illustrating culture treatment paradigm: neurons are infected with HSV-1 (KOS) for 24 h (acute infection) (step 1), infected with HSV-1 and exposed to 5BVdU and IFN-α for 7 days (latent infection) (step 2), or infected with HSV-1 and cultured with 5BVdU and IFN-α for 7 days (step 3), after which the drugs are removed from the culture medium and infected cells are further cultured for 5 days in neurobasal medium with sodium butyrate (NaB) (step 4). (C) The viral titer in the supernatants from the acutely and latently infected culture plates was measured using a plaque assay on Vero cells. (D) A comparative analysis of viral gene expression in acutely and latently infected neurons demonstrates downregulation in latent infection. (E) Fluorescent in situ hybridization (FISH) was performed using the HSV-1 genome as a probe to detect viral DNA in acutely (left) and latently (middle) infected neurons, and during reactivation (right). Bars, 50 μm in uninfected neurons (A), 100 μm in neurons infected with HSV-1 KOS and 17syn+ (A), and 5 μm (E).
FIG 3
FIG 3
Chromatin analysis of HSV-1 in acutely and latently infected hiPSC-derived CNS neurons. (A) Validation of the ChIPs using anti-H3K27me3 by analyzing the results of ChIP-qPCR with positive-control PCR primers/probe to rhodopsin (RHO) compared to those of ChIP-qPCR with a negative-control PCR primer/probe to GAPDH. (B to E) Comparison of the enrichment of H3K27me3 (B and C), H3K4me3 (C), the polycomb group protein Bmi1 (D), and the coregulator of the Krüppel-associated box-containing zinc finger proteins (KAP1) (E) at the indicated viral promoter regions in acutely and latently infected hiPSC-derived neuronal cultures via ChIP analysis. The data represent averages from three independent experiments. The ChIP-qPCR data in panels A, B, D, and E were normalized using the percent input method, while in panel C, the relative quantities of enrichment are represented as bound/unbound. Error bars represent standard deviations (SD). P values were determined using Student's t test. (F) Analysis of HSV-1 chromatin accessibility to MCN by ChART-PCR. hiPSC-neurons were acutely infected with an HSV-1 construct expressing reporter genes EGFP and RFP under the control of viral promoters for 8 h and 24 h and latently infected with HSV-1 for 7 days at an MOI of 0.3. Following MCN digestion and DNA extraction, real-time qPCR was conducted using primers specific to promoter regions of viral genes. MCN accessibility was determined by calculating the difference in the amounts of undigested DNA and digested DNA (ΔCq). Error bars represent the standard deviation of the ΔCq values. P values were determined using a post hoc Tukey test. *, P ≤ 0.05; ***, P ≤ 0.001; ****, P < 0.0001; NS, not significant.
FIG 4
FIG 4
Generation of brain organoids in Millicell-96 cell culture insert plates. (A) Schematic representation of the differentiation procedure. NPCs were seeded at a density of 3 × 105 cells/well on 96-transwell plates. Cells were differentiated for 3 to 4 weeks, as described in the Materials and Methods section. (B) During this period, NPCs self-assembled and organized into multiple layers, forming quasispheroidal structures. (C) These 3D structures were then collected, transferred individually into low-attachment 24-well plates (where, over the course of hours, they assumed a roughly spherical shape), and cultured for an extended period of time. (D) The average size of the organoids after 8 weeks of NPC differentiation is depicted. (E) Hematoxylin and eosin staining of a 10-week-old organoid. (F) Wide-field micrograph of a formalin-fixed, paraffin-embedded section coimmunostained with Tuj1 and nestin. Nuclei were counterstained with Hoechst 33342. Bars, 500 mm (B) and 50 mm (F).
FIG 5
FIG 5
Characterization of brain organoids. (A to J) Immunostaining of formalin-fixed, paraffin-embedded sections, paraformaldehyde-fixed frozen sections of organoids, or paraformaldehyde-fixed whole-brain organoids with Tuj1/nestin (A), GFAP/MAP2 (B), vimentin/Tuj1 (C), Tau (HT7)/Cux2 (D), Tau-5 (E), calbindin (F), VGlut1 (G), TH (H), synaptophysin (I), and PSD95 (J). (D and F) Immunostaining of whole-brain organoids. Nuclei were counterstained with Hoechst 33342. Bars, 250 μm (A to C), 10 μm (G, H, and J), 50 μm (E and I), and 100 μm (D and F). (K) Comparison of the organization of a developing human brain with the organoids generated in this study. VZ, ventricular zone; iSVZ, inner subventricular zone; oSVZ, outer subventricular zone; IZ, intermediate zone; CP, cortical plate.
FIG 6
FIG 6
Characterization of brain organoids. (A to D) Immunostaining of formalin-fixed, paraffin-embedded sections of organoids with Ctip2 (A), SMI-32 (B), chondroitin sulfate (C), and tenascin C (D). Bars, 75 mm (A, B, and D) and 20 mm (C). (E and F) Transmission electron microscopy photographs depicting collagen (arrows) as a component of the extracellular matrix (E) and putative synapses (F) in 5-month-old organoids. The organoids were processed for electron microscopy as previously described (63). Nickel grids were examined on a JEOL 1011 transmission electron microscope with a side mount AMT 2k digital camera (Advanced Microscopy Techniques, Danvers, MA).
FIG 7
FIG 7
Analysis of ICP4 and LAT expression in HSV-1 acutely infected 10-week-old organoids at 48 h postinfection. (Top) Immunostaining of two paraffin-embedded sections of the same organoid infected with the HSV-1 immediate early gene ICP4. (Middle) Coimmunostaining of a HSV-1-infected organoid with ICP4 and the neuronal marker MAP2. (Bottom) Analysis of LAT expression by RNAscope in situ hybridization analysis. Nuclei were counterstained with Hoechst 33342. Bars, 250 μm (top) and 50 μm (middle).
FIG 8
FIG 8
Reduced likelihood of spontaneous or induced reactivation of HSV-1 in brain organoids. Organoids were infected with an HSV-1 construct expressing the reporter genes EGFP and RFP under the control of the HSV-1 promoters ICP0 and gC, respectively, in the absence or the presence of the antivirals 5BVdU and IFN-α (to establish latency). Under the latency condition, the expression of the reporter genes was not observed in 19 out of 23 infected organoids. Paraffin-embedded sections of these latently infected organoids were used to detect viral DNA and analyze the distribution of the host chromatin in infected nuclei. The presence of viral particles in the culture medium of acutely and latently infected organoids was analyzed. (Top box) (Top) Flow chart illustrating acute, latent infection and chemical treatment to induce reactivation. (Bottom left and middle) Confocal imaging of a few layers of organoids infected with HSV-1 in the absence or the presence of 5BVdU and IFN-α; (bottom right) (i) detection of HSV-1 DNA in paraffin-embedded sections of latently infected organoids by quantitative PCR (qPCR) (top) and (ii) viral titer in the supernatants from the acutely and latently infected cultures, measured using a plaque assay on Vero cells (bottom). (Middle) Microphotographs depicting spontaneous HSV-1 reactivation in four latently infected organoids (left) and Hoechst staining of paraffin-embedded sections of an uninfected organoid and an organoid where HSV-1 reactivation was observed (middle and right, where the panels on the right are enlargements of the boxed regions in the panels in the middle). Arrows indicate nuclei showing host chromatin reorganization, which is typically observed in HSV-1-infected cells. (Bottom) Detection of cell-cell fusion during HSV-1 reactivation in organoids. (Insets) Details enlarged in the middle and right panels. Nuclei were counterstained with Hoechst. Bars, 100 μm (middle left) and 25 μm (bottom).

Similar articles

Cited by

References

    1. Stevens JG, Wagner EK, Devi-Rao GB, Cook ML, Feldman LT. 1987. RNA complementary to a herpesvirus alpha gene mRNA is prominent in latently infected neurons. Science 235:1056–1059. doi:10.1126/science.2434993. - DOI - PubMed
    1. Spivack JG, Fraser NW. 1987. Detection of herpes simplex virus type 1 transcripts during latent infection in mice. J Virol 61:3841–3847. - PMC - PubMed
    1. Ma JZ, Russell TA, Spelman T, Carbone FR, Tscharke DC. 2014. Lytic gene expression is frequent in HSV-1 latent infection and correlates with the engagement of a cell-intrinsic transcriptional response. PLoS Pathog 10:e1004237. doi:10.1371/journal.ppat.1004237. - DOI - PMC - PubMed
    1. Cliffe AR, Garber DA, Knipe DM. 2009. Transcription of the herpes simplex virus latency-associated transcript promotes the formation of facultative heterochromatin on lytic promoters. J Virol 83:8182–8190. doi:10.1128/JVI.00712-09. - DOI - PMC - PubMed
    1. Kwiatkowski DL, Thompson HW, Bloom DC. 2009. The polycomb group protein Bmi1 binds to the herpes simplex virus 1 latent genome and maintains repressive histone marks during latency. J Virol 83:8173–8181. doi:10.1128/JVI.00686-09. - DOI - PMC - PubMed

MeSH terms