Lupus nephritis is linked to disease-activity associated expansions and immunity to a gut commensal
- PMID: 30782585
- PMCID: PMC6585303
- DOI: 10.1136/annrheumdis-2018-214856
Lupus nephritis is linked to disease-activity associated expansions and immunity to a gut commensal
Abstract
Background/purpose: To search for a transmissible agent involved in lupus pathogenesis, we investigated the faecal microbiota of patients with systemic lupus erythematosus (SLE) for candidate pathobiont(s) and evaluated them for special relationships with host immunity.
Methods: In a cross-sectional discovery cohort, matched blood and faecal samples from 61 female patients with SLE were obtained. Faecal 16 S rRNA analyses were performed, and sera profiled for antibacterial and autoantibody responses, with findings validated in two independent lupus cohorts.
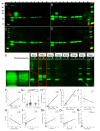
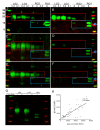
Results: Compared with controls, the microbiome in patients with SLE showed decreased species richness diversity, with reductions in taxonomic complexity most pronounced in those with high SLE disease activity index (SLEDAI). Notably, patients with SLE had an overall 5-fold greater representation of Ruminococcus gnavus (RG) of the Lachnospiraceae family, and individual communities also displayed reciprocal contractions of a species with putative protective properties. Gut RG abundance correlated with serum antibodies to only 1/8 RG strains tested. Anti-RG antibodies correlated directly with SLEDAI score and antinative DNA levels, but inversely with C3 and C4. These antibodies were primarily against antigen(s) in an RG strain-restricted pool of cell wall lipoglycans. Novel structural features of these purified lipoglycans were characterised by mass spectrometry and NMR. Highest levels of serum anti-RG strain-restricted antibodies were detected in those with active nephritis (including Class III and IV) in the discovery cohort, with findings validated in two independent cohorts.
Conclusion: These findings suggest a novel paradigm in which specific strains of a gut commensal may contribute to the immune pathogenesis of lupus nephritis.
Keywords: autoantibodies; commensal; gut barrier; microbiome; pathobiont.
© Author(s) (or their employer(s)) 2019. Re-use permitted under CC BY-NC. No commercial re-use. See rights and permissions. Published by BMJ.
Conflict of interest statement
Competing interests: NYU has filed intellectual property related to this report.
Figures


Comment in
-
Changing the wolf from outside: how microbiota trigger systemic lupus erythematosus.Ann Rheum Dis. 2019 Jul;78(7):867-869. doi: 10.1136/annrheumdis-2019-215221. Epub 2019 May 10. Ann Rheum Dis. 2019. PMID: 31076388 No abstract available.
-
The level of peripheral regulatory T cells is linked to changes in gut commensal microflora in patients with systemic lupus erythematosus.Ann Rheum Dis. 2021 Nov;80(11):e177. doi: 10.1136/annrheumdis-2019-216504. Epub 2019 Nov 15. Ann Rheum Dis. 2021. PMID: 31732515 No abstract available.
-
Response to: 'The level of peripheral regulatory T cells is linked to changes in gut commensal microflora in patients with systemic lupus erythematosus' by Zhang et al and the phylogeny of a candidate pathobiont in lupus nephritis.Ann Rheum Dis. 2021 Nov;80(11):e178. doi: 10.1136/annrheumdis-2019-216523. Epub 2019 Nov 15. Ann Rheum Dis. 2021. PMID: 31732516 No abstract available.
Similar articles
-
Longitudinal gut microbiome analyses and blooms of pathogenic strains during lupus disease flares.Ann Rheum Dis. 2023 Oct;82(10):1315-1327. doi: 10.1136/ard-2023-223929. Epub 2023 Jun 26. Ann Rheum Dis. 2023. PMID: 37365013 Free PMC article.
-
Sex-dependent Lupus Blautia (Ruminococcus) gnavus strain induction of zonulin-mediated intestinal permeability and autoimmunity.Front Immunol. 2022 Aug 11;13:897971. doi: 10.3389/fimmu.2022.897971. eCollection 2022. Front Immunol. 2022. PMID: 36032126 Free PMC article.
-
Autoimmune reactivity to malondialdehyde adducts in systemic lupus erythematosus is associated with disease activity and nephritis.Arthritis Res Ther. 2018 Feb 26;20(1):36. doi: 10.1186/s13075-018-1530-2. Arthritis Res Ther. 2018. PMID: 29482604 Free PMC article.
-
Recent Advances in Our Understanding of the Link between the Intestinal Microbiota and Systemic Lupus Erythematosus.Int J Mol Sci. 2019 Sep 30;20(19):4871. doi: 10.3390/ijms20194871. Int J Mol Sci. 2019. PMID: 31575045 Free PMC article. Review.
-
Diagnostic and prognostic significance of anti-C1q antibodies in systemic lupus erythematosus.Curr Opin Nephrol Hypertens. 2003 Nov;12(6):619-24. doi: 10.1097/00041552-200311000-00008. Curr Opin Nephrol Hypertens. 2003. PMID: 14564199 Review.
Cited by
-
A Comparison of Growth Performance, Blood Parameters, Rumen Fermentation, and Bacterial Community of Tibetan Sheep When Fattened by Pasture Grazing versus Stall Feeding.Microorganisms. 2024 Sep 28;12(10):1967. doi: 10.3390/microorganisms12101967. Microorganisms. 2024. PMID: 39458276 Free PMC article.
-
Environment and systemic autoimmune rheumatic diseases: an overview and future directions.Front Immunol. 2024 Sep 10;15:1456145. doi: 10.3389/fimmu.2024.1456145. eCollection 2024. Front Immunol. 2024. PMID: 39318630 Free PMC article. Review.
-
Fecal microbiota transplantation for the treatment of chronic inflammatory skin diseases.Heliyon. 2024 Sep 7;10(18):e37432. doi: 10.1016/j.heliyon.2024.e37432. eCollection 2024 Sep 30. Heliyon. 2024. PMID: 39309854 Free PMC article. Review.
-
Genetically predicted the causal relationship between gut microbiota and the risk of polymyositis/dermatomyositis: a Mendelian randomization analysis.Front Microbiol. 2024 Aug 21;15:1409497. doi: 10.3389/fmicb.2024.1409497. eCollection 2024. Front Microbiol. 2024. PMID: 39234555 Free PMC article.
-
Effects of live and pasteurized forms of Lactobacillus casei Zhang on acute kidney injury and chronic renal fibrosis.Braz J Microbiol. 2024 Aug 26. doi: 10.1007/s42770-024-01491-y. Online ahead of print. Braz J Microbiol. 2024. PMID: 39222221
References
-
- Menzel AEO, Heidelberger MJ. Cell protein fractions of bovine and avian tubercle Bacillus strains and of the timothygrass Bacillus. J Biol Chem 1938;124:301–7.
Publication types
MeSH terms
Substances
Supplementary concepts
Grants and funding
LinkOut - more resources
Full Text Sources
Other Literature Sources
Medical
Miscellaneous
