. 2019 Mar;20(3):326-336.
doi: 10.1038/s41590-019-0312-6. Epub 2019 Feb 18.

Subsets of exhausted CD8+ T cells differentially mediate tumor control and respond to checkpoint blockade

Affiliations

Subsets of exhausted CD8+ T cells differentially mediate tumor control and respond to checkpoint blockade

Brian C Miller et al. Nat Immunol. 2019 Mar.

Erratum in

Abstract

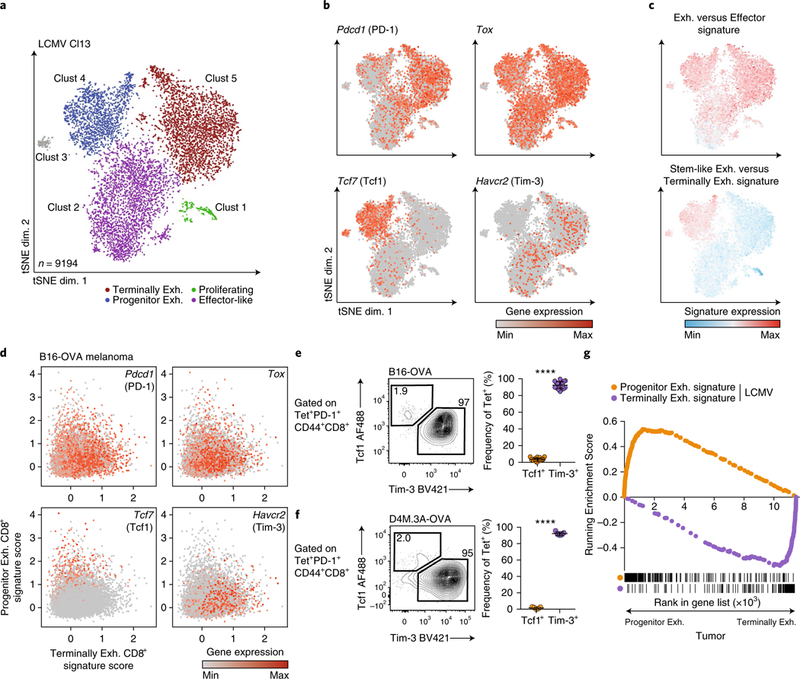
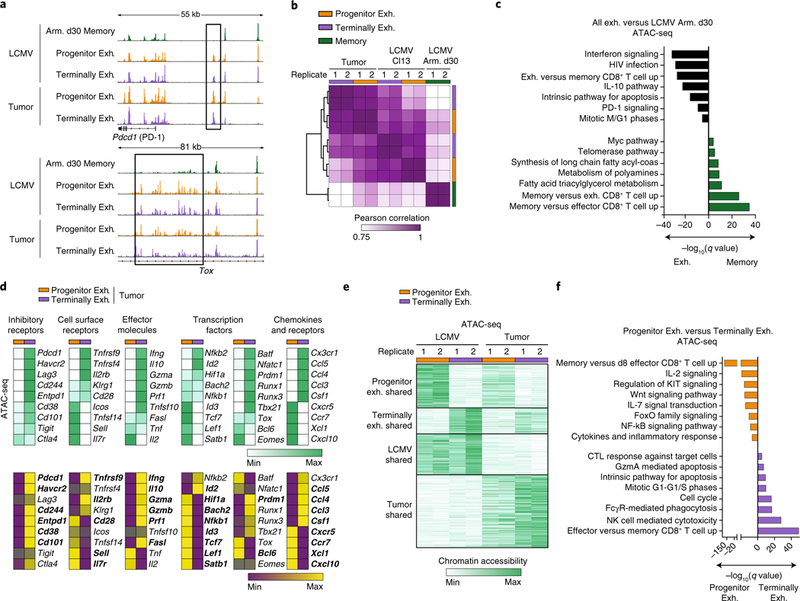
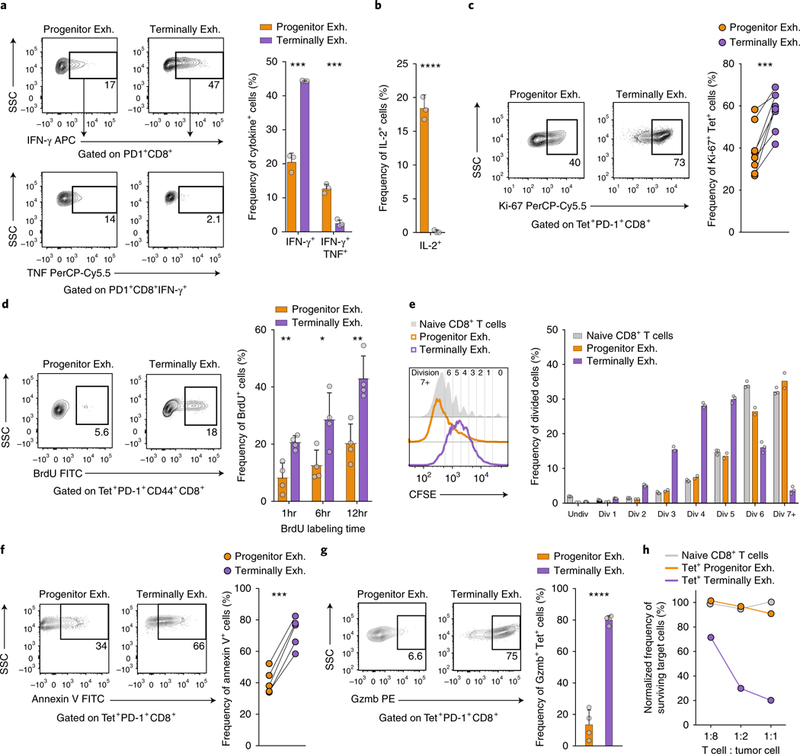
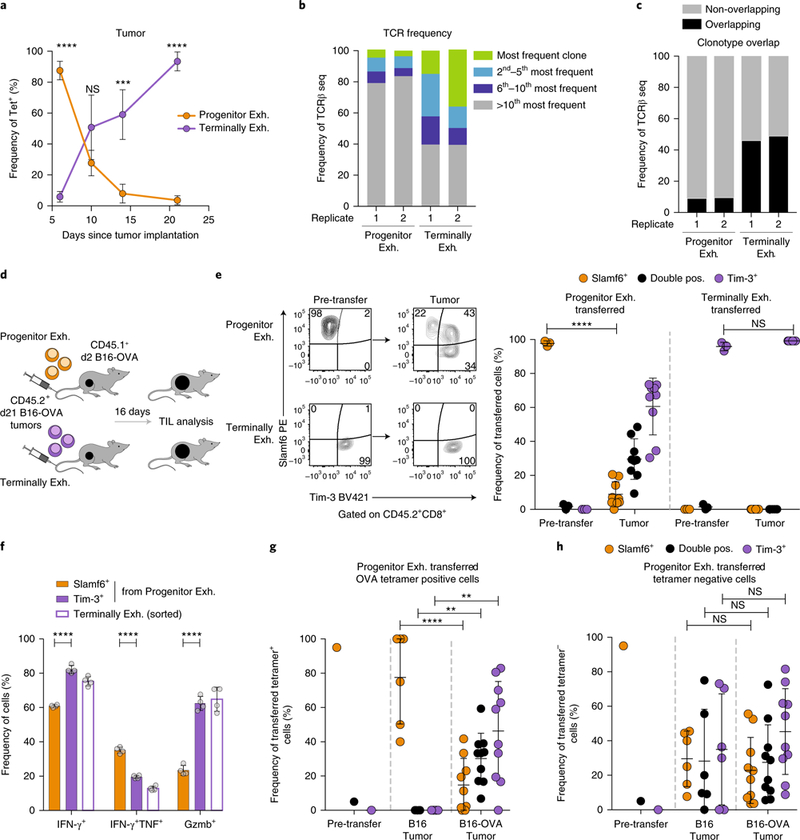
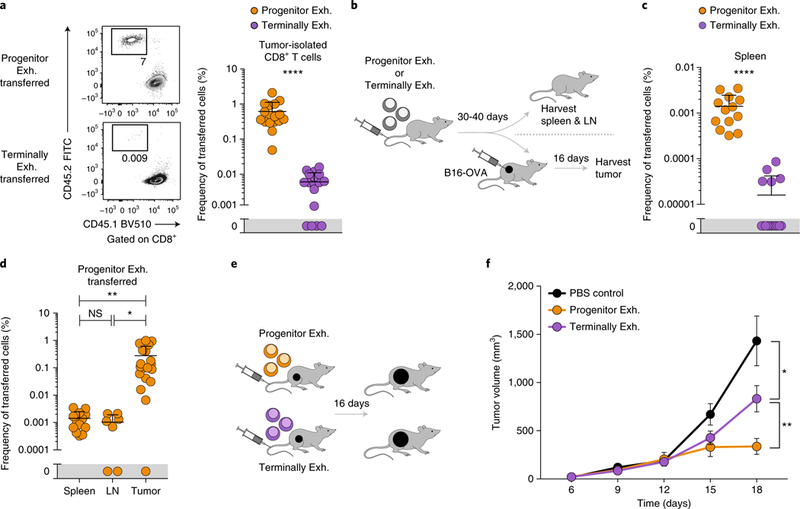
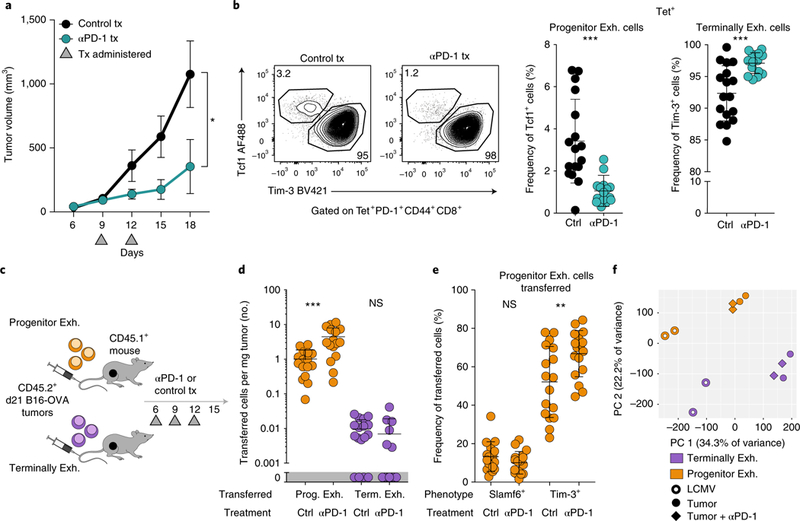
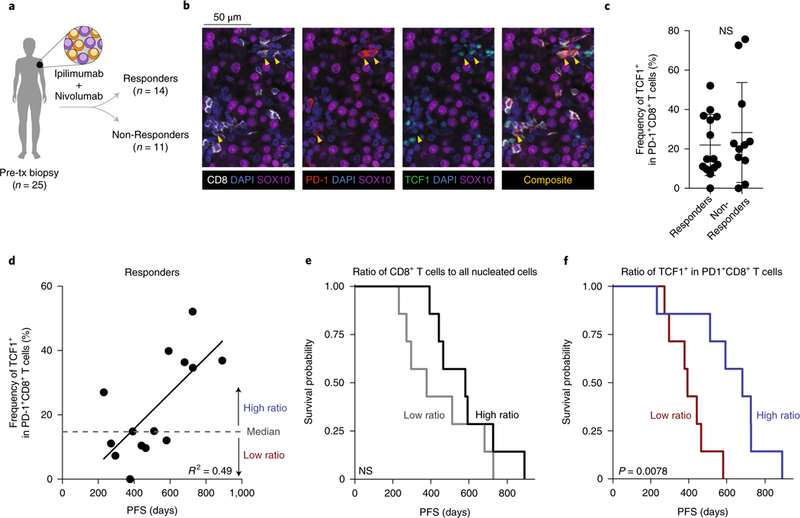
T cell dysfunction is a hallmark of many cancers, but the basis for T cell dysfunction and the mechanisms by which antibody blockade of the inhibitory receptor PD-1 (anti-PD-1) reinvigorates T cells are not fully understood. Here we show that such therapy acts on a specific subpopulation of exhausted CD8+ tumor-infiltrating lymphocytes (TILs). Dysfunctional CD8+ TILs possess canonical epigenetic and transcriptional features of exhaustion that mirror those seen in chronic viral infection. Exhausted CD8+ TILs include a subpopulation of 'progenitor exhausted' cells that retain polyfunctionality, persist long term and differentiate into 'terminally exhausted' TILs. Consequently, progenitor exhausted CD8+ TILs are better able to control tumor growth than are terminally exhausted T cells. Progenitor exhausted TILs can respond to anti-PD-1 therapy, but terminally exhausted TILs cannot. Patients with melanoma who have a higher percentage of progenitor exhausted cells experience a longer duration of response to checkpoint-blockade therapy. Thus, approaches to expand the population of progenitor exhausted CD8+ T cells might be an important component of improving the response to checkpoint blockade.


Figures

Fig. 1 |
Fig. 1 |. Chronic viral infection and tumors elicit analogous subsets of exhausted CD8+ T cells.
a, tSNE projection of scRNA-seq profiles from 9,194 gp33 tetramer+ CD8+ T cells responding to chronic LCMV (day 28 after infection), colored by cluster. exh., exhausted. b, Expression of indicated genes in individual cells from a. c, Enrichment of a signature of genes upregulated in exhausted versus effector CD8+ T cells (GSE9650) or stem-like exhausted versus terminally exhausted CD8+ T cells (GSE84105), P<1 × 10⁻⁶ by two-sided Kolmogorov–Smirnov test for each comparison. d, scRNA-seq profiles of 11,212 PD-1+CD44+CD8+ T cells isolated from day-10 and day-20 B16-OVA tumors. Cells were scored for expression of the progenitor exhausted CD8+ T cell signature and terminally exhausted CD8+ T cell signature from the LCMV dataset in a. Cells were projected in a two-dimensional (2D) scatter plot on the basis of their scores. e, Frequency of progenitor exhausted (Tcf1+Tim-3-) and terminally exhausted (Tcf1-Tim-3+) CD8+ T cells from B16-OVA tumors, gated on tetramer+ cells. Representative flow plot (left) and summary (right) of three independent experiments, n = 17 mice. f, Frequency of progenitor and terminally exhausted CD8+ T cells from D4M.3A-OVA tumors, gated on tetramer+ cells. Representative flow plot (left) and summary (right) of one of two independent experiments, n = 5 mice. g, GSEA of a signature of LCMV progenitor exhausted CD8+ T cells versus terminally exhausted CD8+ T cells (orange) or the inverse (purple) in the ranked list of genes differentially expressed by progenitor exhausted CD8+ TILs versus terminally exhausted CD8+ TILs from B16-OVA tumors. All RNA-seq data are representative of two biologically independent pooled samples. FDR < 0.001 for each comparison, by gene-set permutation test. Mean ± s.d.; two-sided Student’s t-test (e,f); ****P ≤ 0.0001.
Fig. 2 |
Fig. 2 |. Progenitor and terminally exhausted CD8+ TILs have distinct epigenetic and transcriptional features.
a, Representative ATAC-seq tracks at the Pdcd1 (top) and Tox (bottom) loci from CD8+ T cells sorted from mice at day 30 after infection with LCMV-Armstrong (Arm.) or at day 30 after infection with LCMV Cl13 or day-22 B16-OVA tumors. All ATAC-seq data representative of two biologically independent pooled samples. b, Pearson correlation of ATAC-seq profiles from progenitor exhausted cells, terminally exhausted cells and memory cells. c, Enrichment of gene signatures from the MSigDB database (rows) from regions in shared exhaustion program. q values (hypergeometric test) presented as -log10. d, Heatmap illustrating the average ATAC-seq peak intensity (top) or transcript expression (bottom) of the indicated genes. Rows represent averaged z-scores. Bolded names in RNA-seq represent transcripts with significant differential expression by DESeq2 (q < 0.05). e, K-means clustering of open chromatin regions from LCMV Cl13 and tumor CD8+ T cells (k = 4). Universe of all differential peaks (n = 56,404). f, Enrichment of gene signatures from MSigDB (rows) from the cluster of open chromatin regions specific to progenitor exhausted or terminally exhausted cells in e. q values (hypergeometric test) presented as -log10. NK, natural killer; CTL, cytotoxic T lymphocyte.
Fig. 3 |
Fig. 3 |. Progenitor exhausted and terminally exhausted CD8+ TILs have distinct functional properties.
a, Frequency of IFN-γ+ and IFN-γ+TNF+ progenitor exhausted (Slamf6+Tim-3-) or terminally exhausted (Slamf6-Tim-3+) TILs stimulated for 6h ex vivo with SIINFEKL (OVA) peptide. Representative flow plots (left) and summary (right) of one of two independent experiments, n = 3 independent wells. b, Frequency of IL-2+ progenitor exhausted or terminally exhausted TILs stimulated for 6h ex vivo with the phorbol ester PMA plusionomycin; n = 3 independent wells. c, Frequency of Ki-67+ progenitor exhausted or terminally exhausted TILs ex vivo. Representative flow plots (left) and summary (right) of one of three independent experiments, n = 8 mice. d, Frequency of BrdU+ progenitor exhausted or terminally exhausted TILs after indicated times of in vivo labeling. Representative flow plots (left) and summary (right) of one of three independent experiments, n = 4 mice. e, Dilution of the division-tracking dye CFSE by naive, progenitor exhausted or terminally exhausted CD8+ T cells stimulated ex vivo with the antibodies anti-CD3 and anti-CD28. Representative histograms (left) and summary (right) of one of two independent experiments, n = 2 wells (progenitor exh.) or n = 3 wells (terminally exh. and naive). f, Frequency of annexin V+ progenitor exhausted or terminally exhausted TILs ex vivo. Representative flow plots (left) and summary (right) of five independent mice. g, Frequency of granzyme B–positive (Gzmb+) progenitor exhausted or terminally exhausted TILs ex vivo. Representative flow plots (left) and summary (right) of one of three independent experiments, n = 4 mice. h, Frequency of surviving target cells (B16-OVA) relative to that of control cells (B2m-null B16-OVA), normalized to wells with no T cells added. One of two independent experiments shown, n = 2 independent wells per T cell to tumor cell ratio. Mean ± s.d.; two-sided Student’s t-test (a,b,d,g); two-sided paired Student’s t-test (c,f); NS, not significant (P > 0.05), *P ≤ 0.05, **P ≤ 0.01, ***P ≤ 0.001, ****P ≤ 0.0001.
Fig. 4 |
Fig. 4 |. Progenitor exhausted CD8+ T cells differentiate into terminally exhausted CD8+ T cells.
a, Longitudinal analysis of the frequency of progenitor exhausted (Tcf1+Tim-3-) and terminally exhausted (Tcf1-Tim-3+) tetramer+ CD8+ TILs in B16-OVA tumors; n = 5 mice (days 6 and 14), 4 mice (day 10) or 3 mice (day 21). b, Frequency of the most common TCRβ clonotypes in two biologic replicates of progenitor exhausted or terminally exhausted tetramer-PD-1+CD44+ CD8+ TILs from B16-OVA tumors. c, Frequency of TCRβ clonotypes shared by progenitor exhausted TILs and terminally exhausted TILs. Overlapping clonotypes are black; all others are gray. d, Experimental design for in vivo transfer assay. e, Representative flow plots (left) of the cell surface phenotype of progenitor exhausted or terminally exhausted sorted cells before transfer and in recipient mouse tumors 16d after transfer. Summary (right) of the phenotype of transferred progenitor exhausted cells or terminally exhausted cells in recipient mouse tumors from one of three independent experiments, n = 9 mice after transfer. f, Frequency of IFN-γ+, IFN-γ+TNF+ or Gzmb+ cells from sorted terminally exhausted or progenitor exhausted cells after 42 h of anti-CD3 plusanti-CD28 stimulation in vitro; n = 4 independent wells. Sorted progenitor exhausted cells gated on Slamf6+Tim-3- or Slamf6- Tim-3+ expression after culture. g,h, Summary of the phenotype of progenitor exhausted cells transferred into mice with B16 or B16-OVA tumors, gated on transferred tetramer+ (g) or tetramer- (h) cells from the recipient tumors; n = 6 mice (B16 tumor) or 10 mice (B16-OVA tumor). Mean ± s.d., two-sided Student’s t-test (a,e–h); *P ≤ 0.05, **P ≤ 0.01, ***P ≤ 0.001, ****P ≤ 0.0001.
Fig. 5 |
Fig. 5 |. Progenitor exhausted CD8+ T cells persist in the absence of antigen and mediate long-term tumor control in vivo.
a, Representative flow plots (left) and frequency (right) of transferred (CD45.2+) progenitor exhausted or terminally exhausted cells isolated from the tumors of recipient mice. Summary of two of three independent experiments, n = 17 mice. b, Experimental design for in vivo persistence and tumor-challenge assay. c, Frequency of transferred progenitor exhausted or terminally exhausted cells in spleens of recipient mice. Summary of two independent experiments, n = 13 mice. d, Frequency of transferred progenitor exhausted cells in spleens, lymph nodes (LN) or tumors of recipient mice. Summary of two independent experiments, n = 13 (spleen), 7 (lymph node) or 19 (tumor) mice. e, Experimental design for in vivo transfer assay. f, Growth curves of B16-OVA tumors after transfer of progenitor exhausted cells or terminally exhausted cells or PBS control injection on day 2. Summary of three independent experiments, n = 14 mice (PBS), 16 mice (progenitor exhausted) or 17 mice (terminally exhausted). Mean ± s.e.m. (f), mean ± s.d. (a,c,d); two-sided Student’s t-test; *P ≤ 0.05, **P ≤ 0.01, ***P ≤ 0.001, ****P ≤ 0.0001.
Fig. 6 |
Fig. 6 |. Anti-PD-1 treatment increases progenitor exhausted cell numbers and differentiation into terminally exhausted cells.
a, Growth curves of B16-OVA tumors treated with 100anti-PD-1 or isotype-matched control antibody on days 9 and 12. One of four independent experiments, n = 5 mice. b, Frequency of progenitor exhausted (Tcf1+Tim-3-) and terminally exhausted (Tcf1-Tim-3+) CD8+ T cells from B16-OVA tumors treated with isotype-matched control antibody or anti-PD-1, pre-gated on tetramer+ cells. Representative flow plots (left) and summary (right) from three independent experiments, n = 17 (control) or 15 (anti-PD-1) mice. c, Experimental design of the in vivo transfer with anti-PD-1. d, Cells per mg tumor of transferred (CD45.2+) progenitor exhausted or terminally exhausted CD8+ T cells in tumors from mice treated with isotype-matched control antibody or anti-PD-1. Summary of two independent experiments, n = 16 (progenitor exhausted) or 17 (terminally exhasuted) mice. e, Phenotype of transferred (CD45.2+) progenitor exhausted cells isolated from recipient mice treated with isotype-matched control antibody or anti-PD-1. Summary of two independent experiments, n = 17 mice. f, Principal-component analysis (PCA) of replicate samples from ATAC-seq analysis of progenitor exhausted and terminally exhausted CD8+ T cells sorted from LCMV-infected mice or B16-OVA tumors treated with isotype-matched control antibody or anti-PD-1, as indicated. Mean ± s.e.m. (a), mean ± s.d. (b,d,e); two-sided Student’s t-test; *P ≤ 0.05, **P ≤ 0.01, ***P ≤ 0.001.
Fig. 7 |
Fig. 7 |. Increased fraction of progenitor exhausted CD8+ T cells is associated with duration of response to checkpoint blockade in patients with advanced melanoma.
a, Classification of patients with stage III–IV melanoma from whom pre-treatment biopsies were obtained. b, Multiplex immunofluorescence image of representative progenitor exhausted cells (yellow arrowheads), identified as TCF1+PD-1+CD8+SOX10- cells. c, Frequency of TCF1+ cells among PD-1+CD8+ cells in patients with durable clinical benefit (responders, n = 14) or no clinical benefit (non-responders, n = 11). d, Frequency of progenitor exhausted cells in all activated/exhausted cells plotted against PFS (duration, in days) in patients with durable clinical benefit (responders, n = 14). Linear regression line shown. e,f, Kaplan–Meier curves of PFS in responders (n = 14) by high versus low percentage of total CD8+ T cells among all nucleated cells (e, cutoff at median 7.6%) or by percentage of progenitor exhausted cells (TCF1+) in all activated/exhausted PD-1+CD8+ T cells (f, cutoff at median 14.9%). Mean ± s.d. (c); two-sided Student’s t-test (c); two-sided likelihood ratio test (e,f).

Comment in

  • States of exhaustion.
    Harjes U. Harjes U. Nat Rev Cancer. 2019 Apr;19(4):185. doi: 10.1038/s41568-019-0129-5. Nat Rev Cancer. 2019. PMID: 30846872 No abstract available.

Similar articles

Cited by

References

    1. Thommen DS & Schumacher TN T cell dysfunction in cancer. Cancer Cell. 33, 547–562 (2018). - PMC - PubMed
    1. Ahmadzadeh M et al. Tumor antigen-specific CD8 T cells infiltrating the tumor express high levels of PD-1 and are functionally impaired. Blood 114, 1537–1544 (2009). - PMC - PubMed
    1. Zajac AJ et al. Viral immune evasion due to persistence of activated T cells without effector function. J. Exp. Med. 188, 2205–2213 (1998). - PMC - PubMed
    1. Moskophidis D, Lechner F, Pircher H & Zinkernagel RM Virus persistence in acutely infected immunocompetent mice by exhaustion of antiviral cytotoxic effector T cells. Nature 362, 758–761 (1993). - PubMed
    1. Wherry EJ T cell exhaustion. Nat. Immunol. 12, 492–499 (2011). - PubMed

Publication types

MeSH terms

Substances