. 2019 May 7;139(19):2238-2255.
doi: 10.1161/CIRCULATIONAHA.118.035889.

BOLA (BolA Family Member 3) Deficiency Controls Endothelial Metabolism and Glycine Homeostasis in Pulmonary Hypertension

Affiliations

BOLA (BolA Family Member 3) Deficiency Controls Endothelial Metabolism and Glycine Homeostasis in Pulmonary Hypertension

Qiujun Yu et al. Circulation. .

Abstract

Background: Deficiencies of iron-sulfur (Fe-S) clusters, metal complexes that control redox state and mitochondrial metabolism, have been linked to pulmonary hypertension (PH), a deadly vascular disease with poorly defined molecular origins. BOLA3 (BolA Family Member 3) regulates Fe-S biogenesis, and mutations in BOLA3 result in multiple mitochondrial dysfunction syndrome, a fatal disorder associated with PH. The mechanistic role of BOLA3 in PH remains undefined.

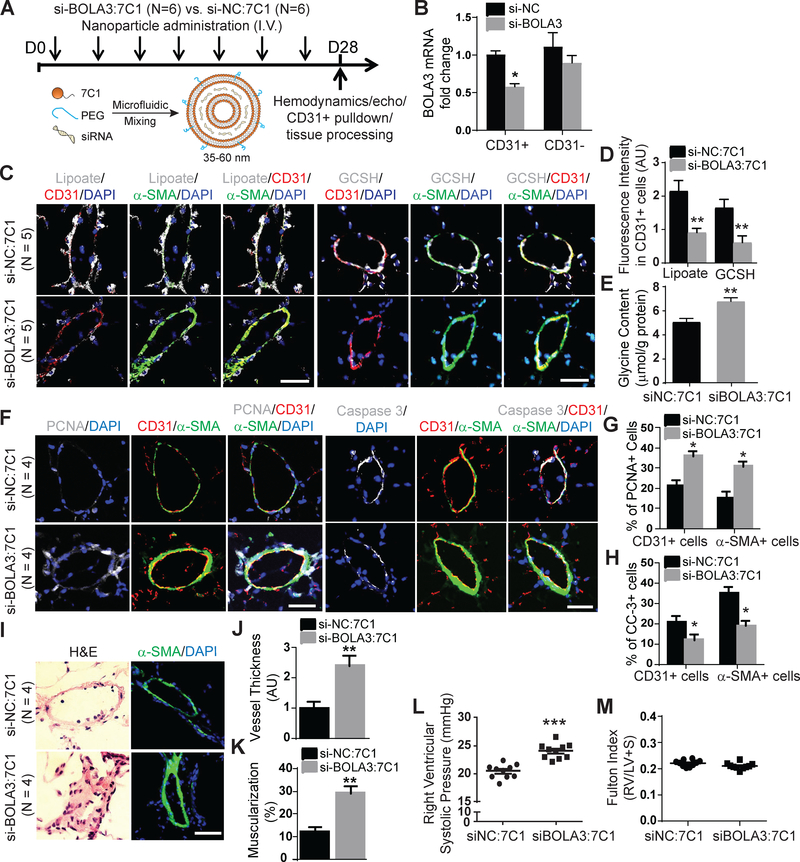
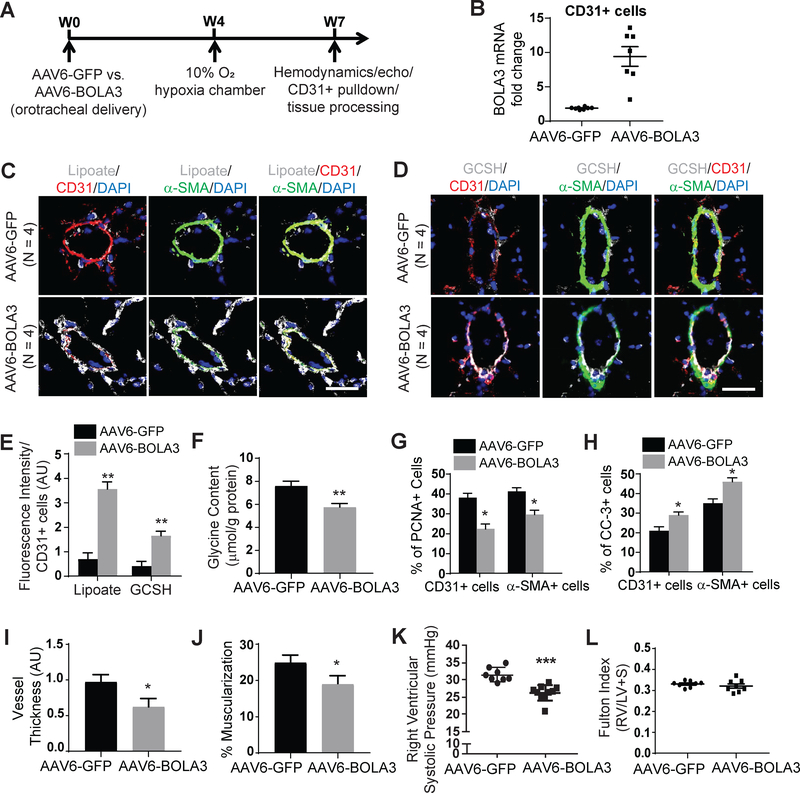
Methods: In vitro assessment of BOLA3 regulation and gain- and loss-of-function assays were performed in human pulmonary artery endothelial cells using siRNA and lentiviral vectors expressing the mitochondrial isoform of BOLA3. Polymeric nanoparticle 7C1 was used for lung endothelium-specific delivery of BOLA3 siRNA oligonucleotides in mice. Overexpression of pulmonary vascular BOLA3 was performed by orotracheal transgene delivery of adeno-associated virus in mouse models of PH.

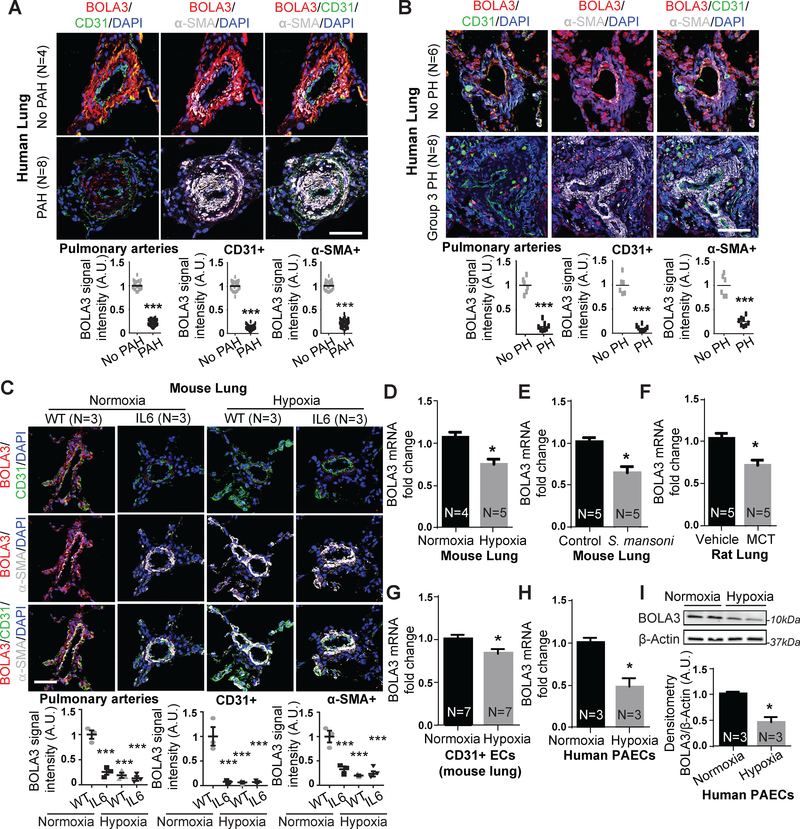
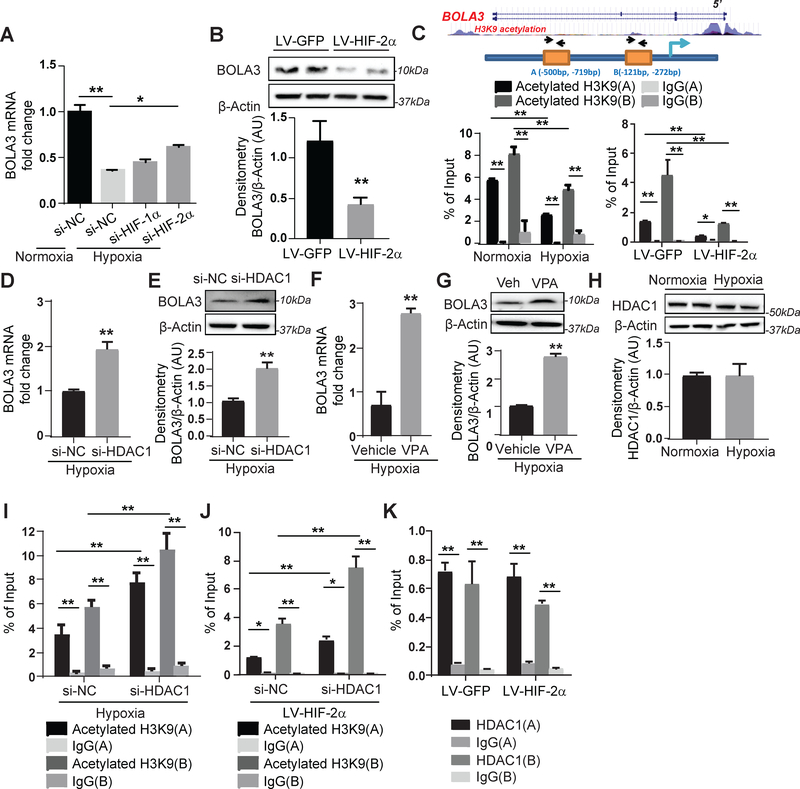
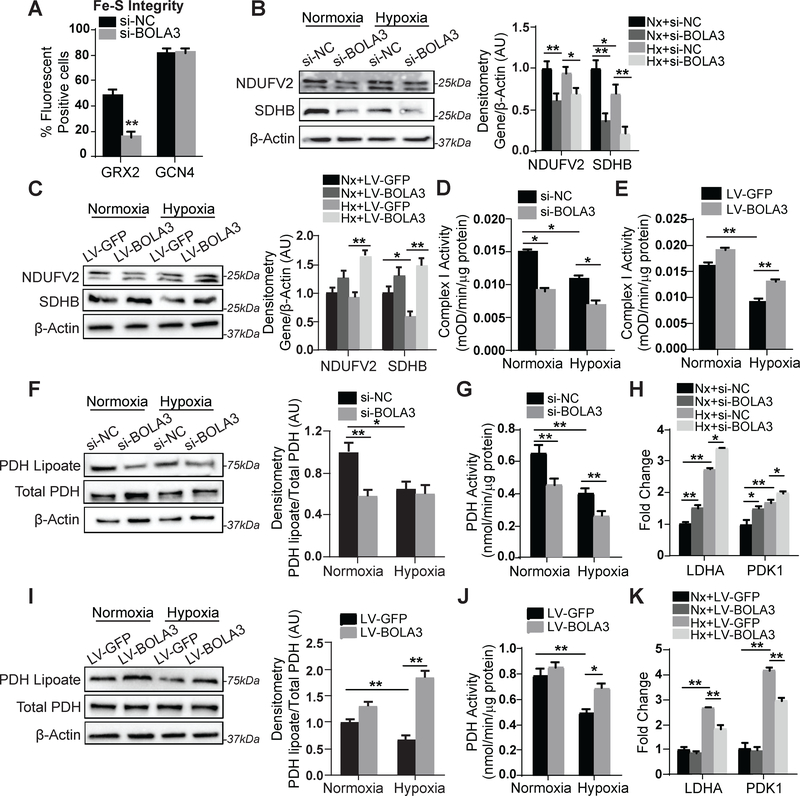
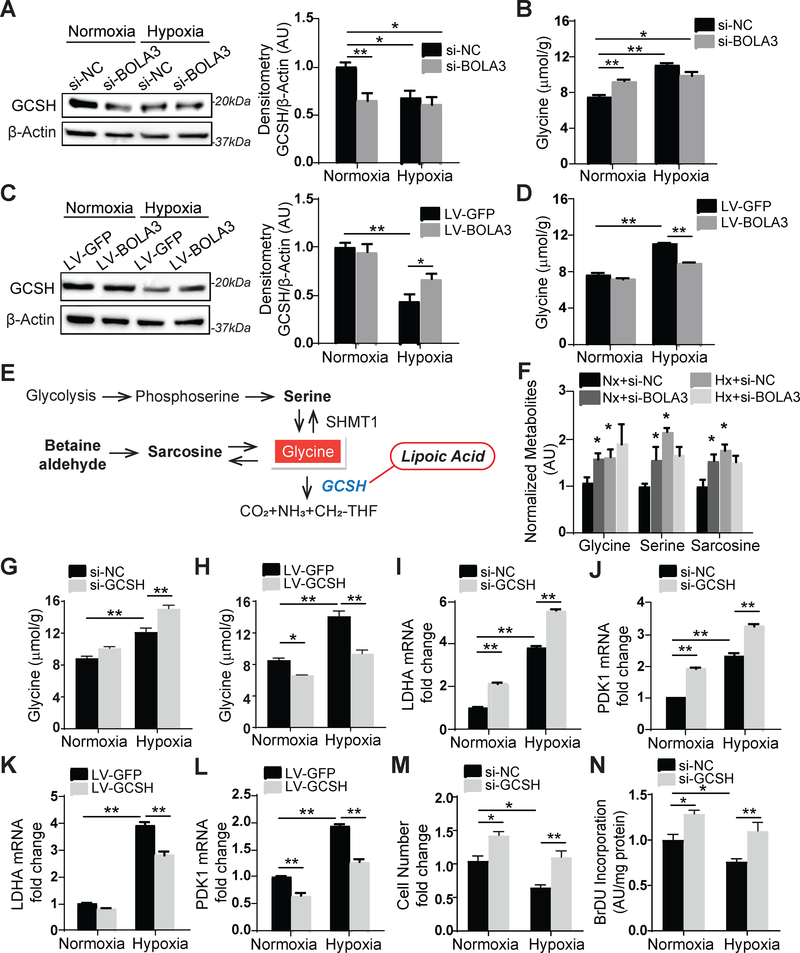
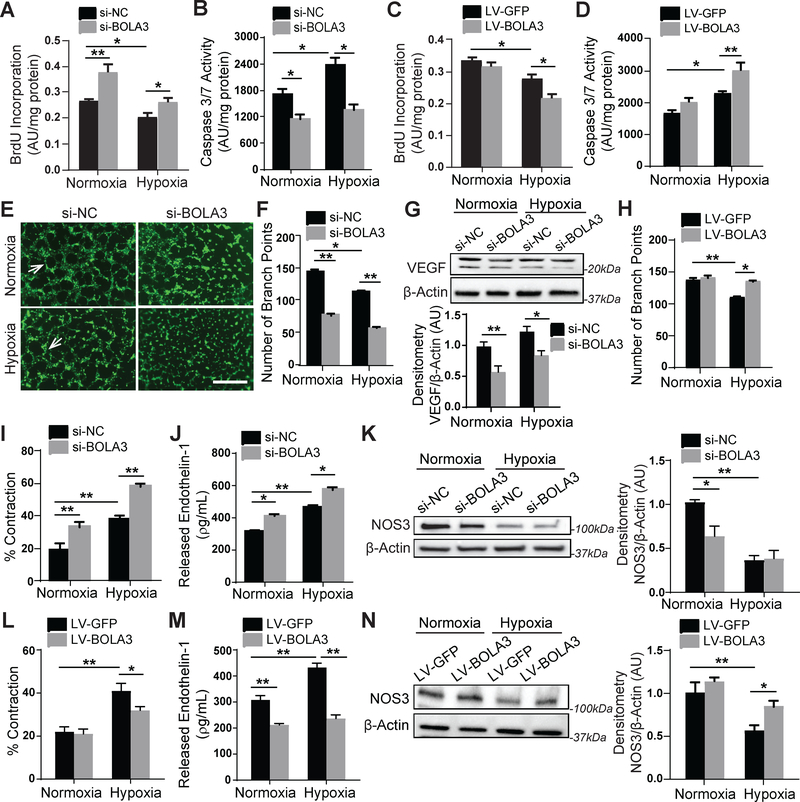
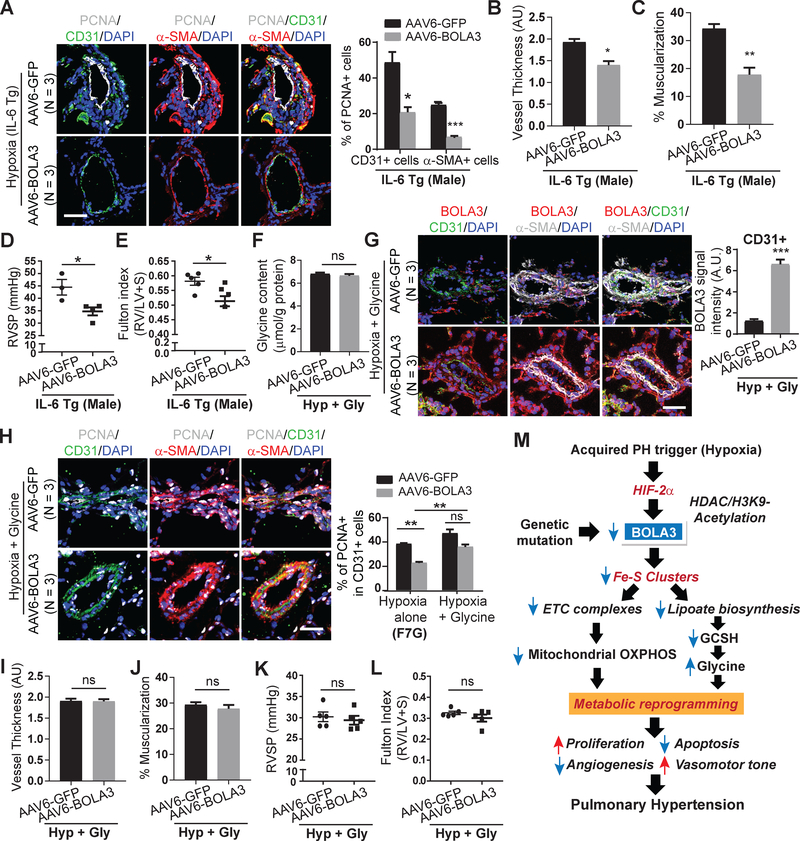
Results: In cultured hypoxic pulmonary artery endothelial cells, lung from human patients with Group 1 and 3 PH, and multiple rodent models of PH, endothelial BOLA3 expression was downregulated, which involved hypoxia inducible factor-2α-dependent transcriptional repression via histone deacetylase 1-mediated histone deacetylation. In vitro gain- and loss-of-function studies demonstrated that BOLA3 regulated Fe-S integrity, thus modulating lipoate-containing 2-oxoacid dehydrogenases with consequent control over glycolysis and mitochondrial respiration. In contexts of siRNA knockdown and naturally occurring human genetic mutation, cellular BOLA3 deficiency downregulated the glycine cleavage system protein H, thus bolstering intracellular glycine content. In the setting of these alterations of oxidative metabolism and glycine levels, BOLA3 deficiency increased endothelial proliferation, survival, and vasoconstriction while decreasing angiogenic potential. In vivo, pharmacological knockdown of endothelial BOLA3 and targeted overexpression of BOLA3 in mice demonstrated that BOLA3 deficiency promotes histological and hemodynamic manifestations of PH. Notably, the therapeutic effects of BOLA3 expression were reversed by exogenous glycine supplementation.

Conclusions: BOLA3 acts as a crucial lynchpin connecting Fe-S-dependent oxidative respiration and glycine homeostasis with endothelial metabolic reprogramming critical to PH pathogenesis. These results provide a molecular explanation for the clinical associations linking PH with hyperglycinemic syndromes and mitochondrial disorders. These findings also identify novel metabolic targets, including those involved in epigenetics, Fe-S biogenesis, and glycine biology, for diagnostic and therapeutic development.

Keywords: endothelium; glycine; hypertension, pulmonary; mitochondria.


Conflict of interest statement

Disclosures

S.Y.C. has served as a consultant for Zogenix (Significant) and Vivus (Modest) and holds research grants for Pfizer and Actelion. The authors declare no other conflicts of interest.

Figures

Figure 1:
Figure 1:. Down-regulation of BOLA3 across multiple in vitro and in vivo models of PH.
(A-C) Fluorescence microscopy of human lung from Group 1 PAH (A) and Group 3 PH (B) vs. non-PH patients; interleukin-6 (IL-6) transgenic mice (without or without hypoxia); and hypoxic wildtype (WT) mice (C) revealed reduced BOLA3 expression in endothelium (CD31 label) and smooth muscle (α-SMA label). Scale bar: 50μm. (D-G) By RT-qPCR, BOLA3 transcript expression was decreased in lung from hypoxic PH mice (10% O2) (D), PH mice infected with S. mansoni (E), and monocrotaline (MCT)-exposed PH rats (F). (G) Similarly, BOLA3 transcript expression was decreased in CD31-positive pulmonary endothelial cells (ECs) isolated from chronically hypoxic PH mice. (H-I) By RT-qPCR and immunoblotting respectively, BOLA3 was decreased at the transcript (H) and protein (I) levels in cultured hypoxic human pulmonary arterial endothelial cells (PAECs). In (I), representative immunoblot is shown with densitometry calculated across 3 separate replicates. In all panels, mean expression in controls (no PAH, no PH, WT, vehicle, control, normoxia) was normalized to a fold change of 1, to which relevant samples were compared (N = 3–8/group). Data represent the mean ± SEM (*P < 0.05, ***P < 0.001).
Figure 2:
Figure 2:. Hypoxia mediates transcriptional repression of BOLA3 via HIF-2α/HDAC/histone acetylation pathway.
(A) Transfection of siRNA targeting hypoxia induced factor (HIF)-2α, but not HIF-1α, partially rescued BOLA3 expression in hypoxic human PAECs. (B) Lentivirus (LV)-mediated forced expression of a constitutively active HIF-2α in PAECs inhibited BOLA3. (C) ChIP-qPCR via immunoprecipitation of acetylated histone 3 lysine 9 (H3K9) and PCR detection of BOLA3 promoter sites indicated acetylated H3K9 enrichment of the BOLA3 promoter (sites A, B), which was decreased by hypoxia (left) or constitutive HIF-2α (right). (D-G) siRNA knockdown of histone deacetylase 1 (HDAC1) as well as valproic acid (VPA, 3mM), a HDAC inhibitor, both rescued BOLA3 transcript and protein expression in hypoxic PAECs. (H) Expression of HDAC1 remained unchanged in hypoxic PAECs. (I-J) siRNA knockdown of HDAC1 enhanced enrichment of H3K9 acetylation at the BOLA3 promotor in hypoxia (I) or with constitutive HIF-2α expression (J). (K) ChIP-qPCR via immunoprecipitation of HDAC1 indicated HDAC1 enrichment at BOLA3 promoter sites that was not altered with constitutive HIF-2α expression. In all panels measuring fold change, mean expression in control groups (si-NC, LV-GFP, normoxia, vehicle) was normalized to fold change of 1, to which relevant samples were compared (N = 3/group). Data represent the mean ± SEM (*P < 0.05, **P < 0.01).
Figure 3:
Figure 3:. BOLA3 controls Fe-S integrity and mitochondrial complex activity as well as mitochondrial lipoate-containing 2-oxoacid dehydrogenases.
(A) Knockdown of BOLA3 to PAECs compromised Fe-S integrity, as assessed by lentiviral delivery of Fe-S-dependent (glutaredoxin 2, GRX2) vs. Fe-S-independent (GCN4) fluorescent sensors. (B) By immunoblot and densitometry, expression of NDUFV2 (doublet band) and SDHB, representative mitochondrial Complex I and II components respectively, was decreased by BOLA3 knockdown in normoxia (Nx) and hypoxia (Hx); however, hypoxia alone did not robustly alter their expression. (C) Conversely, forced lentiviral expression of BOLA3 compared with GFP control increased NDUFV2 and SDHB expression in normoxia and hypoxia. (D-E) In PAECs, hypoxia-dependent Fe-S-dependent Complex I activity was down-regulated by BOLA3 knockdown (D) and conversely rescued by forced BOLA3 expression (E). (F) PAEC expression of lipoate-containing pyruvate dehydrogenase (PDH) was decreased by BOLA3 knockdown in normoxia and was phenocopied by hypoxic exposure. (G) In correlation, PDH activity was decreased by BOLA3 knockdown in normoxia and by hypoxic exposure; BOLA3 knockdown in combination with hypoxia further decreased PDH activity. (H) In the setting of increased lactate dehydrogenase (LDHA) and pyruvate dehydrogenase kinase 1 (PDK1) expression in hypoxia, by RT-qPCR, BOLA3 knockdown in PAECs increased LDHA and PDK1 in normoxia and hypoxia. (I-J) Conversely, BOLA3 overexpression increased lipoate-containing PDH (I) and increased PDH activity in normoxia and hypoxia (J). (K) BOLA3 overexpression blunted the upregulation of LDHA and PDK1 specifically in hypoxia. In all panels, mean expression of control groups (si-NC, Nx+si-NC, Nx+LV-GFP) was normalized to fold change of 1, to which all relevant samples were compared (N = 3/group). Data represent the mean ± SEM (*P < 0.05, **P < 0.01).
Figure 4.
Figure 4.. BOLA3 deficiency modulates glycine metabolism by inhibiting GCSH in PAECs.
(A) Via immunoblot and densitometry, in PAECs, BOLA3 knockdown inhibited glycine cleavage system H protein (GCSH) in normoxia, thus phenocopying hypoxia alone. (B) BOLA3 knockdown in normoxia promoted intracellular glycine accumulation, again similar to hypoxia. (C-D) Conversely, in hypoxia, forced BOLA3 expression reversed the reduction of GCSH (C) and blunted consequent glycine accumulation (D). (E-F) By mass spectrometry, BOLA3 knockdown in normoxia (Nx) phenocopied hypoxia (Hx) by increasing accumulation of glycine as well as its relevant metabolites, serine and sarcosine (F), as predicted by known metabolic schema (E). (G-H) GCSH knockdown augmented glycine accumulation particularly in hypoxia, while forced expression of GCSH reversed the accumulation of glycine in hypoxia. (I-L) GCSH knockdown further enhanced LDHA (I) and PDK1 (J) expression in hypoxia, which was reversed by GCSH overexpression (K, L). (M-N) GCSH knockdown increased PAECs proliferation, as measured by cell number count (M) and BrdU incorporation (N). In all panels, mean expression of control groups (Nx si-NC, Nx LV-GFP) was normalized to fold change of 1, to which relevant samples were compared (N = 3/group). Data represent the mean ± SEM (*P < 0.05, **P < 0.01).
Figure 5:
Figure 5:. BOLA3 deficiency increases proliferation, inhibits apoptosis and angiogenesis, and promotes vasoconstriction in PAECs.
(A-B) As reflected by BrdU incorporation and apoptotic caspase 3/7 activation, BOLA3 knockdown increased PAEC proliferation and reduced apoptosis in both normoxia and hypoxia. (C-D) Conversely, forced BOLA3 expression inhibited proliferation and promoted apoptotic signaling in hypoxia. (E-F) BOLA3 knockdown inhibited in vitro angiogenic potential, as measured by tube formation in matrix gel in normoxia and hypoxia (E), white arrows indicate representative full tubes and branch point quantification (F). Scale bar, 200μm. (G) BOLA3 knockdown down-regulated vascular endothelial growth factor (VEGF) as assessed by immunoblot. (H) Conversely, forced BOLA3 expression increased in vitro tube formation in hypoxic PAECs. (I) As quantified by a gel matrix contraction assay encompassing the exposure of PASMCs in gel matrix to conditioned serum-free medium from PAECs, knockdown of BOLA3 in PAECs produced conditioned media that increased PASMC contraction in normoxia and hypoxia. (J) As quantified by ELISA, BOLA3 knockdown increased secreted endothelin-1 (ET-1) production in normoxia and hypoxia. (K) As assessed by immunoblot and densitometry, BOLA3 knockdown in normoxia inhibited nitric oxide synthase 3 (NOS3) expression, at least partially phenocopying the more robust downregulation in hypoxia. (L) Conditioned serum-free medium from PAECs constitutively expressing BOLA3 transgene blunted the hypoxic induction of PASMC contraction in matrix gel. (M) Forced BOLA3 expression inhibited ET-1 release in normoxia and hypoxia. (N) More evident in hypoxia, constitutive BOLA3 transgene expression rescued NOS3 expression. In panels G, K, and N, mean expression of control group (Nx si-NC or Nx LV-GFP) was normalized to fold change of 1, to which relevant samples were compared. For all panels, N = 3–6 replicates/group. Data represent the mean ± SEM (*P < 0.05, **P < 0.01).
Figure 6:
Figure 6:. Endothelial-specific delivery of BOLA3 siRNA dysregulates lipoate synthesis and glycine metabolism, thus promoting PH.
(A) Wildtype C57Bl6 mice received intravenous injections of either si-BOLA3:7C1 or si-NC:7C1 nanoparticles every 4 days for 28 days to target vascular endothelium of mice. (B) Pulmonary vascular delivery of si-BOLA3: 7C1 nanoparticles reduced BOLA3 RNA expression in isolated CD31+ pulmonary endothelial cells, but not in CD31- pulmonary cells (N = 4/group). (C-E) 7C1:si-BOLA3 reduced lipoate (white, left 3 columns) and GCSH (white, right 3 columns) expression by in situ fluorescence microscopy and increased glycine content by fluorometric assay in mouse lung tissues. (F-H) 7C1:si-BOLA3 increased the proliferation marker PCNA but inhibited the apoptotic marker cleaved caspase 3 (CC-3) in both CD31+ endothelial and α-SMA+ cells in mouse vasculature. (I-K) si-BOLA3:7C1 increased pulmonary vessel thickness (J) and muscularization (K) as assessed by hematoxylin and eosin staining (left column, I) as well as α-SMA staining (green, right column, I). (L-M) 7C1:si-BOLA3 elevated right ventricular systolic pressure measured by right heart catheterization but did not affect right ventricular hypertrophy (Fulton index, RV/LV+S), N = 10 mice/group. In panel B, mean expression of control group (si-NC) was normalized to fold change of 1, to which relevant samples were compared. Data represent the mean ± SEM. (*P < 0.05, **P < 0.01, ***P<0.001). Scale bars, 50μm.
Figure 7:
Figure 7:. Forced expression of pulmonary vascular BOLA3 prevents PH in mice.
(A) As diagrammed, either AAV6-GFP or AAV6- BOLA3 was administered to wildtype C57Bl6 mice via an orotracheal route 4 weeks prior to hypoxic exposure for 3 weeks. (B) As assessed by RT-qPCR, AAV6-BOLA3 increased BOLA3 transcript levels in CD31+ endothelial cells harvested from mouse lung. (C-E) As assessed by fluorescent microscopy, AAV6-BOLA3 increased lipoate (white, C) and GCSH (white, D) expression particularly in CD31+ endothelial cells (E). (F) AAV6-BOLA3 delivery also decreased whole lung glycine content, as quantified by fluorometric assay. (G-H) As assessed by fluorescent microscopy, AAV6-BOLA3 reduced PCNA (G) but enhanced cleaved caspase 3 (CC-3) expression (H) in both CD31+ and α-SMA+ cells in mouse pulmonary vessels. (I-J) AAV6-BOLA3 reduced pulmonary vessel thickness and muscularization, as assessed by hematoxylin and eosin as well as α-SMA staining. (K-L) AAV6-BOLA3 reduced right ventricular systolic pressure as measured by right heart catheterization but did not affect right ventricular hypertrophy (Fulton index, RV/LV+S). In panel B, mean expression of control group (AAV6-GFP) was normalized to fold change of 1, to which relevant samples were compared. Data represent the mean ± SEM (*P < 0.05, **P < 0.01, ***P < 0.001). Scale bars, 50μm. In these experiments, unless indicated otherwise, N = 8–10 mice/group.
Figure 8:
Figure 8:. The therapeutic effects of BOLA3 in PH are reversed by a hyperglycinemic state.
(A) Similar to hypoxic wildtype mice, AAV6-BOLA3 reduced PCNA in CD31+ and α-SMA+ cells in pulmonary vessels of hypoxic IL-6 transgenic (IL-6 Tg mice). (B-C) In IL-6 Tg mice, AAV6-BOLA3 reduced pulmonary vessel remodeling. (D-E) In IL-6 Tg mice, AAV6-BOLA3 reduced right ventricular systolic pressure (RVSP) (D) and Fulton index (E). (F-G) In hypoxic wildtype mice, as quantified by fluorometric assay, exogenous glycine prevented the ability of AAV6-BOLA3 to decrease lung glycine (F), despite induction of BOLA3 in the pulmonary vasculature (G). (H) Glycine maintained elevated PCNA in pulmonary vascular CD31+ endothelial cells in hypoxic mice, despite BOLA3 expression. (I-L) Glycine prevented AAV6-BOLA3 from reducing pulmonary vessel remodeling (I-J) and from decreasing RVSP (K) or Fulton index (L) in hypoxic mice. Scale bars, 50μm; N = 3–5 mice per group. Data represent mean ± SEM (NS, P > 0.05, *P < 0.05, **P < 0.01, ***P < 0.001). (M) Model of BOLA3 deficiency in PH. BOLA3 is down-regulated genetically or epigenetically by hypoxia, decreasing [Fe-S] clusters and controlling electron transport and oxidative phosphorylation (OXPHOS). BOLA3 deficiency decreases lipoate biosynthesis, reducing the activity of 2-oxoacid dehydrogenases and further disrupting OXPHOS. Deficient lipoate biosynthesis also impairs glycine cleavage which promotes glycine retention and proliferation. This metabolic shift drives a proliferative, vasoconstricted vascular state, which predisposes to PH in vivo.

Comment in

Similar articles

Cited by

References

    1. Chan SY and Rubin LJ. Metabolic dysfunction in pulmonary hypertension: From basic science to clinical practice Eur Respir Rev. 2017; 26:170094. - PMC - PubMed
    1. Chan SY, Zhang YY, Hemann C, Mahoney CE, Zweier JL and Loscalzo J. MicroRNA-210 controls mitochondrial metabolism during hypoxia by repressing the iron-sulfur cluster assembly proteins ISCU½. Cell Metab. 2009; 10:273–284. - PMC - PubMed
    1. Rouault TA. Biogenesis of iron-sulfur clusters in mammalian cells: new insights and relevance to human disease. Dis Model Mech. 2012; 5:155–164. - PMC - PubMed
    1. White K, Lu Y, Annis S, Hale AE, Chau BN, Dahlman JE, Hemann C, Opotowsky AR, Vargas SO, Rosas I, Perrella MA, Osorio JC, Haley KJ, Graham BB, Kumar R, Saggar R, Saggar R, Wallace WD, Ross DJ, Khan OF, Bader A, Gochuico BR, Matar M, Polach K, Johannessen NM, Prosser HM, Anderson DG, Langer R, Zweier JL, Bindoff LA, Systrom D, Waxman AB, Jin RC and Chan SY. Genetic and hypoxic alterations of the microRNA-210-ISCU½ axis promote iron-sulfur deficiency and pulmonary hypertension. EMBO Mol Med. 2015; 7:695–713. - PMC - PubMed
    1. Cameron JM, Janer A, Levandovskiy V, Mackay N, Rouault TA, Tong WH, Ogilvie I, Shoubridge EA and Robinson BH. Mutations in iron-sulfur cluster scaffold genes NFU1 and BOLA3 cause a fatal deficiency of multiple respiratory chain and 2-oxoacid dehydrogenase enzymes. Am J Hum Genet. 2011; 89:486–495. - PMC - PubMed

Publication types

MeSH terms