

Faecal bacterial and short-chain fatty acids signature in hypercholesterolemia
- PMID: 30742005
- PMCID: PMC6370822
- DOI: 10.1038/s41598-019-38874-3
Faecal bacterial and short-chain fatty acids signature in hypercholesterolemia
Abstract
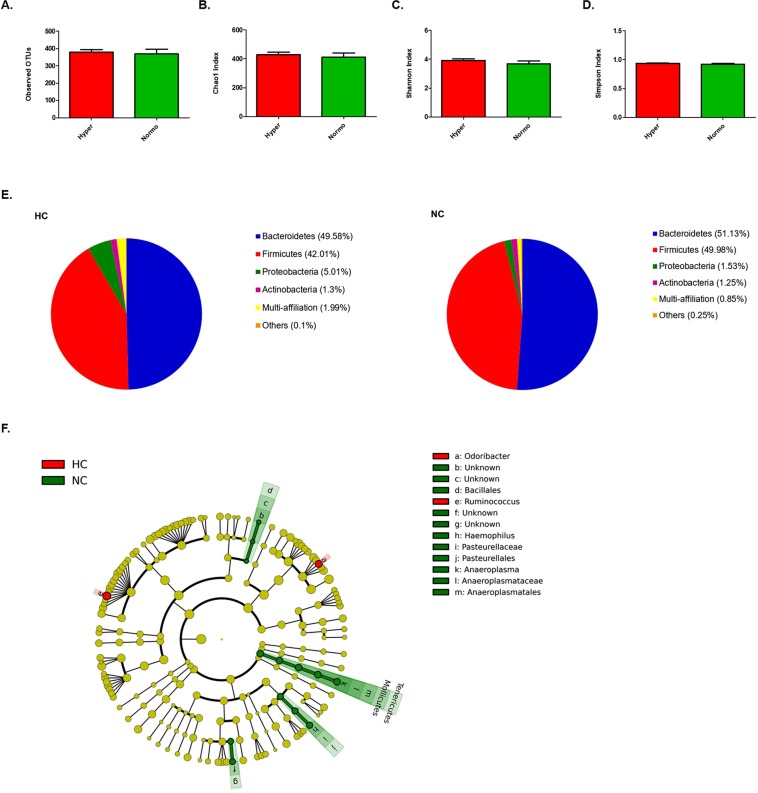
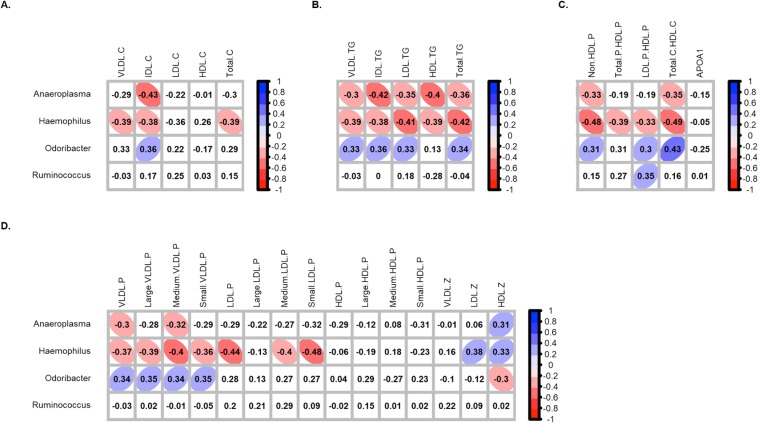
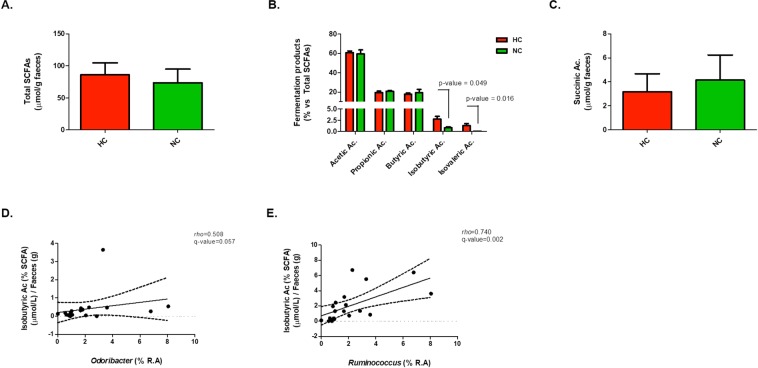
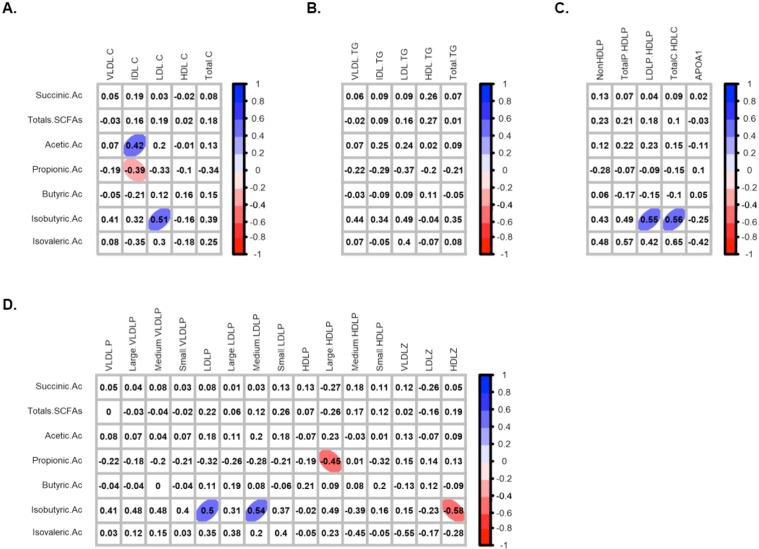
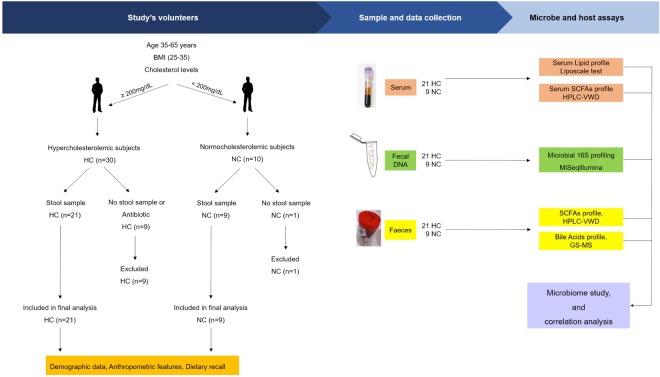
Gut microbiota has been suggested to affect lipid metabolism. The objective of this study was to characterize the faecal microbiota signature and both short chain fatty acids (SCFAs) and bile acids (BA) profile of hypercholesterolemic subjects. Microbiota composition, SCFAs, BA and blood lipid profile from male volunteers with hypercholesterolemia (HC) and normocholesterolemia (NC) were determined by 16S rDNA sequencing, HPLC, GC and NMR, respectively. HC subjects were characterized by having lower relative abundance of Anaeroplasma (0.002% vs 0.219%, p-value = 0.026) and Haemophilus (0.041% vs 0.078%, p-value = 0.049), and higher of Odoribacter (0.51% vs 0.16%; p-value = 0.044). Correlation analysis revealed that Anaeroplasma and Haemophilus were associated to an unfavourable lipid profile: they correlated negatively to cholesterol and triglycerides related biomarkers and the ratio total to high density lipoprotein (HDL) cholesterol, and positively to HDL size. Odoribacter displayed an opposite behaviour. Faecal SCFAs profile revealed higher abundance of isobutyric (2.76% vs 0.82%, p-value = 0.049) and isovaleric acid (1.32% vs 0.06%, p-value = 0.016) in HC. Isobutyric acid correlated positively with Odoribacter and lipid parameters indicative of an unfavourable profile. BA profile did not show differences between groups. It was concluded that HC subjects showed a particular faecal bacterial signature and SCFAs profile associated with their lipid profile.
Conflict of interest statement
The authors declare no competing interests.
Figures
Similar articles
-
Evaluation and comparison of short chain fatty acids composition in gut diseases.World J Gastroenterol. 2019 Sep 28;25(36):5543-5558. doi: 10.3748/wjg.v25.i36.5543. World J Gastroenterol. 2019. PMID: 31576099 Free PMC article.
-
The Prebiotic Effects of Oats on Blood Lipids, Gut Microbiota, and Short-Chain Fatty Acids in Mildly Hypercholesterolemic Subjects Compared With Rice: A Randomized, Controlled Trial.Front Immunol. 2021 Dec 9;12:787797. doi: 10.3389/fimmu.2021.787797. eCollection 2021. Front Immunol. 2021. PMID: 34956218 Free PMC article. Clinical Trial.
-
Association of short-chain fatty acids and the gut microbiome with type 2 diabetes: Evidence from the Henan Rural Cohort.Nutr Metab Cardiovasc Dis. 2024 Jul;34(7):1619-1630. doi: 10.1016/j.numecd.2024.03.014. Epub 2024 Mar 13. Nutr Metab Cardiovasc Dis. 2024. PMID: 38653672
-
Changes in microbiota composition, bile and fatty acid metabolism, in successful faecal microbiota transplantation for Clostridioides difficile infection.BMC Gastroenterol. 2018 Aug 28;18(1):131. doi: 10.1186/s12876-018-0860-5. BMC Gastroenterol. 2018. PMID: 30153805 Free PMC article.
-
Short-Chain Fatty Acids-A Product of the Microbiome and Its Participation in Two-Way Communication on the Microbiome-Host Mammal Line.Curr Obes Rep. 2023 Jun;12(2):108-126. doi: 10.1007/s13679-023-00503-6. Epub 2023 May 19. Curr Obes Rep. 2023. PMID: 37208544 Free PMC article. Review.
Cited by
-
Effect of milk replacer allowance on calf faecal bacterial community profiles and fermentation.Anim Microbiome. 2021 Apr 1;3(1):27. doi: 10.1186/s42523-021-00088-2. Anim Microbiome. 2021. PMID: 33795026 Free PMC article.
-
Antioxidant Vitamins and Prebiotic FOS and XOS Differentially Shift Microbiota Composition and Function and Improve Intestinal Epithelial Barrier In Vitro.Nutrients. 2021 Mar 29;13(4):1125. doi: 10.3390/nu13041125. Nutrients. 2021. PMID: 33805552 Free PMC article. Clinical Trial.
-
Role of Gut Microbiota in Neuroendocrine Regulation of Carbohydrate and Lipid Metabolism via the Microbiota-Gut-Brain-Liver Axis.Microorganisms. 2020 Apr 7;8(4):527. doi: 10.3390/microorganisms8040527. Microorganisms. 2020. PMID: 32272588 Free PMC article. Review.
-
Circulating Short-Chain Fatty Acids and Non-Alcoholic Fatty Liver Disease Severity in Patients with Type 2 Diabetes Mellitus.Nutrients. 2023 Mar 31;15(7):1712. doi: 10.3390/nu15071712. Nutrients. 2023. PMID: 37049552 Free PMC article.
-
Faecal biomarkers in type 1 diabetes with and without diabetic nephropathy.Sci Rep. 2021 Jul 26;11(1):15208. doi: 10.1038/s41598-021-94747-8. Sci Rep. 2021. PMID: 34312454 Free PMC article.
References
-
- Mendis, S., Puska, P. & Norrving, B. Global Atlas On Cardiovascular Disease Prevention And Control. (ed. Mendis, S., Puska, P. & Norrving, B.) 1–164 (Geneva: World Health Organization in collaboration with the World Heart Federation and the World Stroke Organization, 2011).
-
- Millan Nuñez-Cortes J, et al. Documento Abordaje de la dislipidemia. Sociedad Española deArteriosclerosis (parte III) Clin. e Investig. en Arterioscler. 2012;24:102–107. doi: 10.1016/j.arteri.2011.09.004. - DOI
Publication types
MeSH terms
Substances
LinkOut - more resources
Full Text Sources
Other Literature Sources
Medical
Miscellaneous
