Structural basis of cooling agent and lipid sensing by the cold-activated TRPM8 channel
- PMID: 30733385
- PMCID: PMC6478609
- DOI: 10.1126/science.aav9334
Structural basis of cooling agent and lipid sensing by the cold-activated TRPM8 channel
Abstract
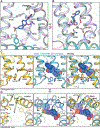
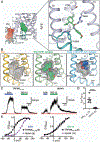
Transient receptor potential melastatin member 8 (TRPM8) is a calcium ion (Ca2+)-permeable cation channel that serves as the primary cold and menthol sensor in humans. Activation of TRPM8 by cooling compounds relies on allosteric actions of agonist and membrane lipid phosphatidylinositol 4,5-bisphosphate (PIP2), but lack of structural information has thus far precluded a mechanistic understanding of ligand and lipid sensing by TRPM8. Using cryo-electron microscopy, we determined the structures of TRPM8 in complex with the synthetic cooling compound icilin, PIP2, and Ca2+, as well as in complex with the menthol analog WS-12 and PIP2 Our structures reveal the binding sites for cooling agonists and PIP2 in TRPM8. Notably, PIP2 binds to TRPM8 in two different modes, which illustrate the mechanism of allosteric coupling between PIP2 and agonists. This study provides a platform for understanding the molecular mechanism of TRPM8 activation by cooling agents.
Copyright © 2019 The Authors, some rights reserved; exclusive licensee American Association for the Advancement of Science. No claim to original U.S. Government Works.
Conflict of interest statement
Figures


Comment in
-
Frozen images of a cool channel with icy compounds.Cell Calcium. 2019 Jun;80:189-191. doi: 10.1016/j.ceca.2019.04.007. Epub 2019 May 2. Cell Calcium. 2019. PMID: 31104783 No abstract available.
Similar articles
-
Activation mechanism of the mouse cold-sensing TRPM8 channel by cooling agonist and PIP2.Science. 2022 Oct 14;378(6616):eadd1268. doi: 10.1126/science.add1268. Epub 2022 Oct 14. Science. 2022. PMID: 36227998 Free PMC article.
-
Current View of Ligand and Lipid Recognition by the Menthol Receptor TRPM8.Trends Biochem Sci. 2020 Sep;45(9):806-819. doi: 10.1016/j.tibs.2020.05.008. Epub 2020 Jun 9. Trends Biochem Sci. 2020. PMID: 32532587 Free PMC article. Review.
-
Gating of transient receptor potential melastatin 8 (TRPM8) channels activated by cold and chemical agonists in planar lipid bilayers.J Neurosci. 2010 Sep 15;30(37):12526-34. doi: 10.1523/JNEUROSCI.3189-10.2010. J Neurosci. 2010. PMID: 20844147 Free PMC article.
-
Structures of a mammalian TRPM8 in closed state.Nat Commun. 2022 Jun 3;13(1):3113. doi: 10.1038/s41467-022-30919-y. Nat Commun. 2022. PMID: 35662242 Free PMC article.
-
Regulation of the cold-sensing TRPM8 channels by phosphoinositides and Gq-coupled receptors.Channels (Austin). 2020 Dec;14(1):79-86. doi: 10.1080/19336950.2020.1734266. Channels (Austin). 2020. PMID: 32101066 Free PMC article. Review.
Cited by
-
Experimental Pharmacotherapy for Dry Eye Disease: A Review.J Exp Pharmacol. 2021 Mar 23;13:345-358. doi: 10.2147/JEP.S237487. eCollection 2021. J Exp Pharmacol. 2021. PMID: 33790661 Free PMC article. Review.
-
Differential Activation of TRPM8 by the Stereoisomers of Menthol.Front Pharmacol. 2022 Jun 21;13:898670. doi: 10.3389/fphar.2022.898670. eCollection 2022. Front Pharmacol. 2022. PMID: 35800442 Free PMC article.
-
Sequence and structural conservation reveal fingerprint residues in TRP channels.Elife. 2022 Jun 10;11:e73645. doi: 10.7554/eLife.73645. Elife. 2022. PMID: 35686986 Free PMC article.
-
The Role of Lipids in CRAC Channel Function.Biomolecules. 2022 Feb 23;12(3):352. doi: 10.3390/biom12030352. Biomolecules. 2022. PMID: 35327543 Free PMC article. Review.
-
The cool things to know about TRPM8!Channels (Austin). 2020 Dec;14(1):413-420. doi: 10.1080/19336950.2020.1841419. Channels (Austin). 2020. PMID: 33147416 Free PMC article. Review.
References
-
- Farooqi AA et al., TRPM channels: Same ballpark, different players, and different rules in immunogenetics. Immunogenetics 63, 773–787 (2011). - PubMed
-
- Fleig A, Penner R, The TRPM ion channel subfamily: molecular, biophysical and functional features. Trends Pharmacol Sci 25, 633–639 (2004). - PubMed
-
- McKemy DD, TRPM8: The cold and menthol receptor in TRP Ion Channel Function in Sensory Transduction and Cellular Signaling Cascades, Liedtke WB, Heller S, Eds. (CRC Press/Taylor & Francis, 2007), pp. 177–188. - PubMed
-
- McKemy DD, Neuhausser WM, Julius D, Identification of a cold receptor reveals a general role for TRP channels in thermosensation. Nature 416, 52–58 (2002). - PubMed
-
- Peier AM et al., A TRP channel that senses cold stimuli and menthol. Cell 108, 705–715 (2002). - PubMed
Publication types
MeSH terms
Substances
Grants and funding
LinkOut - more resources
Full Text Sources
Other Literature Sources
Molecular Biology Databases
Miscellaneous

