Tumour-reactive T cell subsets in the microenvironment of ovarian cancer
- PMID: 30718808
- PMCID: PMC6461863
- DOI: 10.1038/s41416-019-0384-y
Tumour-reactive T cell subsets in the microenvironment of ovarian cancer
Erratum in
-
Correction: Tumour-reactive T cell subsets in the microenvironment of ovarian cancer.Br J Cancer. 2019 Apr;120(8):870. doi: 10.1038/s41416-019-0425-6. Br J Cancer. 2019. PMID: 30890776 Free PMC article.
Abstract
Background: Solid malignancies are frequently infiltrated with T cells. The success of adoptive cell transfer (ACT) with expanded tumour-infiltrating lymphocytes (TILs) in melanoma warrants its testing in other cancer types. In this preclinical study, we investigated whether clinical-grade TILs could be manufactured from ovarian cancer (OC) tumour specimens.
Methods: Thirty-four tumour specimens were obtained from 33 individual patients with OC. TILs were analysed for phenotype, antigen specificity and functionality.
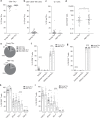
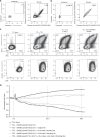
Results: Minimally expanded TILs (Young TILs) were successfully established from all patients. Young TILs contained a high frequency of CD3+ cells with a variable CD4/CD8 ratio. TILs could be expanded to clinical numbers. Importantly, recognition of autologous tumour cells was demonstrated in TILs in >50% of the patients. We confirmed with mass spectrometry the presentation of multiple tumour antigens, including peptides derived from the cancer-testis antigen GAGE, which could be recognised by antigen-specific TILs. Antigen-specific TILs could be isolated and further expanded in vitro.
Conclusion: These findings support the hypothesis that patients with OC can benefit from ACT with TILs and led to the initiation of a pilot clinical trial at our institution .
Trial registration: clinicaltrials.gov: NCT02482090.
Conflict of interest statement
The authors declare no competing interests.
Figures


Similar articles
-
Ex vivo expanded tumour-infiltrating lymphocytes from ovarian cancer patients release anti-tumour cytokines in response to autologous primary ovarian cancer cells.Cancer Immunol Immunother. 2018 Oct;67(10):1519-1531. doi: 10.1007/s00262-018-2211-3. Epub 2018 Jul 23. Cancer Immunol Immunother. 2018. PMID: 30039427 Free PMC article.
-
Characterization and comparison of 'standard' and 'young' tumour-infiltrating lymphocytes for adoptive cell therapy at a Danish translational research institution.Scand J Immunol. 2012 Feb;75(2):157-67. doi: 10.1111/j.1365-3083.2011.02640.x. Scand J Immunol. 2012. PMID: 21955245
-
Immunotherapy for peritoneal ovarian carcinoma metastasis using ex vivo expanded tumor infiltrating lymphocytes.Cancer Treat Res. 1996;82:115-46. doi: 10.1007/978-1-4613-1247-5_8. Cancer Treat Res. 1996. PMID: 8849947 Review.
-
The mutational load and a T-cell inflamed tumour phenotype identify ovarian cancer patients rendering tumour-reactive T cells from PD-1+ tumour-infiltrating lymphocytes.Br J Cancer. 2021 Mar;124(6):1138-1149. doi: 10.1038/s41416-020-01218-4. Epub 2021 Jan 5. Br J Cancer. 2021. PMID: 33402737 Free PMC article.
-
Tumor infiltrating lymphocytes in ovarian cancer.Cancer Biol Ther. 2015;16(6):807-20. doi: 10.1080/15384047.2015.1040960. Epub 2015 Apr 20. Cancer Biol Ther. 2015. PMID: 25894333 Free PMC article. Review.
Cited by
-
Defining the Role of Metastasis-Initiating Cells in Promoting Carcinogenesis in Ovarian Cancer.Biology (Basel). 2023 Dec 5;12(12):1492. doi: 10.3390/biology12121492. Biology (Basel). 2023. PMID: 38132318 Free PMC article. Review.
-
Preclinical and Clinical Immunotherapeutic Strategies in Epithelial Ovarian Cancer.Cancers (Basel). 2020 Jul 2;12(7):1761. doi: 10.3390/cancers12071761. Cancers (Basel). 2020. PMID: 32630708 Free PMC article. Review.
-
Inhibiting DNA methylation and RNA editing upregulates immunogenic RNA to transform the tumor microenvironment and prolong survival in ovarian cancer.J Immunother Cancer. 2022 Nov;10(11):e004974. doi: 10.1136/jitc-2022-004974. J Immunother Cancer. 2022. PMID: 36343976 Free PMC article.
-
Rapid Identification of the Tumor-Specific Reactive TIL Repertoire via Combined Detection of CD137, TNF, and IFNγ, Following Recognition of Autologous Tumor-Antigens.Front Immunol. 2021 Oct 11;12:705422. doi: 10.3389/fimmu.2021.705422. eCollection 2021. Front Immunol. 2021. PMID: 34707600 Free PMC article.
-
T-Cell Gene Therapy in Cancer Immunotherapy: Why It Is No Longer Just CARs on The Road.Cells. 2020 Jun 30;9(7):1588. doi: 10.3390/cells9071588. Cells. 2020. PMID: 32630096 Free PMC article. Review.
References
-
- Sato E, et al. Intraepithelial CD8+tumour-infiltrating lymphocytes and a hiThe Danish National Committee on Health Research Ethics approved the scientific use of the patient material (protocol number H-2–2014–055).gh CD8+/regulatory T cell ratio are associated with favorable prognosis in ovarian cancer. Proc. Natl. Acad. Sci. USA. 2005;102:18538–18543. doi: 10.1073/pnas.0509182102. - DOI - PMC - PubMed
Publication types
MeSH terms
Substances
Associated data
LinkOut - more resources
Full Text Sources
Medical
Research Materials

