. 2019 Feb 4;13(2):e0007052.
doi: 10.1371/journal.pntd.0007052. eCollection 2019 Feb.

Genomic instability at the locus of sterol C24-methyltransferase promotes amphotericin B resistance in Leishmania parasites

Affiliations

Genomic instability at the locus of sterol C24-methyltransferase promotes amphotericin B resistance in Leishmania parasites

Andrew W Pountain et al. PLoS Negl Trop Dis. .

Abstract

Amphotericin B is an increasingly important tool in efforts to reduce the global disease burden posed by Leishmania parasites. With few other chemotherapeutic options available for the treatment of leishmaniasis, the potential for emergent resistance to this drug is a considerable threat. Here we characterised four novel amphotericin B-resistant Leishmania mexicana lines. All lines exhibited altered sterol biosynthesis, and hypersensitivity to pentamidine. Whole genome sequencing demonstrated resistance-associated mutation of the sterol biosynthesis gene sterol C5-desaturase in one line. However, in three out of four lines, RNA-seq revealed loss of expression of sterol C24-methyltransferase (SMT) responsible for drug resistance and altered sterol biosynthesis. Additional loss of the miltefosine transporter was associated with one of those lines. SMT is encoded by two tandem gene copies, which we found to have very different expression levels. In all cases, reduced overall expression was associated with loss of the 3' untranslated region of the dominant gene copy, resulting from structural variations at this locus. Local regions of sequence homology, between the gene copies themselves, and also due to the presence of SIDER1 retrotransposon elements that promote multi-gene amplification, correlate to these structural variations. Moreover, in at least one case loss of SMT expression was not associated with loss of virulence in primary macrophages or in vivo. Whilst such repeat sequence-mediated instability is known in Leishmania genomes, its presence associated with resistance to a major antileishmanial drug, with no evidence of associated fitness costs, is a significant concern.


Conflict of interest statement

The authors have declared that no competing interests exist.

Figures
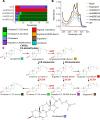
Fig 1
Fig 1. Changes to sterol composition in AmB-resistant parasites.
A) Percentage sterol composition, as determined by GC-MS. Error bars represent standard deviation of the mean, n = 3. B) UV absorbance spectra of sterol extracts. Ergosterol dissolved in n heptane (0.05 mg/ml) is used as a standard, and n-heptane as a blank. Representative of three independent biological replicates. C) Sterol biosynthesis pathway in Leishmania, showing the structures of sterols identified in wild-type and AmB-resistant parasites. Coloured boxes relate to the colour key for sterols in panel A. Cholesterol is shown with the carbons numbered as referred to in the text.
Fig 2
Fig 2. Deletion of the miltefosine transporter.
A) Genome coverage at the transporter locus. Normalised mapped read count for 100 bp windows is plotted against genomic position on chromosome 13 (normalisation was achieved by adjusting counts by the ratio between total mapped read counts for chromosome 13 for that line compared to wild-type). The top banner shows local read positions as black boxes, with the exception of the miltefosine transporter (LmxM.13.1530), which is in red. B) Miltefosine transporter expression, as determined by qRT-PCR. Asterisks denote statistically significant differences (P < 0.05) in δCt from wild-type (P values for AmBRB/cl2, AmBRC/cl3 and AmBRD/cl2 are 7.32 x 10⁻⁶, 0.0165 and 0.00105, respectively), n = 3. See Methods for the statistical approach used.
Fig 3
Fig 3. Changes to SMT expression.
A) Expression of SMT genes LmxM.36.2380 and LmxM.36.2390, expressed as normalised counts for individual clones for resistant lines (three independent biological replicates for wild-type). Asterisks represent corrected P values < 0.05. See Supplementary data for full statistical information. B) Wild-type promastigote expression of SMT genes, expressed as fold-expression over GAPDH. Initial Ct values were normalised to standard curves of genomic DNA to allow direct comparison of different qPCR targets (overall SMT values were altered by a factor of two to account for two gene copies), followed by division by similarly normalised values for GAPDH. Note that there is no significant difference (P > 0.05, two-tailed student’s t-test) in values for LmxM.36.2380 and total SMT expression. C) Expression of SMT genes in AmB-resistant lines, as determined by qRT-PCR. Asterisks denote statistically significant differences (P < 0.05) in δCt from wild-type, n = 3. P values for statistical changes were as follows for AmBRB/cl2, AmBRC/cl3 and AmBRD/cl2, respectively: for overall SMT, 4.68 x 10⁻⁶, 9.70 x 10⁻⁶ and 1.58 x 10⁻⁶; for LmxM.36.2380, 4.05 x 10⁻⁵, 2.21 x 10⁻⁴, and 0.00318; for LmxM.36.2390, 4.71 x 10⁻⁴, 0.0228 and 0.0430. See Methods for the statistical approach used.
Fig 4
Fig 4. Effects of ectopic expression of candidate AmB resistance-associated genes.
A) AmB sensitivity. Mean values are shown for IC50 with error bars denoting standard deviation (n = 4, except for AmBRB/cl2 and AmBRD/cl2 (n = 6), and AmBRB/cl2 + MT, AmBRB/cl2 + SMT WT and AmBRD/cl2 + SMT WT (n = 8)). Asterisks represent significant differences (P < 0.05), compared to wild-type, hashes between ectopic overexpression lines and their parental AmB-resistant lines. The black vertical bar denotes wild-type sensitivity. See S5 Table for full data, including individual P values. B) Pentamidine (PENT) sensitivity. As for panel (A), with n = 5 for all lines. C) Percentage sterol composition, as determined by GC-MS. Error bars represent standard deviation of the mean, n = 3. MT: Miltefosine transporter.
Fig 5
Fig 5. Genomic changes at the SMT locus.
A) Copy number variations in GAPDH (LmxM.36.2350) and SMT genes (LmxM.36.2380 and LmxM.36.2390) as determined by qPCR. Fold changes are calculated as 2-δCt between each line and wild-type, with 5 ng genomic DNA loaded per sample. Asterisks denote statistically significant differences (P < 0.05) in δCt from wild-type, n = 3. Dotted lines denote a halving or doubling of gene copy number. P values for statistically significant changes are as follows: for total SMT, values are 0.00302 and 0,00256 for AmBRC/cl3 and AmBRD/cl2, respectively; for LmxM.36.2380, values are 1.52 x 10⁻⁵, 5.78 x 10⁻⁶ and 4.39 x 10⁻⁴ for AmBRB/cl2, AmBRC/cl3 and AmBRD/cl2, respectively; for LmxM.36.2390, the value for AmBRB/cl2 is 0.00105. See Methods for the statistical approach used. B) Transcript sequences present in wild type (left column) and resistant lines. C) A model for deletion of the intergenic region and formation of a chimaeric SMT gene copy. Homologous recombination leads to generation of an extrachromosomal circular fragment, which is subsequently lost during replication.
Fig 6
Fig 6. Structural changes associated with SIDER1-mediated amplification.
A) Genome coverage of the region around the SMT locus. Normalised mapped read count for 500 bp windows is plotted against genomic position on chromosome 20 (normalisation was achieved by adjusting counts by the ratio between total mapped read counts for chromosome 20 for that line compared to wild-type). Vertical dotted black lines denote the mid-point position of the two tandem SIDER1 elements. B) A model for structural changes in AmBRB/cl2. Initial SIDER1-mediated linear duplication of a ~60 kb region is followed by homologous recombination-mediated deletion as depicted in Fig 5D. Note that whether these steps happen sequentially or simultaneously cannot be determined. Amplification leads to proximity between LmxM.36.2540 and an SMT gene copy, which is only detectable by PCR in AmBRB/cl2, as shown here (for full gel image see S10 Fig). C) Genome coverage of the region around the SMT locus in a previously selected AmB-resistant amastigote line. See panel (A) for details. Coverage data for a promastigote line derived from the same parent that did not exhibit amplification, as well as the wild-type line used in this study, are included for comparison.
Fig 7
Fig 7. Infectivity of AmB-resistant parasites and SMT gene expression in intracellular amastigotes.
A & B) Infectivity and replication of parasites within primary bone marrow-derived murine macrophages. Stationary phase promastigotes were used to infect macrophages for variable lengths of time and infection burdens were quantified as both parasites per infected macrophage (A) and percentage of macrophages infected (B). Error bars denote standard deviation, n = 3. C) AmB sensitivity of intracellular amastigotes. Asterisks significant differences (P < 0.05) in IC50 from wild-type, n = 3. D) Infectivity of wild-type and AmBRC/cl3 parasites in vivo. Parasites recovered from mouse lymph nodes were brought to stationary phase and injected into mouse footpads. Footpad size was measured over time. The mean of five mice per parasite line is shown, error bars represent standard deviation. E) Fold-change in expression of SMT genes in amastigotes compared to promastigotes in wild-type parasites. Asterisks significant differences (P < 0.05) in δCt between the two life cycle stages (statistically significant P values are 3.00 x 10⁻⁴ (total SMT) and 1.42 x 10⁻⁵ (LmxM.36.2380)), n = 3. F) Expression of SMT genes in intracellular amastigotes. RNA was derived from primary macrophages 72 hours after infection with stationary phase promastigotes. Asterisks denote statistically significant differences (P < 0.05) in δCt from wild-type, n = 3. Statistically significant P values are as follows: for total SMT, respective values for AmBRB/cl2, AmBRC/cl3 and AmBRD/cl2 are 0.0270, 0.00106 and 0.00164; for LmxM.36.2380, respective values for AmBRB/cl2, AmBRC/cl3 and AmBRD/cl2 are 0.00164, 6.31 x 10⁻⁶ and 1.95 x 10⁻⁴; for LmxM.36.2390, values for AmBRA/cl1, AmBRB/cl2, AmBRC/cl3 and AmBRD/cl2 are 0.0105, 0.0143, 0,0396 and 0,0121. See Methods for the statistical approach used in qRT-PCR assays.

Similar articles

Cited by

References

    1. Alvar J, Vélez ID, Bern C, Herrero M, Desjeux P, Cano J, et al. Leishmaniasis worldwide and global estimates of its incidence. PLoS One. 2012;7(5):e35671 10.1371/journal.pone.0035671 - DOI - PMC - PubMed
    1. Sundar S, Chakravarty J. Leishmaniasis: an update of current pharmacotherapy. Expert Opin Pharmacother. 2013;14(1):53–63. 10.1517/14656566.2013.755515 - DOI - PubMed
    1. Sundar S, More DK, Singh MK, Singh VP, Sharma S, Makharia A, et al. Failure of pentavalent antimony in visceral leishmaniasis in India: report from the center. 2000;31(2):1104–1107. - PubMed
    1. Prajapati VK, Sharma S, Rai M, Ostyn B, Salotra P, Vanaerschot M, et al. In vitro susceptibility of Leishmania donovani to miltefosine in Indian visceral leishmaniasis. Am J Trop Med Hyg. 2013;89(4):750–754. 10.4269/ajtmh.13-0096 - DOI - PMC - PubMed
    1. Rijal S, Ostyn B, Uranw S, Rai K, Bhattarai NR, Dorlo TPC, et al. Increasing failure of miltefosine in the treatment of Kala-azar in Nepal and the potential role of parasite drug resistance, reinfection, or noncompliance. Clin Infect Dis. 2013;56(11):1530–1538. 10.1093/cid/cit102 - DOI - PubMed

Publication types