. 2019 Feb 19;50(2):334-347.e9.
doi: 10.1016/j.immuni.2018.12.022. Epub 2019 Jan 29.

The Lupus Susceptibility Locus Sgp3 Encodes the Suppressor of Endogenous Retrovirus Expression SNERV

Affiliations

The Lupus Susceptibility Locus Sgp3 Encodes the Suppressor of Endogenous Retrovirus Expression SNERV

Rebecca S Treger et al. Immunity. .

Abstract

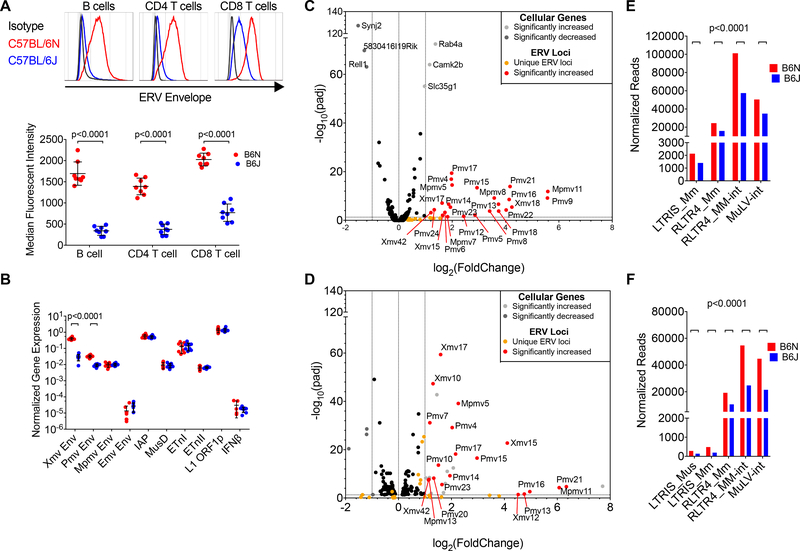
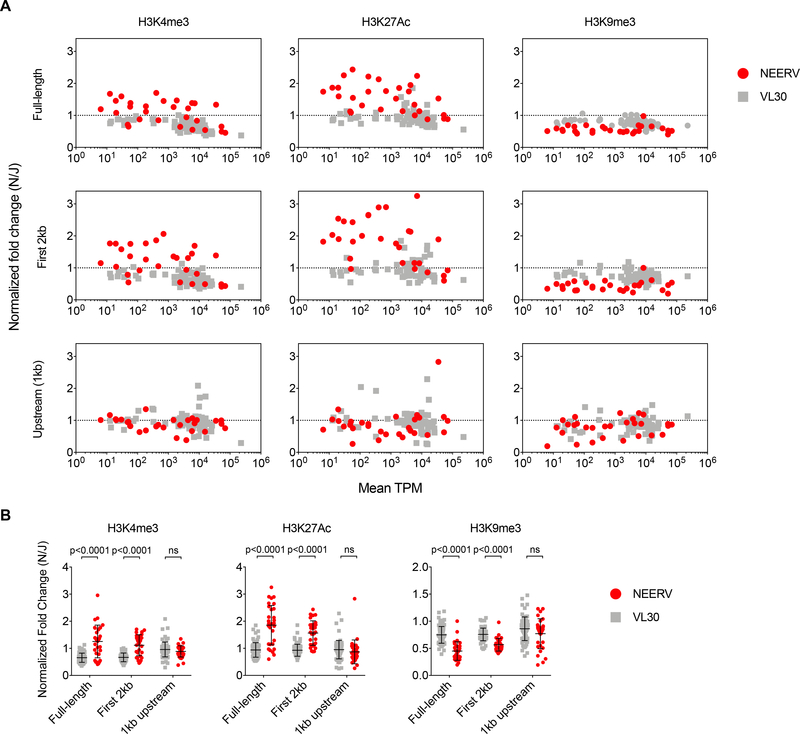
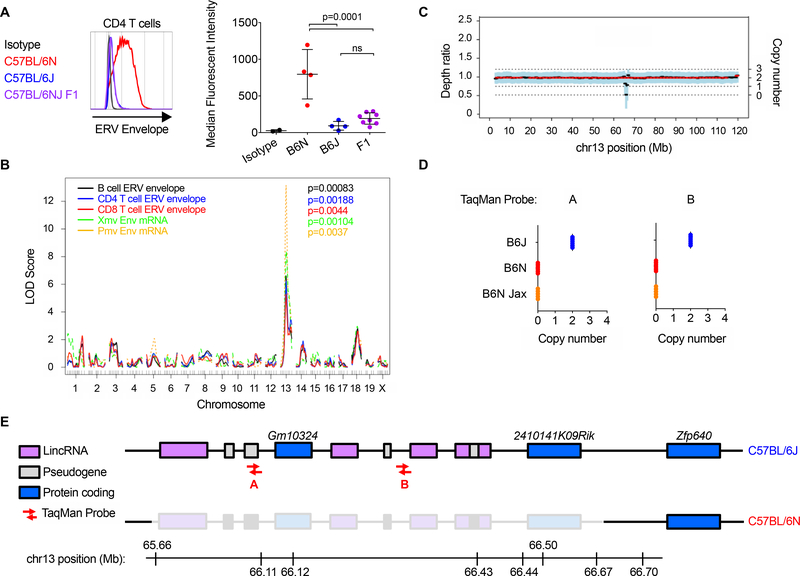
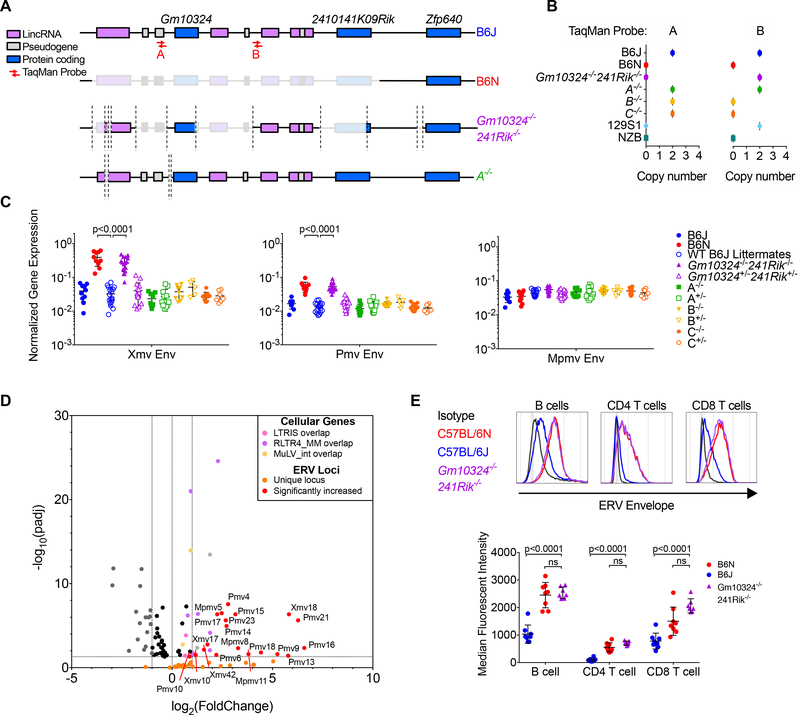
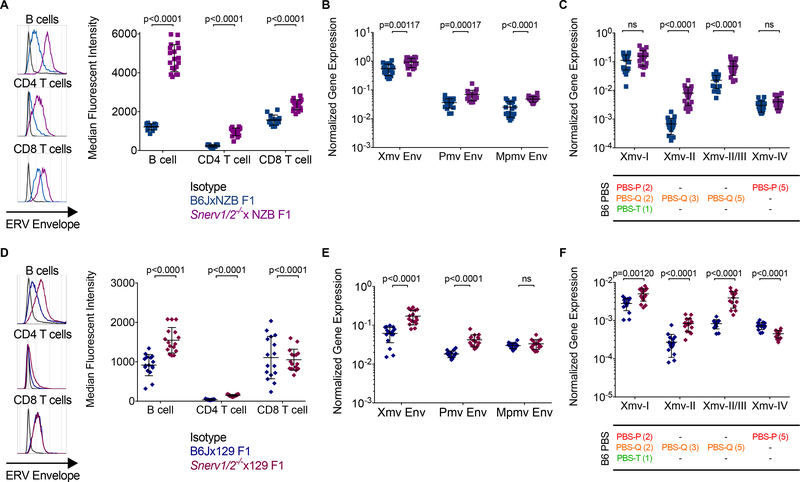
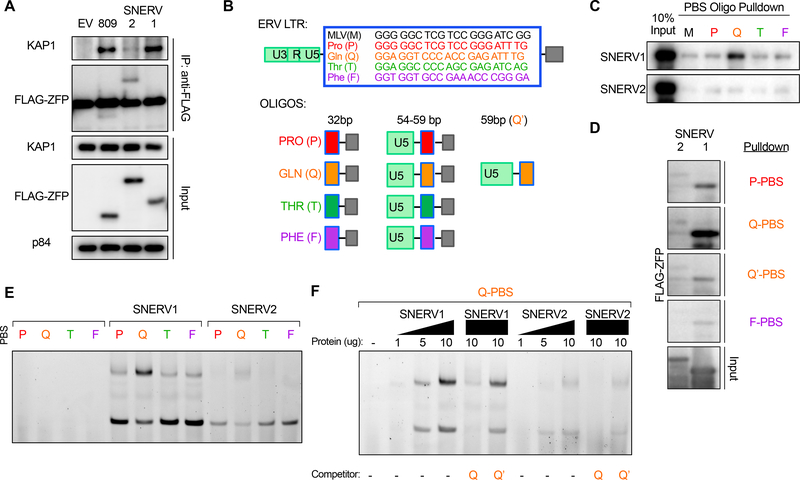
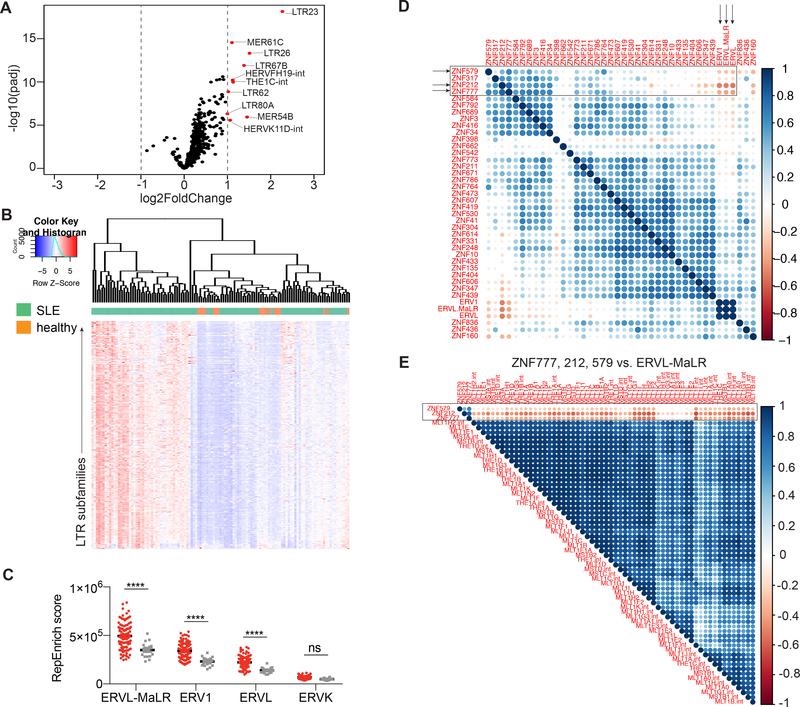
Elevated endogenous retrovirus (ERV) transcription and anti-ERV antibody reactivity are implicated in lupus pathogenesis. Overproduction of non-ecotropic ERV (NEERV) envelope glycoprotein gp70 and resultant nephritis occur in lupus-prone mice, but whether NEERV mis-expression contributes to lupus etiology is unclear. Here we identified suppressor of NEERV (Snerv) 1 and 2, Krüppel-associated box zinc-finger proteins (KRAB-ZFPs) that repressed NEERV by binding the NEERV long terminal repeat to recruit the transcriptional regulator KAP1. Germline Snerv1/Snerv2 deletion increased activating chromatin modifications, transcription, and gp70 expression from NEERV loci. F1 crosses of lupus-prone New Zealand Black (NZB) and 129 mice to Snerv1/Snerv2-/- mice failed to restore NEERV repression, demonstrating that loss of SNERV underlies the lupus autoantigen gp70 overproduction that promotes nephritis in susceptible mice and that SNERV encodes for Sgp3 (in NZB mice) and Gv-1 loci (in 129 mice). Increased ERV expression in lupus patients inversely correlated with three putative ERV-suppressing KRAB-ZFPs, suggesting that loss of KRAB-ZFP-mediated ERV control may contribute to human lupus pathogenesis.

Keywords: Endogenous retrovirus; Gv1; KRAB-ZFP; Sgp3; autoimmunity; gp70; lupus nephritis; systemic lupus erythematosus; transcriptional repression.


Conflict of interest statement

Declaration of interests

The authors declare no competing interests.

Figures

Figure 1.
Figure 1.. NEERV transcription is globally increased in C57BL/6N, but not C57BL/6J, lymphocytes and bone marrow-derived macrophages
(A) Representative histogram and calculated MFI of ERV envelope protein expression detected via FACS on the surface of peripheral blood B cells, CD4+ T, and CD8+ T lymphocytes from adult C57BL/6N (B6N) and C57BL/6J (B6J) mice. Each histogram or point represents an individual mouse and mean and standard deviation are plotted. (B) RT-qPCR of RNA from total splenocytes from B6N (n=8) and B6J (n=8) mice. Primers amplify respective envelope regions of all Xmv, Pmv, Mpmv, and Emv transcripts, the gag or polymerase regions of IAP, MusD, and ETn elements (Maksakova et al., 2009), or LINE1 ORFp1. Values were normalized to GAPDH expression. Mean and standard deviation are plotted. (C) Volcano plot of differentially expressed cellular genes & all 47 uniquely mappable ERV loci from mRNA sequencing of B6N and B6J naïve CD4+ T cells. (D) Normalized read counts mapping to NEERV LTR families using the RepEnrich alignment strategy from mRNA sequencing of naïve CD4+ T cells. (E) Volcano plot of differentially expressed cellular genes & all 47 uniquely mappable ERV loci from mRNA sequencing of B6N and B6J bone marrow-derived macrophages (F) Normalized read counts mapping to NEERV LTR families using the RepEnrich alignment strategy from mRNA sequencing of bone marrow-derived macrophages. Adjusted p-values in Figure 1 and Figure S1 were calculated for multiple t-tests (two-tailed) comparing B6N to B6J for each gene, corrected for the 25 independent hypotheses tested in Figure 1 and Figure S1 using the Holm-Šidák method with an alpha value of 0.05 for the entire family of comparisons. Adjusted p-values in Figure 1D & Figure 1E were calculated using DESeq2. See also Figure S1.
Figure 2.
Figure 2.. Intergenic NEERV loci are enriched for activating histone modifications and depleted of repressive histone modifications in BMDMs.
(A) Plot of normalized fold change for each listed histone modification versus the mean expression level in B6N and B6J BMDMs in transcripts per million (TPM). Normalized fold change was calculated as: [(Nsum histone modification reads + 0.1)/(Nsum input reads + 0.1)]/[(Jsum histone modification reads + 0.1)/(Jsum input reads + 0.1)]. This corresponds to: summation of the normalized ChIP-seq read counts across the full-length (top row), first 2kb (middle row), or 1kb immediately upstream (bottom row) of the NEERV (red) or VL30 (gray) loci for the histone modifications or input in B6N or B6J samples; addition of a pseudocount of 0.1 to all totals to avoid division by zero; division of the sums of the histone modifications by the sums of the input for the respective strain; and finally, division of the B6N-based value by the B6J-based value (B) Normalized fold changes plotted for each histone modification, with respect to each analyzed region as described above. Mean and standard deviation are plotted in black. Adjusted p-values were calculated for multiple t-tests comparing NEERV to VL30 for each histone mark across each region, corrected for the 9 independent hypotheses tested using the Holm-Šidák method with an alpha value of 0.05 for the entire family of comparisons.
Figure 3.
Figure 3.. Recessive loss of proviral endogenous retrovirus silencing maps to a deletion in two KRAB-ZFP genes on chromosome 13
(A) Representative histogram or calculated MFI of ERV envelope protein expression detected via FACS on the surface of peripheral blood CD4+ T lymphocytes from adult mice. Each histogram or point represents an individual mouse. (B) Single-quantitative trait locus analysis from 46 F2 intercrossed C57BL/6NJ mice. The logarithm of the odds (LOD) score, comparing the hypothesis that there is a QTL at the marker to the null hypothesis that there is no QTL anywhere in the genome, is plotted for every SNP maker and imputed marker across the genome. (C) Sequenza estimates allele-specific copy number from paired tumor-normal sequencing data. Sequenza analysis comparing the B6J and B6N genomes identified a single region within the QTL interval in the B6N genome with a decrease in depth ratio and copy number. (D) TaqMan probes with unique binding sites within the region of interest were used to amplify product from B6J (Iwasaki colony) and B6N (Iwasaki and Jackson colonies) genomes. (E) The deleted region in the B6N genome spans several long intergenic non-coding RNAs & pseudogenes and 2 Krüppel-associated box zinc finger proteins. P-values in Figure 3A were calculated using one-way ANOVA with Šidák’s multiple comparisons test and an alpha value of 0.05. QTL P-values were calculated by performing 10,000 permutation tests to obtain a genome-wide distribution for the null hypothesis. See also Figure S2.
Figure 4.
Figure 4.. Homozygous 2410141K09Rik−/−Gm10324−/− mice fail to repress NEERV mRNA and protein expression
(A) Schematic of chromosome 13 regions that were deleted in two of the B6J CRISPR-generated mice that were sequenced. (B) TaqMan probes with unique binding sites in the region of interest were used to amplify product from NZB, 129S1, B6N, B6J, and the CRISPR-generated mice (n=5 per group). (C) RT-qPCR of RNA from peripheral blood of WT and CRISPR-generated mice (n=5–18 per group) for Xmv, Pmv, and Mpmv envelope mRNA. Values were normalized to GAPDH expression. Listed are the significant adjusted p-values for multiple t-tests comparing all genotypes to the B6J WT littermate value for each gene, corrected for the 33 independent hypotheses tested in Figure 4 using the Holm-Šidák method with an alpha value of 0.05 for the entire family of comparisons. (D) Volcano plot of differentially expressed cellular genes & all 47 uniquely mappable ERV loci from mRNA sequencing of B6J and 241Rik−/−Gm10324−/− B6J CD4+ T cells. (E) Representative histogram and calculated MFI of ERV envelope protein expression detected via FACS on the surface of peripheral blood B cells, CD4+ T, and CD8+ T lymphocytes from adult B6J, B6N, and 241Rik−/−Gm10324−/− mice. Each histogram or point represents an individual mouse. Adjusted p-values for Figure 4E were calculated for multiple t-tests comparing the 241Rik−/−Gm10324−/− value to that of B6J (Figure 4E), corrected for the 33 independent hypotheses tested in Figure 4 using the Holm-Šidák method with an alpha value of 0.05 for the entire family of comparisons. Adjusted p-values in Figure 4D were calculated using DESeq2. See also Figure S3-S4.
Figure 5.
Figure 5.. SNERV1, but not SNERV2, strongly recruits KAP1 and selectively binds to the glutamine-complementary primer binding site in the NEERV LTR
(A) Anti-FLAG and anti-KAP1 western blot of immunoprecipitated FLAG-ZFP from 293T nuclear lysate following transient overexpression of FLAG-ZFP809, FLAG-SNERV1, or FLAG-SNERV2. (B) Schematic of the ERV LTR and LTR-based oligos that were designed for use in DNA pulldown and electrophoretic mobility shift assays (EMSA). Primer binding sites of the LTR-based oligos are denoted by amino acid letter and color in (C)-(F). (C) DNA pulldown of 32bp biotinylated LTR oligos by recombinant GST-FLAG-SNERV1 or GST-FLAG-SNERV2. (D) DNA pulldown of 59bp biotinylated LTR oligos by recombinant GST-FLAG-SNERV1 or GST-FLAG-SNERV2. (E) EMSA of 54bp AlexaFluor488-labeled double-stranded LTR oligonucleotides (AF488-PBS) using no protein or 10ug of recombinant GST-FLAG-SNERV1 or GST-FLAG-SNERV2. (F) EMSA of 54bp AF488-PBS-Q using increasing amounts of recombinant GST-FLAG-SNERV1 or GST-FLAG-SNERV2. Competitor 59bp unlabeled PBS-Q and PBS-Q’ LTR oligonucleotides were used in lanes 5–6 and 10–11 in (F) in 10-fold excess. See also Figure S5.
Figure 6.
Figure 6.. The NZB and 129 genomes do not complement the loss of NEERV silencing in the Snerv1/2−/− genome
(A). Representative histogram and calculated MFI of ERV envelope protein expression detected via FACS on the surface of peripheral blood B cells, CD4+ T, and CD8+ T lymphocytes from adult B6JxNZB F1 and Snerv1/2−/−xNZB F1 mice. (B) RT-qPCR of RNA from peripheral blood from B6JxNZB F1 and Snerv1/2−/−xNZB F1 mice for Xmv, Pmv, and Mpmv envelope mRNA. (C) RT-qPCR of RNA from peripheral blood from B6JxNZB F1 and Snerv1/2−/−xNZB F1 mice for Xmv-I, Xmv-II, Xmv-II/III, and Xmv-IV mRNA expression. (D). Representative histogram and calculated MFI of ERV envelope protein expression detected via FACS on the surface of peripheral blood B cells, CD4+ T, and CD8+ T lymphocytes from adult B6Jx129 F1 and Snerv1/2−/−x129 F1 mice. (E) RT-qPCR of RNA from peripheral blood from B6Jx129 F1 and Snerv1/2−/−x129 F1 mice for Xmv, Pmv, and Mpmv envelope mRNA. (F) RT-qPCR of RNA from peripheral blood from B6Jx129 F1 and Snerv1/2−/−x129 F1 mice for Xmv-I, Xmv-II, Xmv-II/III, and Xmv-IV mRNA expression. The PBS type(s) for mappable B6J Xmv loci are listed below their corresponding Xmv class, with the total number of loci in parentheses. Each histogram or point represents an individual mouse. Adjusted p-values were calculated for multiple t-tests comparing the Snerv1/2−/−-based F1 value to the B6J-based F1 value for each gene, corrected for the 20 independent hypotheses tested using the Holm-Šidák method with an alpha value of 0.05 for the entire family of comparisons. See also Figure S6.
Figure 7.
Figure 7.. HERV LTR elements are elevated in the blood of patients with SLE and identification of putative HERV-suppressing KRAB-ZFPs.
RNA sequencing data from whole blood of SLE patients (n=99) and healthy controls (n=18) were used to perform RepEnrich and DESeq2 analyses to quantify expression of LTR elements and cellular genes, respectively. (A) Volcano plot of significantly elevated LTR subfamilies in the blood of SLE patients versus healthy controls. LTR subfamilies indicated in red are log2(Fold Change) > 1 and padj < 0.05 in SLE patients versus healthy controls. (B) Heatmap of all LTR subfamilies that are significantly differentially expressed in SLE patients compared with healthy controls (padj < 0.05, n=316). Hierarchical clustering of patients was performed based on Euclidean distance. (C) The sum of all reads that belong to each indicated LTR families was graphed per individual. Two-way ANOVA was performed to calculate statistical significance. ****, p < 0.0001; ns, not significant. (D-E) Spearman correlation was calculated between all of the repressed KRAB-ZFPs and the sum of RepEnrich scores for the significantly elevated LTR families (D), and LTR subfamilies that belong to the ERVL-MaLR and ZNF777, ZNF212, and ZNF579 (E) among SLE patients. The correlation plot represents Spearman r values and displays only correlations that were p < 0.05. Blank indicates not significant. See also Figure S7.

Similar articles

Cited by

References

    1. Abyzov A, Urban AE, Snyder M, and Gerstein M (2011). CNVnator: an approach to discover, genotype, and characterize typical and atypical CNVs from family and population genome sequencing. Genome research 21, 974–984. - PMC - PubMed
    1. Andrews BS (1978). Spontaneous murine lupus-like syndromes. Clinical and immunopathological manifestations in several strains. Journal of Experimental Medicine 148, 1198–1215. - PMC - PubMed
    1. Baudino L, Yoshinobu K, Morito N, Kikuchi S, Fossati-Jimack L, Morley BJ, Vyse TJ, Hirose S, Jorgensen TN, Tucker RM, et al. (2008). Dissection of genetic mechanisms governing the expression of serum retroviral gp70 implicated in murine lupus nephritis. Journal of immunology 181, 2846–2854. - PMC - PubMed
    1. Bengtsson A, Blomberg J, Nived O, Pipkorn R, Toth L, and Sturfelt G (1996). Selective antibody reactivity with peptides from human endogenous retroviruses and nonviral poly(amino acids) in patients with systemic lupus erythematosus. Arthritis and rheumatism 39, 1654–1663. - PubMed
    1. Blomberg J, Nived O, Pipkorn R, Bengtsson A, Erlinge D, and Sturfelt G (1994). Increased antiretroviral antibody reactivity in sera from a defined population of patients with systemic lupus erythematosus. Correlation with autoantibodies and clinical manifestations. Arthritis and rheumatism 37, 57–66. - PubMed

Publication types

MeSH terms