. 2019 Feb;566(7743):264-269.
doi: 10.1038/s41586-019-0895-y. Epub 2019 Jan 30.

PKG1-modified TSC2 regulates mTORC1 activity to counter adverse cardiac stress

Affiliations

PKG1-modified TSC2 regulates mTORC1 activity to counter adverse cardiac stress

Mark J Ranek et al. Nature. 2019 Feb.

Abstract

The mechanistic target of rapamycin complex-1 (mTORC1) coordinates regulation of growth, metabolism, protein synthesis and autophagy1. Its hyperactivation contributes to disease in numerous organs, including the heart1,2, although broad inhibition of mTORC1 risks interference with its homeostatic roles. Tuberin (TSC2) is a GTPase-activating protein and prominent intrinsic regulator of mTORC1 that acts through modulation of RHEB (Ras homologue enriched in brain). TSC2 constitutively inhibits mTORC1; however, this activity is modified by phosphorylation from multiple signalling kinases that in turn inhibits (AMPK and GSK-3β) or stimulates (AKT, ERK and RSK-1) mTORC1 activity3-9. Each kinase requires engagement of multiple serines, impeding analysis of their role in vivo. Here we show that phosphorylation or gain- or loss-of-function mutations at either of two adjacent serine residues in TSC2 (S1365 and S1366 in mice; S1364 and S1365 in humans) can bidirectionally control mTORC1 activity stimulated by growth factors or haemodynamic stress, and consequently modulate cell growth and autophagy. However, basal mTORC1 activity remains unchanged. In the heart, or in isolated cardiomyocytes or fibroblasts, protein kinase G1 (PKG1) phosphorylates these TSC2 sites. PKG1 is a primary effector of nitric oxide and natriuretic peptide signalling, and protects against heart disease10-13. Suppression of hypertrophy and stimulation of autophagy in cardiomyocytes by PKG1 requires TSC2 phosphorylation. Homozygous knock-in mice that express a phosphorylation-silencing mutation in TSC2 (TSC2(S1365A)) develop worse heart disease and have higher mortality after sustained pressure overload of the heart, owing to mTORC1 hyperactivity that cannot be rescued by PKG1 stimulation. However, cardiac disease is reduced and survival of heterozygote Tsc2S1365A knock-in mice subjected to the same stress is improved by PKG1 activation or expression of a phosphorylation-mimicking mutation (TSC2(S1365E)). Resting mTORC1 activity is not altered in either knock-in model. Therefore, TSC2 phosphorylation is both required and sufficient for PKG1-mediated cardiac protection against pressure overload. The serine residues identified here provide a genetic tool for bidirectional regulation of the amplitude of stress-stimulated mTORC1 activity.


Figures
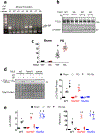
Extended Data Figure 1:
Extended Data Figure 1:. Both mTOR inhibition (everolimus) and PKG activation (sildenafil) similarly prevent pathological heart growth, dysfunction, hypertrophic gene expression, mTORC1 activation, and myocardial protein aggregation.
a)) Heart weight/tibia length (TL), lung weight/tibia length, cardiac ejection fraction (EF), mRNA expression for Nppa (A-type natriuretic peptide), Nppb (B-type natriuretic peptide), and Rcan1 (regulator of calcineurin 1), each gene normalized to Gapdh - from study of mice subjected to 6-wks of pressure-overload (PO) from trans-aortic constriction or to sham surgery, and PO mice further treated with vehicle, sildenafil (Sil, 200 mg/kg/day), or everolimus (Evl, 10 mg/kg/day) starting 1-week after PO surgery. Mean±SEM, n=6 biologically independent experiments, 1WANOVA with Tukey multiple comparisons test: †p≤ 6E-5 vs. other three groups, § p=1E-6 vs. Sham, p=0.007 vs PO+Sil, p=0.002 vs PO+Evl; # p=0.02, ‡ p<0.007, ¶ p=0.02 vs Sham; * p≤0.0005 vs all other groups. b,c) Summary analysis for immunoblots as displayed in Figure 1a and 1b. Data shown as mean±SEM; same 6 biologically independent experiments as in Panel a. 1WAVNOA, Tukey multiple comparisons test: †p<0.0001 vs. other three groups, # p<0.0003 vs Sham and PO, *p=0.002 vs Sham. d) Filter trap assay from myocardium obtained from same mouse experiment, with membranes probed for ubiquitin and α-tubulin. n=4 biologically independent experiments, Mean±SEM, 1WANOVA, Tukey multiple comparisons test, † p=1E-5 vs. other groups, #p=0.0002, ‡p=0.001 vs Sham.
Extended Data Figure 2:
Extended Data Figure 2:. PKG activation enhances autophagic flux and this is required for anti-hypertrophic efficacy; and leads to TSC2 phosphorylation at S1364 (human; 1365 mouse; 1366 rat).
a)Immunoblot of LC3-II in neonatal rat cardiomyocytes (NRCMs) with and without BFA treatment to block autophagy by preventing lysosomal proteolysis. The relative increase in LC3-II expression without versus with BFA treatment indexes autophagic flux. An example blot is shown to the left, summary data to the right. n=4 biologically independent experiments; mean±SEM, 1-WANOVA, Tukey multiple comparisons test; p<0.0001 for interaction of +/− BFA and drug treatment; * p=3E-5 vs Vehicle, p<1E-6 vs other groups. b) Effect of siRNA gene knockdown of ATG5 (siATG5) versus scrambled control (siScr) on Nppb gene expression in NRCMs treated with ET1±Sil. n=6 biologically independent samples, mean±SEM, 1WANOVA and Tukey multiple comparisons test: † p<1E-6 vs. three groups in siScr, # p<1E-6 vs. Veh and Sil in siATG5 group. c) Mass-spectrometry identifies TSC2 rat: raS1366 (equivalent to human: hsS1364 and mouse: mmS1365) as a phosphorylation target of PKG. Adult rat ventricular myocytes were exposed to cGMP to stimulate PKG activity, and MS performed on three independent replicates. d) Summary of immunoblot experiment in Figure 1e-upper. Mouse embryonic fibroblasts treated with 8-bromo-cGMP +/− PKG-inhibitor DT3; n=6 biologically independent samples. mean±SEM, 1WANOVA with post hoc Tukey test: †p=0.00004 vs vehicle, ‡ p=0.0004 vs cGMP. e) Immunoblot for TSC2 (antibody recognizing C-terminus) in myocytes expressing native protein, or transduced with wild-type, SA, SE TSC2 mutants using plasmid vector transfection. Expression levels were similar with each plasmid at 2× the leven in non-transduced cells. n=4 biologically independent samples, mean±SEM, 1WANOVA with post hoc Tukey test #p=0.0004 vs Control.
Extended Data Figure 3:
Extended Data Figure 3:. PKG is activated by endothelin-1 in myoyctes, and results in TSC2 phosphorylation detected by hsS1364-Ab in cells expressing WT but not huS1364A or huS1365A mutations. Direct PKG-TSC2 phosphorylation is confirmed using recombinant proteins ± SA mutations, and in cell lysates.
a) PKG activation in myocytes expressing WT, SA, or SE TSC2 and stimulated with endothelin-1 (ET1, 10 nM) versus vehicle for 48 hours. Mean±SD, n=18 biologically independent samples, unpaired Student’s 2-tailed t-test. b) PKG activation is independent of the form of TSC2 expressed; n=6 biologically independent samples, box/whisker and raw data plot; p=0.0004 for ET-1 effect, p>0.8 for group effect by 2-way ANOVA. c) Summary data for phospho/total S1364 TSC2 (human sequence) from ET1-stimulation experiment shown in Figure 1f. Mean±SEM, n=6 biologically independent samples from 3 experiments, 1WANOVA, Tukey multiple comparisons test, # p=0.003 vs SE, p=0.0003 vs SA. d) Antibody raised to mmS1365 (mouse) (equivalent to huS1364, human) shows increase TSC2 phosphorylation in myocytes transfected with WT TSC2 plasmid, but not cells expressing TSC2 SA or SE mutations at muS1366 (huS1365). The experiment is replicated x3, with n=6 biologically independent samples, Mean±SD. 1WANOVA, Tukey multiple comparisons test, # p=0.0002 vs SE, p=0.0007 vs SA. The results are identical to those using muS1365 (hsS1364) mutants, indicating that mutating either serine (SA or SE) prevents phosphorylation of the other and/or its detection by the phospho-antibody. e) Direct TSC2 phosphorylation by recombinant PKG1α detected by autoradiography on hsTSC2-FLAG (WT) and hsTSC2-FLAG-S1365A. Data replicated × 3; n=6 biologically independent samples, with identical results. The result is identical to that in Figure 1j with hsTSC2-HA-S1364A. f) Direct TSC2 phosphorylation by PKG1α in lysates from TSC2-KO HEK cells expressing WT or hsTSC2-HA-S1364A or hsTSC2-FLAG-S1365A, PKG1α M438G, and N6-Benzyl-ATPγS, and probed for thiophosphate ester. Top gel shows data with huS1364 mutated, lower with huS1365 mutated. The results are identical. n=6 biologically independent samples for each assay.
Extended Data Figure 4:
Extended Data Figure 4:. TSC2 huS1364 or huS1365 mutated to glutamatic acid (SE) suppresses endothelin-1 stimulated myocyte hypertrophy and mTORC1 activation, whereas mutation to alanine (SA) amplifies both.
a) Nppb mRNA expression (pathological hypertrophy gene marker) in myocytes transfected with WT, SA, or SE TSC2 (huS1365 mutated), and then exposed to 48-hrs ET1 (to induce hypertrophy) or to vehicle (Veh). Activation of PKG by sildenafil (Sil) reduces ET1-stimulated Nppb in WT expressing cells, but not in cells expressing SA or SE TSC2 mutants. SE expression depresses Nppb rise with ET1 stimulation, whereas SA expression enhances it. These results are nearly identical to those shown in Figure 2A in which the huS1364 (first serine of the duplet) was mutated. This shows that genetic modulation of either serine results in the same biological modulation of ET1 stimultion on growth and mTORC1 activity. Mean±SEM, n=6 biologically independent experiments, 1WANOVA with Tukey multiple comparisons test. *p<1E-5 vs other WT groups; † p=0.001 vs SE, p<1E-6 vs WT+ET1, ‡ p<1E-6 vs SA, WT-ET1, SE+ET1. b) Summary analysis of immunoblots displayed in Figure 1b. Values are normalized to WT/Veh; Mean SEM, n=4 (LC3-II) or 6 (others) biologically independent experiments; 1WANOVA, Tukey multiple comparisons test: *p≤ 7E-6 vs Vehicle control; † p<1E-6 vs SE-ET1; ‡p<5E-6, #p=0.01 vs WT-ET1, c) Example immunoblots from the same experiment as in Panel a and b, showing changes in mTORC1 signaling proteins, p62, and LC3-II. ET1 stimulates phosphorylation of mTORC1 targets (p70S6K, 4EBP1, Ulk1) and increases LC3-II and p62–consistent with mTORC1 activation and enhanced autophagy. SE (huS1365E) reduces mTORC1 activation and p62, and increases LC3-II, whereas SA (huS1365A) does the opposite. This is identical to responses found using huS1364 mutants (Fig 2b, Extended Data panel 4b) confirming functional equivalency from either serine modification. Experiment replicated 2–4 times, providing n=4–8 biologically independent samples. d) Summary data for this experiment. Values normalized to WT/Veh; Mean±SEM, n=8 independent replicates for p70S6K and 4EBP1, n=6 for Ulk-1, and n=4 for p62 and LC3-II. 1-WANOVA with Tukey multiple comparisons test, *p≤1E-6 vs WT vehicle and SE-ET1, †p<1E-6 vs SA-ET1, §p=0.0001, ‡p=0.003, ¶p<1E-6 vs SA-ET1, #p=0.003 vs. SA-Veh.
Extended Data Figure 5:
Extended Data Figure 5:. Effects of TSC2 SA and SE mutations on mTORC1 activation in response to phenylephrine; PKG activation of autophagy requires in part its phosphorylation of TSC2; and amplification of mTORC1 stimulation in cells expressing S1365A TSC2 mutation requires Rheb.
a) Neonatal rat myocytes expressing WT, SA, or SE TSC2 protein (huS1365 was modified) and exposed to vehicle or phenylephrine (PE, 100 mM) for 48 hours. Left: example immunoblot for phospho-p70S6K and total protein, Right: summary data, normalized to WT/PE-. Mean±SEM, n=6 biologically independent samples, Kruskal Wallis Test, Dunn’s multiple comparisons, *-p=0.003 vs corresponding vehicle; †: p=0.0013 vs SE-ET1. b) Upper: example immunoblots for LC3-II and p62 in lysates obtained from TSC2-KO MEFs transfected with either TSC2-WT or -SA plasmids (huS1364 modified) and then treated with ET1 (10 nM) ± cGMP (50 μM). n=3 biologically independent samples. Lower: Summary data, normalized to WT-TSC2, cGMP-/ET-; Mean±SEM, 1WANOVA, Tukey multiple comparisons test: *p≤1E-6 vs corresponding vehicle and SE+ET1, # p=0.0001 vs WT+Veh, p=0.001 vs SE+ET1, p=0.007 vs SA+ET1, †p=0.003 vs vehicle and ET1+cGMP, ‡ p=0.001 vs WT-ET1+cGMP. c) Summary results for Figure 2d. NRCMs transfected with Rheb or scrambled (Scr) siRNA, co-transfected with TSC2 WT, SE, or SA plasmids (huS1365 modified) and stimulated with ET1 for 48 hours. n=4 biologically independent experiments, Mean±SEM, values normalized to WT/Veh/Scr-siRNA; 1WANOVA, Tukey multiple comparisons test. *p=1E-6 vs Scr-siRNA/vehicle for WT and SA, #p=0.00002 vs siScr+ET1 for WT or SA.
Extended Data Figure 6:
Extended Data Figure 6:. TSC2 S1365A KI mouse genotyping; expression of TSC2 ± pressure overload; and effect on pressure-overload stimulated hypertrophy fetal gene (Nppa), autophagy, and mTORC1 activation.
a) Mouse TSC2-S1365A KI Genotyping by PCR detects a unique sequence based on the mutated residue as a 206-base pair (BP) fragment. This signature was used for genotyping. b) Immunoblot of TSC2 protein from SA and WT (littermate controls) for sham and PO treated groups. There is no difference in expression levels among these groups or conditions. Repeated independently x3 with identical results. c) Nppa normalized to Gapdh mRNA expression in WT versus SA/SA myocardium before and after chronic PO. N=8 biologically independent experiments. Mean±SEM, 1WANOVA, Tukey multiple comparisons test: * p=2E-5 vs Sham, †p<1E-6 vs Sham, p=3E-6 vs WT-PO. d) Immunoblots of LC3 from TSC2 WT, SA/WT, and SA/SA myocardium from mice subjected to sham or PO and co-treated with vehicle (Veh) or Sildenafil (Sil). PO-stimulated LC3-II expression is lacking in SA/WT or SA/SA, but is recovered in SA/WT with Sil treatment. It increases further in WT+PO+Sil. Experiment replicated twice providing 4 biologically independent samples. Mean±SEM; data normalized to mean of WT-sham, 1-WANOVA, Tukey test for multiple comparisons; *p<1E-6 vs respective Sham and vs PO in other two groups, †p<1E-6 vs respective Sham and vs SA/SA PO+Sil, p=0.0013 vs SA/WT PO+Sil, ‡ p<1E-6 vs Sham and SA/SA PO+Sil. e) Summary data for immunoblots displayed in Figure 3e and 3f. n=4 biologically independent experiments, Mean±SEM, data normalized to mean of WT-sham; 1WANOVA, Tukey multiple comparisons test: *p<1E-6 vs respective Sham and PO+Sil; † p=0.0002 vs Sham, ‡ p<1E-6 vs Sham and WT+PO, # p<1E-6 vs WT and SA/WT PO+Sil.
Extended Data Figure 7:
Extended Data Figure 7:. SA/SA KI mice display significantly increased mTORC1 but no change in mTORC2 activation; Depressed autophagy in SA/SA mice subjected to pressure overload is reversed by mTOR inhibition with everolimus.
a) Immunoblots and summary quantitation for mTORC2 targets from TSC2 WT and SA/SA mice subjected to sham or PO surgeries and treated with sildenafil or vehicle. n=4 biologically independent experiments, Box/whisker plots (median) with individual data shown; data normalized to mean of sham-WT. Analysis: 1WANOVA, Tukey multiple comparisons test. P70S6K is shown at top as an mTORC1 control, showing increased phosphorylation with PO that is greater and unresponsive to Sil in SA/SA mice; *p=0.002 vs Sham, †p=0.04 vs PO, ‡ p=0.03 vs Sham. However, there were no significant changes (p≥0.62 between conditions within genotype) in the expression of mTORC2 substrates: S473 p/t Akt, T24/T32 p/t FOXO1/3, and T346 p/t NRDG1. b) LC3-II expression is unaltered while p62 expression rises from PO in SA/SA myocardium, indicating suppression of autophagy. Both are reversed by co-treatment with mTORC1 inhibitor everolimus (Evl). n=6 biologically independent animal experiments, Mean±SEM, 1WANOVA, Tukey multiple comparisons test: *p≤3E-5 versus other two groups. Data are normalized to mean of sham control.
Extended Data Figure 8:
Extended Data Figure 8:. Generation of TSC2 S1365E KI mice, and impact on pressure-overload induced mTORC1 activation, autophagy, and autophagic flux in vivo.
a) Strategy and guide RNA for CRISPR-Cas9 protocol to generate S1365E (SE) knock-in mice. b) Summary data for Figure 4f. p/t70S6K (n=6 biologically independent experiments), p62/tubulin and LC3-II/total protein (n=4 biologically independent experiments, Mean±SEM, values are normalized to WT-Sham), 2WANOVA with Sidak’s multiple comparisons test *p<1E-6 vs WT sham, and p=0.0012, 0.0001 for PO-SE/WT and PO-SE/SE, respectively, † p=0.0008 vs SE/WT sham, ‡p=0.001 vs SE/SE Sham; for p62: # P≤1E-6 vs all other groups, § p=0.018 and p=0.0003 vs PO-SE/WT and PO-SE/SE, respectively, ** p=0.02 vs PO-SE/SE and p=0.0002 vs Sham, ## p<1E-6 vs Sham. c) Example immunoblot and summary results for TSC2 WT, SE/SE, and SA/SA mice treated with bafilomycin A1 (BFA) or vehicle. Myocardium was assayed for LC3-II, with higher expression in the presence of BFA indicating greater autophagic flux. Summary data, values normalized to WT-vehicle, Mean±SEM, n=4 biologically independent experiments; 2WANOVA with Sidak’s multiple comparisons test: p<1E-6 for BFA effect, p=0.003 for TSC2 genotype effect, and p=0.002 for interaction; Within group comparisons show p=0.04 for greater increase in SE/SE vs WT, and p=0.0017 for reduced increase in SA/SA vs WT in presence of BFA.
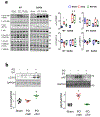
Figure 1.
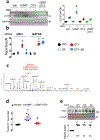
Figure 1.. PKG suppresses mTORC1 activity, reducing growth and stimulating autophagy, and phosphorylates TSC2 at serine 1365.
a) mTORC1 activation reflected by phosphorylated/total Ulk1, p70S6K and 4EBP1 rises in hearts of vehicle (Veh) treated mice subjected to sustained pressure-overload (PO). PKG activation by sildenafil (Sil) or mTORC1 inhibition (everolimus, Evl) similarly blocks these changes. b) LC3-II and p62 protein expression from same study. Summary results and statistics for panel a and b provided in Extended Data Figure 1b, based on n=6 biologically independent experiments. c) Confocal images of myocytes expressing LC3-II-GFP-RFP reporter, stimulated with ET1±cGMP or DT3 (PKG-inhibitor). Green puncta (autophagosomes) and red puncta (autolysosomes) per cell are quantified (mean±SEM, n=6–7 biologically independent samples, *p=0.003 vs no stimuli, # p=0.003 vs ET1+cGMP; Kruskal Wallis test with Dunn’s multiple comparisons test.) d) TSC2 phospho-target map shows S1365 identified from PKG-phospho-kinome relative to other known phosphorylation sites for mouse and human protein. e) Example Western blots for TSC2 S1365 phosphorylation. Upper- Phosphorylated/total (p/t) Ab signal (mm-pS1365) in mouse embryonic fibroblasts (MEFs) treated for 15 min with 8-Br-cGMP±PKG inhibitor (DT3) or vehicle (repeated x3 with similar results). Summary data in Extended Data 2D; Lower- p/t TSC2 using same antibody in mouse left ventricle ±PO with vehicle, Sil, or Evl co-treatment. f) Summary results for Panel e-lower. Mean±SEM, n=6 biologically independent experiments. (*p<0.002 vs other groups, #p=0.004 vs Sham, †p=0.01 vs Sham; 1WANOVA, Tukey multiple comparisons test). g) TSC2 phosphorylation correlates with in vivo myocardial PKG activity. h) Example and summary data for p/tTSC2 levels in normal versus failing human heart (n=11–12/group). i) Phospho-Ab detects pTSC2 in endothelin-1 (ET1)-stimulated myocytes in cells overexpressing hs-TSC2-WT (WT) but not hs-TSC2-S1364A or hs-TSC2-S1364E. 3 full replicates; summary in Extended Data Fig 3d. j) TSC2 phosphorylation occurs by recombinant PKG1α based on autoradiography of hsTSC2-HA-WT and hsTSC2-HA-S1364A (upper lane). Immunoblots for HA and TSC2 are in shown in lower lanes (8 biologically independent replicates). Figure 1C green dots * p=0.003 vs vehicle, # p=0.003 vs ET1+cGMP;
Figure 2.
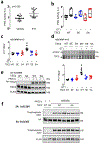
Figure 2.. TSC2 S1365A and S1365E mutations bi-directionally regulate mTORC1 growth hormone-activation to control cardiomyocyte hypertrophy and autophagy.
a) Effect of hs-TSC2-WT, hs-TSC2-S1364E (SE), or hs-TSC2-S1364A (SA) mutants ± Sil on pro-hypertrophic Nppb expression in isolated myocytes stimulated with vehicle or ET1 (n=6 biologically independent samples for each condition). Mean±SEM. 1WANOVA, Tukey multiple comparisons test within TSC2 genotypes: *p<1E-6 vs other groups; 2WANOVA between genotypes, ET1 vs ET1+Sil: p<1E-6 for Sil and TSC2-genotype interaction, Tukey multiple comparisons tests: †p<1E-6 vs WT+ET1 and SE+ET1, ‡p=4E-6 vs WT+ET1, #p<1E-6 vs ET1+SIL for other genotypes. b) Example immunoblots for p/t - p70S6K, 4EBP1, total p62 and LC3-II, from same protocol in panel a. Summary results shown in Extended Data 4b with 4–6 biologically independent samples. c) Confocal image and summary data (n=6 biologically independent experiments; Mean±SEM) for LC3-GFP-RFP reporter of autophagic flux in WT, SA, or SE-TSC2 expressing myocytes ± ET-1 stimulation. 1W ANOVA, Sidak multiple comparison test. For green and red dots: * p≤8E-5 vs corresponding Vehicle, red: †-p=0.014 vs Veh-SA and WT-ET1, p<1E-6 vs SE-ET1, # p<1E-6 vs WT-ET1. d) SA-mTORC1 modulation requires Rheb. NRCMs transfected with Rheb or scrambled siRNA, co-transfected with TSC2 WT, SE, or SA plasmids are then stimulated with ET1. Immunoblots for Rheb, P-p70S6K and total p70S6K are shown (n=4 biologically independent experiments, summary in Extended Data 5c. e) TSC2-KO MEFs expressing empty vector, TSC2 WT or TSC2 SA TSC2 exposed to ET1 to stimulate mTORC1, and then 2-deoxyglucose (2-DG) to suppress it by activating AMPK. MTORC1 activation is blunted by 2DG in TSC2-WT or TSC2–SA expressing cells, and correlates with enhanced hsTSC2-S1387 (AMPK site) phosphorylation. Experiment replicated 5 times. f-h) Summary analysis of experiment in panel e, n=10 biologically independent samples; Mean±SEM. f) 2W-ANOVA, Tukey multiple comparisons. *p<1E-6 vs TSC2 KO in corresponding treatment group, p=0.6 for interaction of 2DG and genotype. g) 1WANOVA, Tukey multiple comparisons: *p<1E-6, †p=0.0002, ‡p=0.001 vs. TSC2-KO. h) *p=0.004, †p=0.008 vs without 2-DG.
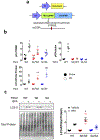
Figure 3.
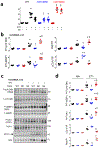
Figure 3.. TSC2 S1365A knock-in mice have exacerbated hypertrophy and mortality from pressure-overload, and homozygous KI cannot be ameliorated by PKG activation.
a) Strategy and guide-RNA for CRISPR-Cas9 generated mmS1365A (SA) knock-in mice. b) Percent survival for TSC2 WT, (SA/WT), and (SA/SA) mice exposed to sham or PO with vehicle or Sil co-treatment. Sample size/group noted in figure. Log rank Mantel-Cox test, *p=0.04 combined SA/WT and SA/SA vs WT-Veh; †p=0.03 vs SA/WT + Sil. c) Example Masson’s trichrome stained left ventricle cross sections from TSC2 WT, SA/WT, SA/SA mice subjected to sham or PO and treated with vehicle or Sil. Repeated at least 6× for each condition. d) Heart (HW), lung (LuW) weight normalized to tibial length (TL), and fractional shortening for same experiments show near complete suppression of hypertrophy and lung congestion with Sil-treatment in WT and SA/WT but no effect in SA/SA PO hearts. (Biologically independent replicates: n=5 for SA/WT PO, 6 for SA/WT and SA/SA PO+Sil, 7 for SA/SA and WT PO+Sil, and 8 for WT-PO); Mean±SEM. 1WANOVA, Tukey multiple comparison: * p<1E-6, †p=0.0004 vs PO without Sil, and SA/SA PO+Sil, ‡ p=0.0001, ¶p=0.04, # p=0.001 vs WT without Sil, ** p=0.009, †† p=0.0009 vs WT-PO. e) Immunoblots for phospho/total p70S6K and p62/tubulin from myocardium of WT, SA/WT, and SA/SA mice with sham, PO, or PO+Sil. Repeated x1 with identical results, summary (n=4/condition) in Extended Data 6e, 6f. f) Effect of SA/WT or SA/SA on myocardial protein aggregation in sham, PO, and PO+Sil. Mean±SEM, biological replicates are as listed for Panel d. 1WANOVA, Tukey multiple comparisons test: *p≤0.00008 vs respective sham in each group; §p<0.0003 vs. respective PO; †p<0.0003 vs WT-PO, sham, ‡ p<1E-6 vs PO+Sil for other two genotype groups.
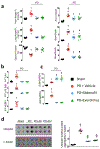
Figure 4.
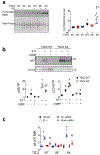
Figure 4.. Everolimus rescues mmS1365A mice, and mmS1365E KI mice are protected against hypertrophy, dysfunction, and mTORC1 hyper-activation following pressure overload.
a) Percent survival of SA/SA PO mice +/− everolimus (Evl) co-treatment. P-value for log-rank Mantel-Cox test. Sample size/group shown. b) Example echocardiography shows normalized left ventricular function in Evl-treated mice. Repeated: n=4, 9, 8 for Sham, PO, and PO+Evl. c) PO increased heart (HW) and lung (LuW) weight normalized to tibia length (TL) is reversed by by Evl-treatment in SA/SA; Mean±SEM, Kruskal Wallis Test with Dunn’s multiple comparisons vs PO alone: *p=0.01 vs Sham, p=0.001 vs PO+Evl; †p=0.021 vs Sham, p=.0005 vs PO+Evl. d) Echocardiograms of mice expressing SE/WT or SE/SE KI mutation subjected to 6-weeks of PO display improved function despite PO. Repeated 7–8 times/group. e) Regression of heart weight/tibia length and percent fractional shortening versus left ventricular-aorta pressure difference (load), p-values are for group effect between TSC2 WT/WT versus SE/WT and SE/SE by ANCOVA. f) Immunoblots for p/t70 S6K, p62/tubulin, and LC3-II/tubulin (n=6, 4, 4, respectively for biologically independent samples, summary data in Extended Data 8b). g) Effect of SE/WT and SE/SE expression on myocardial protein aggregation induced by PO. Mean±SEM, n=6 biologically independent experiments, 2WANOVA (p<1E-6 for effect of PO, genotype, and interaction), Tukey multiple comparisons: * p=0.00002 versus respective sham; † p=0.00002 vs SE/WT and SE/SE PO, ‡ p=0.0003 vs SE/WT PO. Panel F * = 0.001; + - <0.001 § - p=0.02 vs SA homo; ǂ - 0.016 vs SE het, and p<0.001 vs SE homo p=

Comment in

Similar articles

Cited by

References

    1. Saxton RA & Sabatini DM mTOR Signaling in Growth, Metabolism, and Disease. Cell 168, 960–976, doi:10.1016/j.cell.2017.02.004 (2017). - DOI - PMC - PubMed
    1. Sciarretta S, Forte M, Frati G & Sadoshima J New Insights Into the Role of mTOR Signaling in the Cardiovascular System. Circ Res 122, 489–505, doi:10.1161/circresaha.117.311147 (2018). - DOI - PMC - PubMed
    1. Zhang Y et al. Coordinated regulation of protein synthesis and degradation by mTORC1. Nature 513, 440–443, doi:10.1038/nature13492 (2014). - DOI - PMC - PubMed
    1. Ma L, Chen Z, Erdjument-Bromage H, Tempst P & Pandolfi PP Phosphorylation and functional inactivation of TSC2 by Erk implications for tuberous sclerosis and cancer pathogenesis. Cell 121, 179–193, doi:10.1016/j.cell.2005.02.031 (2005). - DOI - PubMed
    1. Potter CJ, Pedraza LG & Xu T Akt regulates growth by directly phosphorylating Tsc2. Nat Cell Biol 4, 658–665, doi:10.1038/ncb840 (2002). - DOI - PubMed

Publication types

MeSH terms