. 2020 Jan;249(1):76-87.
doi: 10.1002/dvdy.16. Epub 2019 Feb 18.

Development and organization of the zebrafish intestinal epithelial stem cell niche

Affiliations

Development and organization of the zebrafish intestinal epithelial stem cell niche

Jianlong Li et al. Dev Dyn. 2020 Jan.

Abstract

Background: Development of the vertebrate intestinal epithelial stem cell niche begins during embryogenesis but maturation occurs postembryonic. The intestinal mammalian crypt contains stem cells interspersed by secretory cells that play a role in regulation of proliferation. Epithelial cells are specified as either secretory or enterocytes as they migrate up the villi in mammals or fold in zebrafish. Zebrafish forms a functional intestine by the end of embryogenesis but takes another 4 weeks to develop the adult proliferation pattern.

Results: We characterize development of the intestinal epithelial stem cell niche during the postembryonic period. During the first 2-weeks postembryogenesis, different groups of epithelial cells sequentially proceed through one or two cell cycles, appear to become quiescent, and remain at the interfold base. The third week begins asymmetric divisions with proliferative progeny moving up the folds. Apoptotic cells are not observed at the fold tip until the end of the fourth week. Secretory cells intersperse among interfold base proliferative cells, increasing in number during the third and fourth weeks with a coincident change in proliferation pattern.

Conclusions: Zebrafish postembryonic intestinal epithelial development consists of 2 weeks of slow proliferation followed by 2 weeks of metamorphosis to the adult structure. Developmental Dynamics 2019. © 2019 Wiley Periodicals, Inc.

Keywords: development; epithelial; intestine; post-embryonic; proliferation; secretory cell; zebrafish.


Figures

Fig. 1.
Fig. 1.
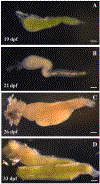
Growth of postembryonic larval intestine. The larval intestine continues as a straight tube for the 2 weeks following embryogenesis (A). The main change in appearance of the intestine between 6 and 19 dpf is doubling or tripling of the intestinal diameter. During the third week (20 to 26 dpf), a loop develops by first bending the intestine laterally and then rotating the bend dorsally (B). The loop continues to grow anteriorly and appears to draw in a portion of the posterior intestine into the loop (C). The intestine continues to grow in length during the fourth week (27 to 33 dpf) but not at the same rate as in the third week. One of the changes is a narrowing of the anterior intestinal diameter (D). Scale bar =100 μm
Fig. 2.
Fig. 2.
Changes in intestine dimensions of the postembryonic larval intestine. Quantification of increases in length (A) and diameter (B, anterior; C, posterior) intestine between 6 and 33 dpf. While there are increases in all intestine dimensions during the first 2 weeks postembryogenesis (6 to 19 dpf), changes become more pronounced by the end of the third week (26 dpf). 5 dpf n = 13; 12 dpf n = 9; 19 dpf n = 16; 26 dpf n = 11; 33 dpf n = 11.
Fig. 3.
Fig. 3.
Intestinal fold appearance. Intestinal folds viewed from the lumen side are defined at 19 dpf but appear shallow (A). Folds appear deeper by 26 dpf (B). Histological sections of 19 dpf folds (C) appear less developed than folds of 26 dpf intestines (D). Images from the lumen side and the histological images are from the anterior most portion of the mid region of the intestine as diagramed in the green lateral view of 19 dpf (E) and ventral view of 26 dpf (G); anterior is to the left). Cartoons in E to H also diagram regions recorded in Table 1. Anterior, pink; green, mid; red, posterior (E,G). The 19 dpf (F) and 26 dpf (H) diagram regions of folds recorded: black line represents the fold and dots represent nuclei. Green to green nuclei is width of base; green to blue (at tip of fold- top of diagram) is height of fold. Scale bar = 200 μm in A,B; 20 μm in C,D. Red line base of mesenchyme/limit of intestine; asterisk, lumen in C and D.
Fig. 4.
Fig. 4.
Intestinal epithelial proliferation 6 to 19 dpf. During the 6 to 19 dpf period an hour pulse of Edu labels a similar distribution of isolated cells throughout the intestinal epithelium. A: Example of 1-hr Edu pulse in anterior of 6 dpf intestine dissected, mounted and imaged following a pulse of Edu (anterior to the left and dorsal is to the top). Edu-labeled cells are imaged in two regions as diagramed in B (anterior to right); one region (183 × 183 μm) in the anterior as the intestine begins to enlarge in diameter (blue box labeled A) and another in the posterior (blue box labeled P), 183 μm from the posterior end (indicated by red line). Quantification of Edu pulse labeling in the anterior (6 to 12 dpf, C; 13 to 19 dpf, D; black bars) and posterior (6 to 12 dpf, B; 13 to 19 dpf, C; gray bars) demonstrates a repeating pattern of proliferation with moderate levels at the beginning of the week (B, 6 dpf; C, 13 dpf) followed by reduction (B, 8 dpf; C, 15 dpf) with an increase at the end of the week (B, 10 dpf; C, 17 dpf). During both the first (B) (6 to 12 dpf) and second week (C) (13 to 19 dpf) there is significant changes in the proliferation rate when comparing the first day to both subsequent days during the week as analyzed using the Student t-test with Bonferroni correction (*P < 0.025; **P < 0.005; ***P < 0.0005). n = 20 per dpf; Scale bar = 20 μm.
Fig. 5.
Fig. 5.
Estimation of cell cycle length during the first and second week postembryonic period. Edu is injected at the beginning of the respective week (A, 6 dpf or D, 13 dpf). Average Edu-labeled cells were quantified after a pulse (1 in A and D) and varying chase periods (A2, 7.5 hr; A3, 12 hr; A4, 6 days; D2, 12 hr; D3, 24 hr; D4, 48 hr; D5, 6 days). Anterior and posterior regions are the same position and size as in Figure 4. During the first week, both in the anterior (B) and posterior (C) labeled cells double by 12 hr. The doubling time during the second week increases to 24 hr in both the anterior (E) and posterior (F). During both weeks, a chase period of six days demonstrates that labeled cells do not continue doubling each 12 or 24 hr during the rest of the week. n = 30 per week in three independent experiments. Averages: 6–12 dpf anterior- pulse (6 dpf) 1 hr-38.5; 7.5 hr- 73; 12 hr- 79.5; 12 dpf (6 days postinjection)- 126.7 posterior- pulse (6 dpf) 1 hr- 41.3; 7.5 hr- 60.2; 12 hr- 84.2; 12 dpf (6 days postinjection)- 123.5; 13-19 dpf anterior- pulse (13 dpf) 1 hr- 43.7; 12 hr- 64.4; 24 hr- 96.8; 48 hr- 117.7; 19 dpf (6 days postinjection)- 127.5 posterior- pulse (13 dpf) 1 hr- 55.8; 12 hr- 68.4; 48 hr- 115.3; 19 dpf (6 days postinjection)- 118.7.
Fig. 6.
Fig. 6.
Overlap between S phase cells labeled on different days between 6 and 19 dpf. Cells are labeled with Edu (green) on 6 (A) or 13 (D) dpf followed by Brdu (red) labeling on 9 (A) or 16 (D) and fixed 1 hr after Brdu injection (blue arrow A and D). Both during the first (B) and the second (E) week postembryogenesis there is little overlap between the two groups. Only one cell in each field of view co-labels with Edu (green) and Brdu (red) (white arrows). Quantification of Edu and Brdu-labeled cells and overlap between the two labeled cells during the first week (B) and the second week (D). C,F: Anterior and posterior regions are the same position and size as in Figure 4. Control single labelings of Edu or Brdu were processed for detection of the opposite nucleotide (injected at 4 dpf and grown to 5 dpf). While the injected nucleotide was detected, there was no cross-reactivity for the opposite nucleotide demonstrating the specificity of Edu and Brdu detection. n = 10 per week; Scale bar = 10 μm.
Fig. 7.
Fig. 7.
Position of proliferating cells between 6 and 19 dpf. Epithelial cells are labeled with a pulse of Edu (1 hr) at 7 dpf (A, blue arrow) and 14 dpf (D, blue arrow) followed by a chase to 19 dpf (red arrow). All labeled cells start in the interfold base (B, 7dpf and E, 14 dpf) and remain at this position following the chase period (C, 7 to 19 dpf and F, 14 to 19 dpf). Arrows indicate Edu-labeled cells (B, C, E, and F); Scale bar = 10 μm; n = 5.
Fig. 8.
Fig. 8.
Proliferation through the third week (20 to 26 dpf). Proliferation levels during the third week are similar to the first 2 weeks postembryogenesis (A). Anterior and posterior regions are the same position and size as in Figure 4. As the intestinal loop develops, a segment within the loop was sampled (B). A segment just before the loop (A-BL), in the loop (BL-L), and after the loop (L-AL). AL (B) region begins 183 μm from the posterior end. Each region is 183 × 183 μm. In the segment anterior and posterior to the loop, more cells enter S phase in the latter half of the week first in the region posterior to the loop (24 C) then both anterior and posterior to the loop at 26 hpf (C). The looped region is where most of the new length is added and the loop region has significantly higher proliferation rates (C) Significance in (C) measured by Student t-test *P < 0.05, ***P < 0.001. n = 10 per time point.
Fig. 9.
Fig. 9.
A–J: Epithelial cells migrate up the folds during the third and the fourth week postembryogenesis. Individuals are injected with Edu (green arrow) either at 20 (A) or 27 (E) dpf. Samples are taken at 1 hr to determine initial cell position (first blue arrow, A and E) and then at 2-day intervals to the end of the week (three additional blue arrows, A and E). With a pulse of Edu at either 20 dpf (A) or 27 dpf (D) epithelial cells are labeled only at the fold base (arrows). Following a chase for 2 days to either 22 (C) or 29 (G) dpf, progeny reach the mid-fold (arrows) and reach the tip by 4 days at either24 (B) or 31 (E) dpf. In each of the histological panels, the dashed line is drawn between the epithelial and mesenchymal layers. During these 2 weeks, mesenchymal cells are also labeled (examples at 24 dpf-C and 31-F; mesenchymal cells indicated with arrowheads); n = 4.
Fig. 10.
Fig. 10.
A–I: Development of apoptotic cells. In cross sections of the Tg(βactin:SecAV-YFP)pu17 line, no apoptotic cells are observed during the third postembryonic week (example 23 dpf A to C). A small numbers of apoptotic cells are first observed at the tip of the fold at 33 dpf (arrow in E and merge with DAPI nuclear stain in F). Apoptotic cells become more prominent at the fold tip by 2 months postembryogenesis (arrows in H and merge with DAPI nuclear stain in I).
Fig. 11.
Fig. 11.
Secretory cells associate with clusters of proliferating intestinal epithelial cells. A pulse of Edu at 96 hpf followed by a chase to 120 hpf labels a group of proliferating cells (A) which is present at the fold base (B). Secretory cells (anti-2F11) are interspersed within proliferating epithelial cells. Labeling with Edu on three different days during the first week postembryogenesis (C) (6–12 dpf) or the second week postembryogenesis (E) (13–19 dpf) labels clusters of proliferating epithelial cells. Secretory cells develop within groups of proliferating cells at the fold base (D) (6–12 dpf) and (F) (13–19 dpf) in a similar manner and number as observed at the end of embryogenesis. Some fold base epithelial cells begin differentiating into secretory cells (arrowhead A, C, E, and F) as they co-label with 2F11 and Edu. Pan-secretory 2F11, red; Edu, green; DAPI, blue; asterisk, intestinal lumen. Anterior is to the left and dorsal to the top in A, C, and E. Scale bar = 10 μm.
Fig. 12.
Fig. 12.
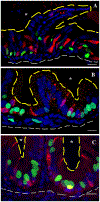
Secretory cells interdigitate between proliferating epithelial cells between 20 and 33 dpf. Labeling with Edu on three different days during the third week postembryogenesis labels multiple cells at the interfold base (A). Secretory cells now interdigitate between many of the proliferating epithelial cells. At 33 dpf, a single pulse of Edu labels multiple cells at the interfold base (B). Similar to 26 dpf, the interfold base now has many secretory cells and proliferating epithelial cells interdigitated. Numerous interdigitating secretory cells are observed between proliferating epithelial cells in the adult intestine following a single Edu pulse (C). The edge of the fold facing the lumen is outlined with the yellow dashed line. Red, pan-secretory 2F11; green, Edu; blue, DAPI; white dashed line outer edge of intestine, asterisk, intestinal lumen. Scale bar = 10 μm.
Fig. 13.
Fig. 13.
Model of postembryonic intestinal epithelial development. A: Pulse labeling reveals a small group of mostly isolated fold base epithelial cells entering the cell cycle on a given day and most become quiescent after one or two rounds (bar indicates base region in A- represented by individual color nuclei). S-phase labeling on multiple days during the first 2 weeks postembryonic period produces clusters of fold base epithelial cells (each color nuclei at fold base represents group of cells in S phase on a given day), revealing that most fold base epithelial cells have mitotic potential. Mitotic progeny remain at the fold base during this period suggesting that the intestine grows by expansion of fold base length and width. During the third week (B), pulse labeling also produces mostly isolated cells represented by multiple color nuclei at fold base. However, now mitotic progeny begin moving up the folds (red, orange, or yellow nuclei on folds- direction of movement indicated by arrows). Also half of the observed mitotic activity is now in mesenchyme in addition to epithelium (light green nuclei in mesenchyme). Apoptotic activity is not observed at the fold tips. Movement of epithelial progeny up the folds and mesenchymal mitosis accounts for significant changes in fold height during the third postembryonic week. The intestine almost doubles in length during the third week partially by looping. The loop increases intestinal length with a higher rate of mitotic activity than anterior and posterior regions. During the fourth week (C), multiple fold base epithelial cells are in mitosis at the same time (nuclei in same color at fold base), progeny continue to migrate up the folds (red nuclei on folds) and half of the observed mitotic activity is in mesenchyme cells (light green nuclei in mesenchyme). In contrast to the third week, apoptotic cells are now occasionally observed at the fold tip (white nuclei at fold tips) suggesting that the folds are still growing in height but intestine is also taking on the mature form during the fourth week postembryogenesis. Secretory cells distributed between proliferating cells become more numerous during the third and fourth week postembryogenesis. Secretory cells are likely to play roles in development of the stem cell compartment as well as regulation of proliferation.

Similar articles

Cited by

References

    1. Al-Nafussi AI, Wright NA. 1982. Cell kinetics in the mouse small intestine during immediate postnatal life. Virchows Arch B Cell Pathol Incl Mol Pathol 40:51–62. - PubMed
    1. Barker N 2014. Adult intestinal stem cells: critical drivers of epithelial homeostasis and regeneration. Nat Rev Mol Cell Biol 15:19–33. - PubMed
    1. Bjerknes M, Cheng H. 1999. Clonal analysis of mouse intestinal epithelial progenitors. Gastroenterology 116:7–14. - PubMed
    1. Crosnier C, Vargesson N, Gschmeissner S, Ariza-McNaughton L, Morrison A, Lewis J. 2005. Delta-Notch signalling controls commitment to a secretory fate in the zebrafish intestine. Development 132:1093–1104. - PubMed
    1. Fadeel B, Xue D. 2009. The ins and outs of phospholipid asymmetry in the plasma membrane: roles in health and disease. Crit Rev Biochem Mol Biol 44:264–277. - PMC - PubMed

Publication types

MeSH terms

LinkOut - more resources