. 2019 Jan;565(7741):659-663.
doi: 10.1038/s41586-019-0885-0. Epub 2019 Jan 23.

Autophagic cell death restricts chromosomal instability during replicative crisis

Affiliations

Autophagic cell death restricts chromosomal instability during replicative crisis

Joe Nassour et al. Nature. 2019 Jan.

Abstract

Replicative crisis is a senescence-independent process that acts as a final barrier against oncogenic transformation by eliminating pre-cancerous cells with disrupted cell cycle checkpoints1. It functions as a potent tumour suppressor and culminates in extensive cell death. Cells rarely evade elimination and evolve towards malignancy, but the mechanisms that underlie cell death in crisis are not well understood. Here we show that macroautophagy has a dominant role in the death of fibroblasts and epithelial cells during crisis. Activation of autophagy is critical for cell death, as its suppression promoted bypass of crisis, continued proliferation and accumulation of genome instability. Telomere dysfunction specifically triggers autophagy, implicating a telomere-driven autophagy pathway that is not induced by intrachromosomal breaks. Telomeric DNA damage generates cytosolic DNA species with fragile nuclear envelopes that undergo spontaneous disruption. The cytosolic chromatin fragments activate the cGAS-STING (cyclic GMP-AMP synthase-stimulator of interferon genes) pathway and engage the autophagy machinery. Our data suggest that autophagy is an integral component of the tumour suppressive crisis mechanism and that loss of autophagy function is required for the initiation of cancer.


Figures
Extended Data Fig. 1 |
Extended Data Fig. 1 |. Characteristic features of fibroblasts and epithelial cells in crisis.
a, Growth curves of IMR90 and WI38 lung fibroblasts expressing empty vector or vectors encoding SV40-LT or HPV-16 E6E7. Senescence (sen) and crisis plateaus are indicated. b, Immunoblotting of IMR90 and WI38 lung fibroblasts upon expression of SV40-LT or HPV-16 E6E7 with GAPDH as loading control. Two independent experiments were performed. c, Growth curves of HMECs (left) and PrECs (right) expressing vectors encoding P53(DD) and CDK4(R24C). NI, non-infected PrECs. Senescence (sen) and crisis plateaus are indicated. d, Immunoblotting of HMECs that spontaneously bypass senescence (sen) and enter crisis with GAPDH as loading control. Two independent experiments were performed. e, Immunoblotting of PrECs upon expression of P53(DD) and CDK4(R24C) with GAPDH as loading control. Two independent experiments were performed. f, Metaphase chromosomes of growing (PD97) and pre-crisis (PD103) IMR90E6E7 cells. DAPI staining in blue, telomeres in green and γH2AX in red. Two independent experiments were performed. g, Scatter plot showing the number of telomeric γH2AX foci per metaphase. Centre line, mean; error bars, ± s.d. n shows number of metaphases analysed. Two independent experiments were performed. One-way ANOVA; ns, not significant, ***P < 0.001. h, Metaphase chromosomes of growing (PD72) and pre-crisis (PD79) WI38SV40 cells. DAPI staining in blue, telomeres in green and centromeres in red. Two independent experiments were performed. i, Scatter plot showing the number of fused chromosomes per metaphase. n shows number of metaphases analysed. Centre line, mean; error bars, ± s.d. n shows number of metaphases analysed. Two independent experiments were performed. One-way ANOVA; ns, not significant, ***P < 0.001. For gel source data, see Supplementary Fig. 1.
Extended Data Fig. 2 |
Extended Data Fig. 2 |. Cells in crisis show characteristics of autophagy and not apoptosis.
a, Cells at the indicated population doublings were stained with annexin V and PI and the percentages of double-positive cells were measured by flow cytometry. Scatter plot with bars showing the percentage of dying cells approaching crisis. Bars represent mean ± s.d. n indicates number of samples analysed. One experiment was performed. One-way ANOVA; ns, not significant, ***P < 0.001. b, Representative phase contrast and fluorescence images of growing, crisis, and staurosporine-treated growing cells (1 μM for 6 h). DAPI staining in blue. One experiment was performed. Scale bar, 50 μm. c, Representative electron micrographs of autophagy-related structures present in crisis fibroblasts and epithelial cells. The images show double-membraned autophagosomes and simple-membraned autolysosomes with cargo at different stages of digestion. Two experiments were performed. d, Box and whisker plots showing the number of autophagic vacuoles per field of view. Centre line, median; box limits, first and third quartiles; whiskers, minimum and maximum. n shows number of images analysed. One-way ANOVA; ***P < 0.001. AVs, autophagic vacuoles. For gel source data, see Supplementary Fig. 1.
Extended Data Fig. 3 |
Extended Data Fig. 3 |. Autophagy activation in crisis cells.
a, Representative confocal microscopy images of growing fibroblasts and epithelial cells expressing wild-type mCherry-GFP-LC3 (mCherry-GFP-LC3wt). Cells were grown in complete growth medium (CTR) or Earle’s balanced salt solution (EBSS) (1 h). One experiment was performed. Scale bar, 10 μm. b, LC3 immunofluorescence performed on growing and crisis fibroblasts and epithelial cells. Representative confocal microscopy images. One experiment was performed. Scale bar, 10 μm. For gel source data, see Supplementary Fig. 1.
Extended Data Fig. 4 |
Extended Data Fig. 4 |. Inhibition of autophagy promotes crisis bypass.
a, Immunoblotting of HMECs and IMR90E6E7 cells expressing non-targeting control shRNA or shRNA against ATG3, ATG5 or ATG7 with GAPDH as loading control. Two experiments were performed. b, Measurement of cell proliferation rates in growing HMECs (PD22) and IMR90E6E7 cells (PD90) expressing non-targeting control shRNA or shRNA against ATG3, ATG5 or ATG7. Cells were stained with CytoLabelling Green Reagent dye and the fluorescence intensity was measured by flow cytometry at day 0 and day 3 post-labelling. Left, plots showing the difference in fluorescence intensity between day 0 and day 3. Right, scatter plots with bars showing the difference in median fluorescence intensity between day 0 and day 3 in HMECs and IMR90E6E7 cells. Bars represent mean ± s.d. n shows number of independent experiments. One-way ANOVA; ns, not significant. c, Dot plots of cell cycle distribution of growing HMECs (PD22) and IMR90E6E7 cells (PD90) expressing non-targeting control shRNA or shRNA against ATG3, ATG5 or ATG7. Three experiments were performed. d, Scatter plots with bars showing the mean percentage of cells in G1, S and G2/M cell cycle phases. Bars represent mean ± s.d. n shows number of independent experiments. One-way ANOVA; ns, not significant. e, Quantification of crystal violet staining. Scatter plot with bars showing the optic density of crystal violet solutions. Bars represent mean ± s.d. n shows number of replicates. One experiment was performed. OD, optical density. For gel source data, see Supplementary Fig. 1.
Extended Data Fig. 5 |
Extended Data Fig. 5 |. Crisis bypass is associated with DNA damage signalling.
a, TRF analysis of IMR90E6E7 cells expressing non-targeting control shRNA or shRNA against ATG3, ATG5 or ATG7. Genomic DNA was prepared from parental cells (day 0) or cells before crisis (day 40). Two experiments were performed. b, Scatter plots showing the number of telomeric γH2AX foci per metaphase in HMECs and IMR90E6E7 cells expressing non-targeting control shRNA or shRNA against ATG3, ATG5 or ATG7. Centre line, mean; error bars, ± s.d. Samples were taken at the indicated days. n shows number of metaphases analysed. One experiment was performed. One-way ANOVA; ns, not significant, *P < 0.05, ***P < 0.001. c, Scatter plots showing the number of fused chromosomes per metaphase in HMECs and IMR90E6E7 cells expressing non-targeting control shRNA or shRNA against ATG3, ATG5 or ATG7. Centre line, mean; error bars, ± s.d. Samples were taken at the indicated days. n shows number of metaphases analysed. Two experiments were performed. One-way ANOVA; ns, not significant, ***P < 0.001. d, Scatter plots showing the number of non-telomeric γH2AX foci per metaphase in HMECs and IMR90E6E7 cells expressing non-targeting control shRNA or shRNA against ATG3, ATG5 or ATG7. Centre line, mean; error bars, ± s.d. Samples were taken at the indicated days. n shows number of metaphases analysed. One experiment was performed. One-way ANOVA; ns, not significant, *P < 0.05, ***P < 0.001. For gel source data see Supplementary Fig. 1.
Extended Data Fig. 6 |
Extended Data Fig. 6 |. Telomere dysfunction activates autophagy.
a, Metaphase chromosomes of post-senescent HMECs (PD22) expressing non-targeting control shRNA or shRNA against TRF1 or TRF2. Metaphases were prepared from cells at day 6 post-transduction. Mock represents non-transduced cells. DAPI staining in blue, telomeres in green and γH2AX in red. Arrowheads indicate chromosome fusion events. Two independent experiments were performed. b, Left, scatter plot showing the mean number of telomeric γH2AX foci per metaphase at day 6 post-transduction. Right, scatter plot showing the number of fused chromosomes per metaphase at day 6 post-transduction. Centre line, mean. n shows number of metaphases analysed. Two independent experiments were performed. One-way ANOVA; ns, not significant, ∗∗∗P < 0.001. c, LC3-II and P62 turnover assays. HMECs and IMR90E6E7 cells expressing non-targeting control shRNA or shRNA targeting TRF2 at day 6 post-transduction were treated for bafilomycin A1 (50 nM for 24 h) or MG132 (10 μM for 24 h). Top, experimental timeline. Bottom, immunoblotting of HMECs and IMR90E6E7 cells at day 6 posttransduction with GAPDH as loading control. One experiment was performed. For gel source data, see Supplementary Fig. 1.
Extended Data Fig. 7 |
Extended Data Fig. 7 |. Telomere dysfunction activates autophagy.
a, Box and whisker plots showing the number of telomeric and non-telomeric γH2AX foci per cell upon increasing doses of ionizing radiation (IR), bleocin, or Shield1-based AsiSI, catalytically inactive TRF1-FokI(450A), or wild-type TRF1-FokI 1 h after damage induction. Centre line, median; box limits, first and third quartiles; whiskers, 10th and 90th percentiles. Cells used are post-senescent HMECs (PD23). Two independent experiments were performed. n shows number of cells analysed. One-way ANOVA; ns, not significant, *P < 0.05, **P < 0.01, ***p < 0.001. b, Post-senescent HMECs (PD23) were transfected with non-targeting siRNA or siRNA targeting DNAPKcs or ligase IV 48 h before damage induction. Representative confocal images of cells before damage, and 1 h or 48 h post-damage. DAPI staining in blue, telomeres in green and γH2AX in red. Two independent experiments were performed. c, Box and whisker plots showing the number of γH2AX foci per cell at 1, 12, 24 and 48 h after damage induction, as in a. d, Immunoblotting of IMR90E6E7 cells (PD40) at 12, 24 and 48 h post-induction of TRF1-FokI(450A) or wild-type TRF1-FokI. Mock represents non-transduced cells. GAPDH loading control. Two independent experiments were performed. e, LC3-II and P62 turnover assays. Control (non-induced) and wild-type TRF1-FokI-expressing cells were treated with bafilomycin A1 (50 nM for 24 h) or MG132 (10 μM for 24 h). Top, experimental timeline. Bottom, immunoblotting of HMECs and IMR90E6E7 cells before and 48 h after induction of wild-type TRF1-FokI. GAPDH loading control. One experiment was performed. For gel source data, see Supplementary Fig. 1.
Extended Data Fig. 8 |
Extended Data Fig. 8 |. Crisis cells display cytosolic DNA species.
a, Top, representative confocal microscopy images of crisis IMR90E6E7 cells (PD108) expressing RFP-NLS or immunostained with antibodies against lamin A or lamin B1. Bottom, grouped stacked bars showing the ratio of positive and negative micronuclei for each of the indicated stains. n shows number of micronuclei analysed. b, Top, representative confocal microscopy images of crisis IMR90E6E7 cells (PD108) immunostained with mitotracker dye. Bottom, grouped stacked bars showing the ratio of positive and negative cytosolic DNA products for mitotracker staining. n shows number of cytosolic DNA products analysed. c, Top, representative confocal microscopy images of crisis IMR90E6E7 cells, growing IMR90E6E7 cells expressing shRNA targeting TRF2 (day 6 post-transduction) or growing IMR90E6E7 cells expressing wild-type TRF1-FokI (48 h post-induction). The corresponding population doublings are indicated. DAPI staining in blue, telomeres in green. Bottom, grouped stacked bars showing the ratio of positive and negative micronuclei for telomeres. n shows number of micronuclei analysed. d, Top, representative confocal image of U2OS cells displaying extrachromosomal telomeric repeat (ECTR) DNA. Bottom, scatter plot with bars showing the percentage of IMR90E6E7 and U2OS cells positive for ECTRs. Growing and crisis IMR90E6E7 cells, growing IMR90E6E7 cells expressing shRNA targeting TRF2 (day 6 post-transduction) and growing IMR90E6E7 cells expressing wild-type TRF1-FokI (48 h post-induction) were used. Bars represent mean. The corresponding population doublings are indicated. Two independent experiments were performed. n shows number of cells analysed. For gel source data, see Supplementary Fig. 1.
Extended Data Fig. 9 |
Extended Data Fig. 9 |. Telomere fusion is required for autophagy activation.
a, Immunoblotting of growing IMR90E6E7 cells (PD30) upon siRNA targeting DNAPKcs or ligase IV 48 h post-transfection (experiment in Fig. 4b). γTubulin loading control. Two independent experiments were performed. b, Experimental timeline for c-g. c, Metaphase chromosomes of growing IMR90E6E7 cells (PD55) upon shRNA targeting of TRF2 and siRNA targeting of ligase IV at day 6 post-transduction. Left, DAPI staining in blue, telomeres in green and centromeres in red. Arrowheads indicate chromosome fusion events. Two independent experiments were performed. d, Scatter plot showing the number of telomeric γH2AX foci per metaphase. Centre line, mean; error bars, ± s.d. n shows number of metaphases analysed. Two experiments were performed. One-way ANOVA, ns: not significant, ***P < 0.001. e, Scatter plots showing the number of fused chromosomes per metaphase, as in d. f, Grouped stacked bars showing the percentage of IMR90E6E7 cells with nucleoplasmic bridges, micronuclei and cytoplasmic chromatin fragments upon shRNA targeting TRF2 and siRNA targeting ligase IV. Bars represent mean ± s.d. n shows number of cells analysed. Three experiments were performed. g, Immunoblotting of IMR90E6E7 cells upon shRNA targeting TRF2 and siRNA targeting ligase IV with γtubulin as loading control. One experiment was performed. h, Scatter plot showing the number of fused chromosomes per metaphase 48 h after induction of wild-type TRF1-FokI, as in d. For gel source data, see Supplementary Fig. 1.
Extended Data Fig. 10 |
Extended Data Fig. 10 |. cGAS-STING pathway is required for telomere-driven autophagy.
a, Quantification of crystal violet staining. Scatter plot with bars showing the optic density of crystal violet solutions. Bars represent mean ± s.d. n shows number of replicates. One experiment was performed. b, Representative confocal microscopy images of IMR90E6E7 cells expressing sh-scramble or shRNA targeting CGAS or STING with DAPI staining. Three independent experiments were performed. Scale bar, 10 μm. For gel source data, see Supplementary Fig. 1.
Fig. 1 |
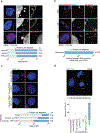
Fig. 1 |. Crisis cells exhibit features of active autophagy.
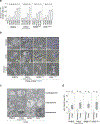
a, Electron micrographs of growing, crisis and staurosporine-treated (stauro) growing cells (1 μM for 6 h). Yellow and red arrows indicate autophagosomes and autolysosomes, respectively. Two independent experiments. Scale bar, 2 μm. Quantification in Extended Data Fig. 2d. PD, population doubling. b, Top, immunoblotting of HMECs and IMR90E6E7 cells approaching crisis with GAPDH as loading control. Two independent experiments performed. Bottom, LC3-II and P62 turnover assays. Immunoblotting of HMECs and IMR90E6E7 cells in the presence or absence of bafilomycin A1 (BafA1, 50 nM for 24 h) or MG132 (10 μM for 24 h). NT, not treated; GAPDH as loading control. One experiment. c, Confocal microscopy images of growing and crisis cells expressing wild-type (WT) mCherry-GFP-LC3, crisis cells expressing wild-type mCherry-GFP-LC3 treated with bafilomycin A1 and crisis cells expressing mutant mCherry-GFP-LC3(G120A). Two independent experiments. Scale bar, 10 μm. d, Box and whisker plots showing the number of autophagosomes (yellow LC3 dots) and autolysosomes (red LC3 dots). Centre line, median; box limits, first and third quartiles; whiskers, 10th and 90th percentiles. n shows number of cells analysed. Two independent experiments. One-way ANOVA; NS, not significant, *P < 0.05, **P < 0.01, ***P < 0.001. For gel source data see Supplementary Fig. 1.
Fig. 2 |
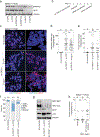
Fig. 2 |. Autophagy inhibition promotes crisis bypass.
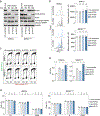
a, Growth curves of post-senescent HMECs and IMR90E6E7 cells that have bypassed senescence expressing non-targeting control short hairpin RNA (shRNA; sh-scramble) or shRNA against ATG3, ATG5 or ATG7. b, Crystal violet viability assay of HMECs and IMR90E6E7 cells expressing non-targeting shRNA or shRNA against ATG3, ATG5 or ATG7. Two independent experiments. Quantification in Extended Data Fig. 4e. c, Cells were stained with annexin V and propidium iodide (PI) and percentages of double-positive cells were measured by flow cytometry. Floating bars show the percentage of Annexin V+/PI+ cells; centre line, mean; box limits, minimum and maximum. n shows number of independent experiments. One-way ANOVA; NS, not significant, ***P < 0.001. d, Floating bars showing the percentage of BrdU+ cells by flow cytometry, as in c. e, Representative multiplex fluorescence in situ hybridization (M-FISH) showing full metaphase spreads of sh-scramble, sh-ATG3, sh-ATG5 and sh-ATG7 IMR90E6E7 cells before crisis (day 40) and sh-ATG3, sh-ATG5 and sh-ATG7 IMR90E6E7 cells that bypassed crisis (day 85). One experiment. f, Box and whisker plots showing percentages of chromosome pairs with aberrations (structural and numerical). Centre line, median; box limits, first and third quartiles; whiskers are plotted according to the Tukey method. n shows number of metaphases analysed. One-way ANOVA; NS, not significant, **P < 0.01, ***P < 0.001. Aberrations listed in Supplementary Table 1. For gel source data see Supplementary Fig. 1.
Fig. 3 |
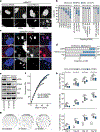
Fig. 3 |. Telomeric DNA damage activates autophagy.
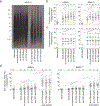
a, Immunoblotting of HMECs (top) and IMR90E6E7 cells (bottom) expressing non-targeting shRNA or shRNA against TRF1 or TRF2 with GAPDH as loading control. Three independent experiments performed for HMECs and one for IMR90E6E7 cells. b, Representative confocal microscopy images of cells expressing wild-type mCherry-GFP-LC3. Two independent experiments. Scale bar, 10 μm. c, Scatter plots showing the number of autophagosomes and autolysosomes. Centre line, mean. n shows number of cells analysed. Two independent experiments. One-way ANOVA; NS, not significant, ***P < 0.001. d, Immunoblotting of HMECs with intrachromosomal damage (ionizing radiation, IR; bleocin, bleo; and AsiSI) or telomeric damage (catalytically inactive TRF1-FokI(450A); wild-type TRF1-FokI). Small inhibitory RNA (siRNA) targeting of DNAPKcs or ligase IV (Lig.IV) performed 48 h before damage induction. si-CTR, control; GAPDH, loading control. Two independent experiments. SE, short exposure; LE, long exposure. e, Scatter plots showing the number of autophagosomes and autolysosomes determined with wild-type mCherry-GFP-LC3 as in c. Two independent experiments. One-way ANOVA; NS, not significant, ***P < 0.001. For gel source data, see Supplementary Fig. 1.
Fig. 4 |
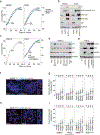
Fig. 4 |. Telomere-driven autophagy requires the cGAS-STING pathway.
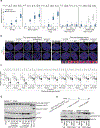
a, Confocal microscopy images of growing and crisis IMR90E6E7 cells stained with DAPI. Three independent experiments. Scale bar, 5 (μm. CCFs, cytoplasmic chromatin fragments; MN, micronuclei; NPBs, nucleoplasmic bridges. b, Grouped stacked bars showing the percentage of IMR90E6E7 cells with nucleoplasmic bridges, micronuclei and cytoplasmic chromatin fragments in cells approaching crisis, lacking TRF2 (sh-TRF2#A or sh-TRF2#B), challenged with intrachromosomal damage (ionizing radiation, IR) or telomeric damage (wild-type TRF1-FokI). Bars represent mean ± s.d. For intrachromosomal damage, cells were transfected with siRNA targeting DNAPKcs or ligase IV 48 h before damage. n shows number of cells analysed. Three independent experiments. c, Confocal microscopy images of crisis IMR90E6E7 cells expressing mCherry-LC3 or immunostained with antibodies against cGAS or P62. Two independent experiments. Scale bar, 5 μm. d, Grouped stacked bars showing the ratio of positive and negative micronuclei for each of the indicated stains. n shows number of micronuclei analysed. e, Immunoblotting of sh-scramble, sh-cGAS and sh-STING ImR90E6E7 cells at day 60 with GAPDH as loading control. One experiment. f, Growth curves of IMR90E6E7 cells expressing non-targeting control shRNA or shRNA against CGAS or sTlNG. g, Crystal violet cell viability assay of IMR90E6E7 cells expressing non-targeting shRNA or shRNA against CGAS or STING. One experiment. Quantification in Extended Data Fig. 10a. h, Floating bars showing the percentage of cells with nucleoplasmic bridges, micronuclei and cytoplasmic chromatin fragments. Centre line, mean; box limits, minimum and maximum. n shows number of cells analysed. Three independent experiments. One-way ANOVA; NS, not significant, *P < 0.05, **P < 0.01, ***P < 0.001. For gel source data, see Supplementary Fig. 1.

Comment in

Similar articles

Cited by

References

    1. Wei W & Sedivy JM Differentiation between senescence (M1) and crisis (M2) in human fibroblast cultures. Exp. Cell Res. 253, 519–522 (1999). - PubMed
    1. Hayashi MT, Cesare AJ, Rivera T & Karlseder J Cell death during crisis is mediated by mitotic telomere deprotection. Nature 522, 492–496 (2015). - PMC - PubMed
    1. Maciejowski J & de Lange T Telomeres in cancer: tumour suppression and genome instability. Nat. Rev. Mol. Cell Biol. 18, 175–186 (2017). - PMC - PubMed
    1. Artandi SE & DePinho RA A critical role for telomeres in suppressing and facilitating carcinogenesis. Curr. Opin. Genet. Dev. 10, 39–46 (2000). - PubMed
    1. Steinberg ML & Defendi V Transformation and immortalization of human keratinocytes by SV40. J. Invest. Dermatol. 81, 131s–136s (1983). - PubMed

Publication types

MeSH terms