. 2019 Jan 23;14(1):e0210252.
doi: 10.1371/journal.pone.0210252. eCollection 2019.

Cytomegalovirus vectors expressing Plasmodium knowlesi antigens induce immune responses that delay parasitemia upon sporozoite challenge

Affiliations

Cytomegalovirus vectors expressing Plasmodium knowlesi antigens induce immune responses that delay parasitemia upon sporozoite challenge

Scott G Hansen et al. PLoS One. .

Abstract

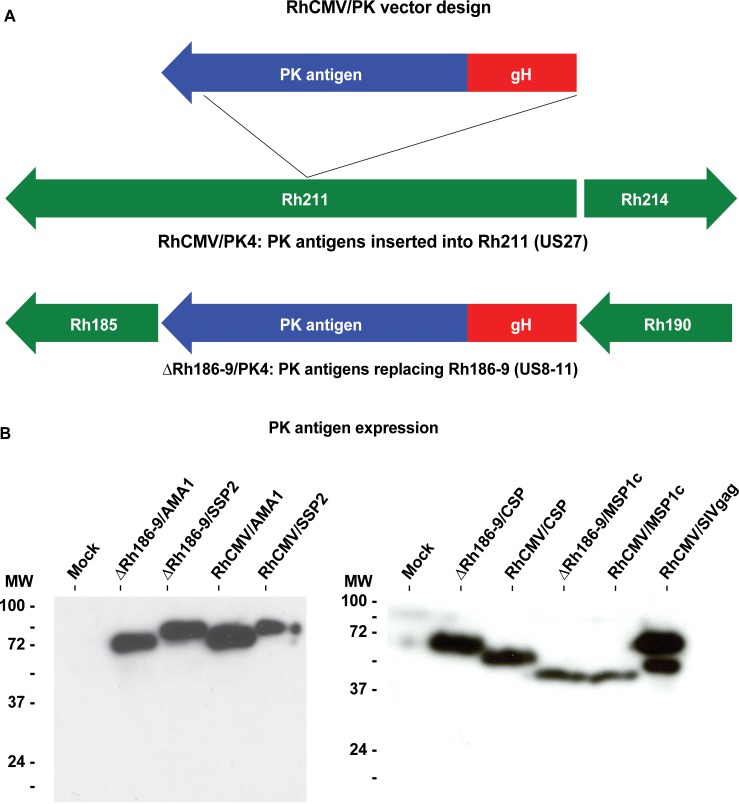
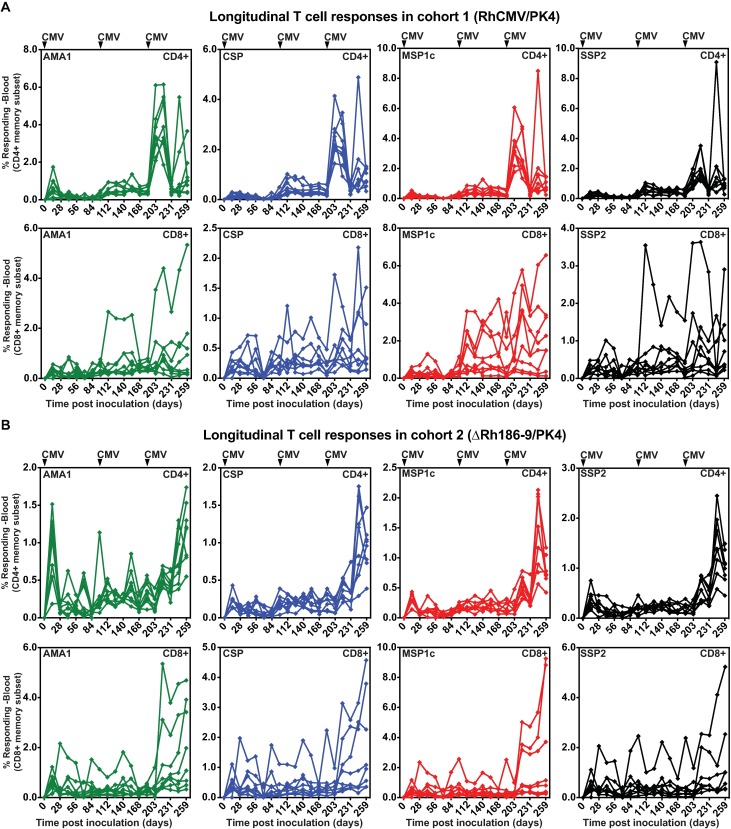
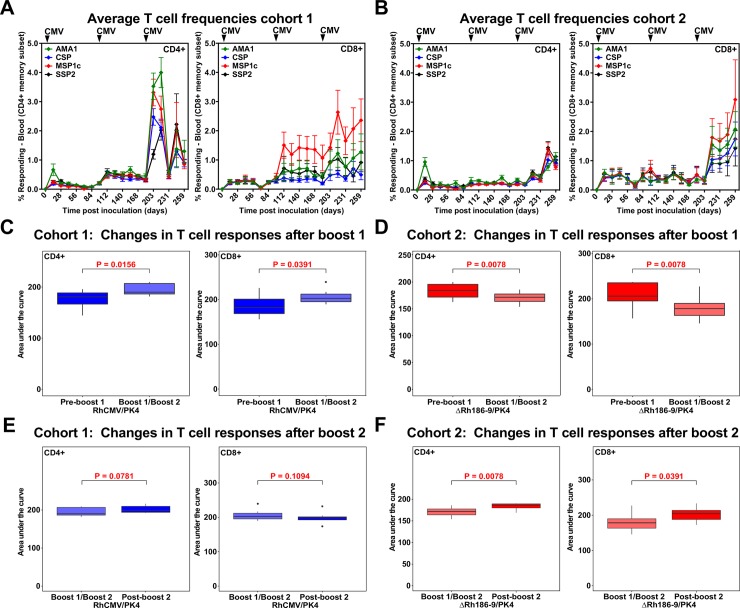
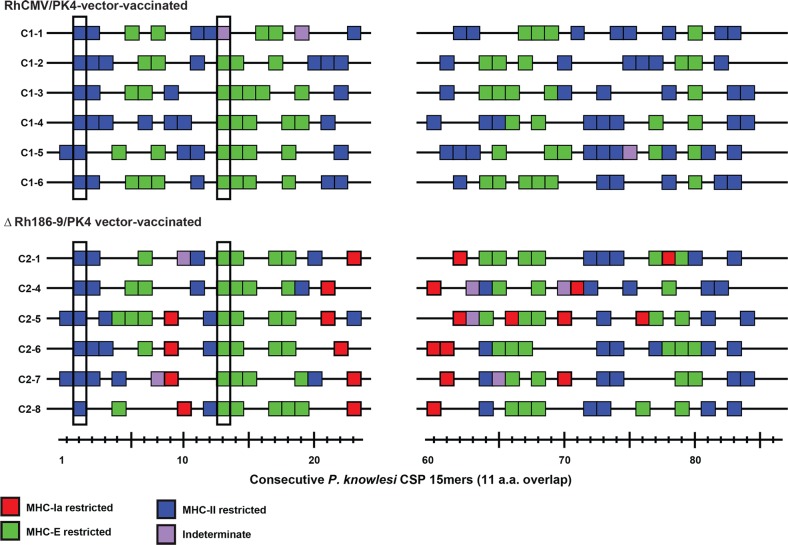
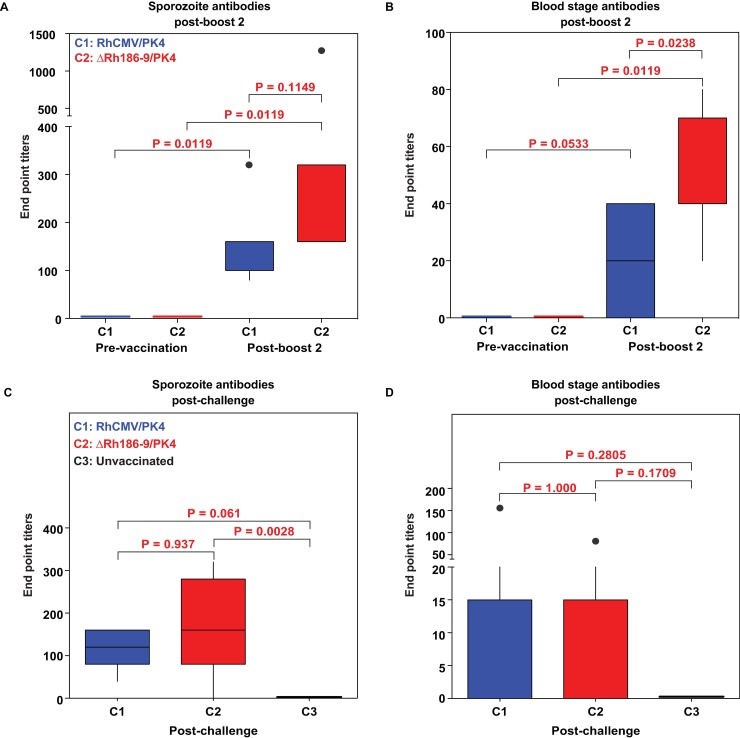
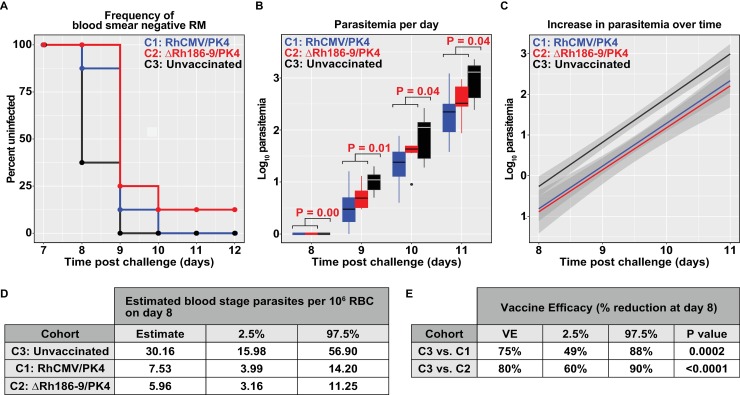
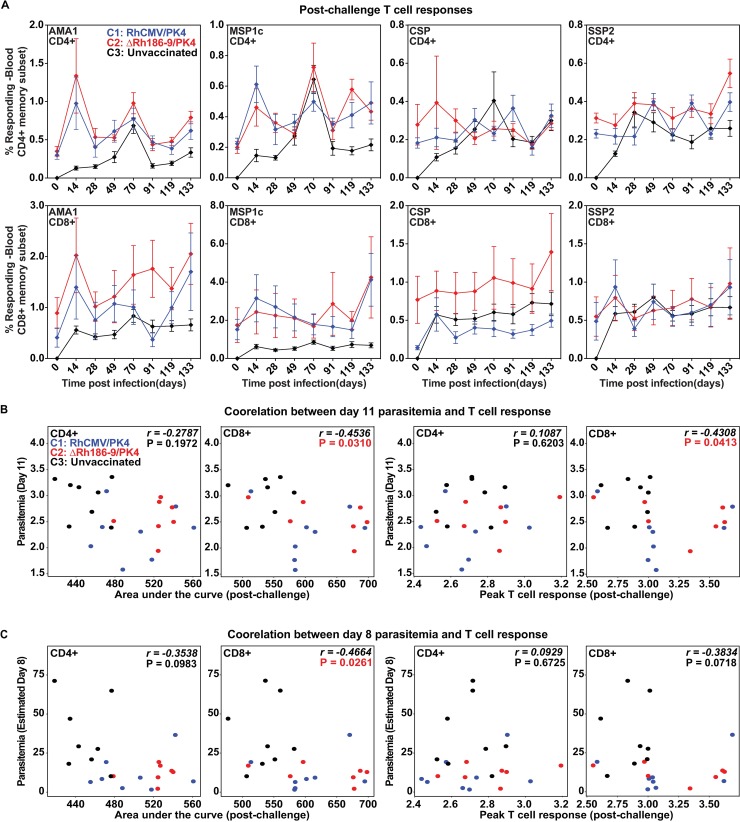
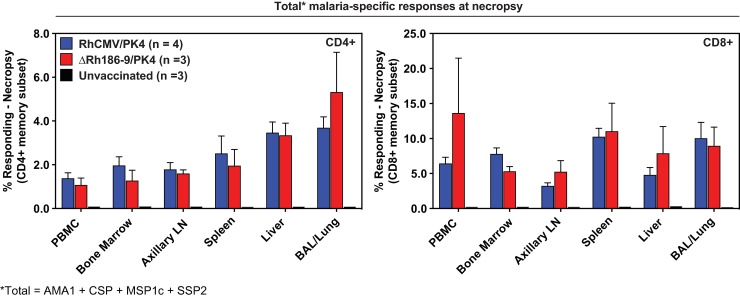
The development of a sterilizing vaccine against malaria remains one of the highest priorities for global health research. While sporozoite vaccines targeting the pre-erythrocytic stage show great promise, it has not been possible to maintain efficacy long-term, likely due to an inability of these vaccines to maintain effector memory T cell responses in the liver. Vaccines based on human cytomegalovirus (HCMV) might overcome this limitation since vectors based on rhesus CMV (RhCMV), the homologous virus in rhesus macaques (RM), elicit and indefinitely maintain high frequency, non-exhausted effector memory T cells in extralymphoid tissues, including the liver. Moreover, RhCMV strain 68-1 elicits CD8+ T cells broadly recognizing unconventional epitopes exclusively restricted by MHC-II and MHC-E. To evaluate the potential of these unique immune responses to protect against malaria, we expressed four Plasmodium knowlesi (Pk) antigens (CSP, AMA1, SSP2/TRAP, MSP1c) in RhCMV 68-1 or in Rh189-deleted 68-1, which additionally elicits canonical MHC-Ia-restricted CD8+ T cells. Upon inoculation of RM with either of these Pk Ag expressing RhCMV vaccines, we obtained T cell responses to each of the four Pk antigens. Upon challenge with Pk sporozoites we observed a delayed appearance of blood stage parasites in vaccinated RM consistent with a 75-80% reduction of parasite release from the liver. Moreover, the Rh189-deleted RhCMV/Pk vectors elicited sterile protection in one RM. Once in the blood, parasite growth was not affected. In contrast to T cell responses induced by Pk infection, RhCMV vectors maintained sustained T cell responses to all four malaria antigens in the liver post-challenge. The delayed appearance of blood stage parasites is thus likely due to a T cell-mediated inhibition of liver stage parasite development. As such, this vaccine approach can be used to efficiently test new T cell antigens, improve current vaccines targeting the liver stage and complement vaccines targeting erythrocytic antigens.


Conflict of interest statement

OHSU and Drs. Picker, Hansen, and Früh have a significant financial interest in VIR Biotechnology Inc., a company that may have a commercial interest in the results of this research and technology. The potential individual and institutional conflicts of interest have been reviewed and managed by OHSU. This does not alter our adherence to PLOS ONE policies on sharing data and materials.

Figures

Fig 1
Fig 1. RhCMV vectors expressing Pk antigens.
(A) Schematic of the Pk antigen expression cassettes inserted into the RhCMV genome. Expression cassettes containing the HCMV gH promoter and codon-optimized synthetic Pk genes encoding for the proteins AMA1, CSP, MSP1c (carboxy-terminal 42 kDa fragment), or SSP2 were inserted into the Rh211 gene (US27 in HCMV) to generate the RhCMV/PK4 panel. To generate the ΔRh186-9/PK4 panel, the expression cassettes were used to replace the gene region Rh186-189 encoding the RhCMV homologs of HCMV US8-11. To facilitate detection, the PK4 antigens were fused to the FLAG epitope sequence at their carboxy-terminus. (B) Immunoblots of Pk antigen expression by RhCMV vectors. Lysates of rhesus fibroblasts infected (MOI = 3) for 24 hours with RhCMV/PK4 or ΔRh186-9/PK4, or RhCMV/SIVgag included as control, were separated by SDS-PAGE and immunoblotted using anti-FLAG antibody. The molecular weight of control proteins is indicated. The left and right panels show the uncropped images of immunoblots of two different gels containing cell lysates that were from the same experiment. The exposure time for each blot was adjusted for optimal detection, with the left panel proteins being detectable after shorter exposure than the proteins shown on the right.
Fig 2
Fig 2. T cell responses to Pk antigens.
Frequencies of Pk Ag-specific CD4+ and CD8+ T cells in the blood of animals inoculated with 5x10⁶ PFU of each of the four RhCMV/PK4 recombinants (A) or ΔRh186-9/PK4 recombinants (B) at day 0 and with RhCMV/PK4 on days 98 and 189. The percentage of CD4+ or CD8+ T cells (corrected for memory T cells) responding to each of the four Pk antigens were measured by ICS using overlapping peptide pools at the indicated days. T cell responses are shown for each antigen in each individual animal over time.
Fig 3
Fig 3. Impact of boosting on T cell responses elicited by RhCMV/PK4 and ΔRh186-9/PK4.
(A, B) Average frequencies of T cell responses to each of the antigens in cohort 1 (A) or cohort 2 (B) over time. (C-F) Impact of boosting on T cell responses. Statistical analysis of T cell response magnitudes, as determined by measuring the areas under the log10 curve (AUC) of T cell frequencies in each individual RM to all antigens determined by ICS. The boxplots show the median (horizontal line), interquartile range (shaded box), and range (whiskers and outlier points) of the total T cell responses to all antigens. Statistical significance was determined by Wilcoxon test. (C, D) Comparison of the AUC prior to the 1st boost and between boost 1 and 2 within cohort 1 (C) or cohort 2 (D). (E, F) Comparison of the AUC between boost 1 and 2 versus post-boost 2 within cohort 1 (E) or cohort 2 (D) over 91 days between boosts and for 84 days post boost 2.
Fig 4
Fig 4. Memory phenotype and cytokine production by Pk-antigen specific T cells elicited by RhCMV.
(A) Boxplots comparing the memory differentiation of the RhCMV/PK4 or ΔRh186-9/PK4-elicited CD4+ and CD8+ memory T cells in peripheral blood responding to each Pk antigen with TNF-α and/or IFN-γ production after the 2nd boost (day 259). Memory differentiation state was based on CD28 vs. CCR7 expression, delineating central memory (TCM), transitional effector memory (TTREM), and effector memory (TEM), as designated. (B) Boxplots comparing the frequency of vaccine-elicited CD4+ and CD8+ memory T cells in peripheral blood responding to each of the Pk antigens with production of TNF-α, IFN-γ, IL-2 or MIP-1β, alone and in all combinations.
Fig 5
Fig 5. MHC restriction analysis of RhCMV/CSP and ΔRh186-9/CSP-elicited CD8+ T cell responses.
CSP-specific CD8+ T cells were epitope-mapped in six animals of each cohort 1 (upper panel) and 2 (lower panel) using flow cytometric ICS to detect recognition of each consecutive, overlapping 15mer peptide comprising the indicated amino-terminal and carboxy-terminal region of Pk CSP. Peptides resulting in specific CD8+ T cell responses are indicated by a box, with the color of the box designating MHC restriction as determined by blocking with the anti-pan-MHC-I mAb W6/32, the MHC-E blocking peptide VL9 and the MHC-II blocking peptide CLIP as previously described [28, 29]. Highlighted are peptides recognized by T cells in every animal.
Fig 6
Fig 6. Antibody responses to P. knowlesi sporozoites and blood stage parasites.
(A, B) Endpoint titers of IgG antibodies in serum collected from cohort 1 (RhCMV/PK4) or cohort 2 (ΔRh186-9/PK4) prior to immunization on day 0 or on day 203 (post-2nd boost). Pk parasite stage-specific antibodies were measured by IFA to Pk Spz (A) and to Pk-infected RBC (B). (C, D) Endpoint titers to Spz (C) and blood stage parasites (D) determined by IFA at day 14 post-challenge for each animal in the indicated cohorts. Statistical significance for differences in Spz or blood stage antibody titers measured by IFA was determined using the Wilcoxon test. Unadjusted Wilcoxon test p-values comparing IFA results across groups are displayed as boxplots showing the median (horizontal line), interquartile range (box), and range (whiskers and outlier points).
Fig 7
Fig 7. Blood stage parasitemia upon Spz challenge.
Each cohort was challenged with 100 Spz at day 0 and blood stage parasitemia was monitored daily by Giemsa stained thin blood smears starting at day 6 post-challenge. (A) Percent of animals without detectable parasitemia at the indicated days post-challenge. The percentage of uninfected RM is shown for each cohort: C1 = animals immunized with the RhCMV/PK4 vector panel, C2 = animals immunized with the ΔRh186-9/PK4 panel, C3 = non-immunized animals. (B) Boxplots of log10 parasitemia per 20,000 RBC at the indicated days show the median (horizontal line), interquartile range (shaded box), and range (whiskers and outlier points) among RM with detectable parasitemia, by day. Statistical significance as determined by unadjusted Wilcoxon test of C1 and C2 versus group C3 is shown above each plot. (C) Linear model fit to the log10-transformed parasitemia values with shaded bands indicating pointwise 95% confidence interval. The parasitemia data to days 8–11 fit a linear regression model and the intercepts for each of the vaccine groups differ significantly (P<0.0001, ANOVA F test, see Methods) from the control group whereas the slopes did not differ (P = 0.9262). This corresponds to an impact on the number of parasites present on day 8. (D) Estimated mean day 8 parasitemia by group and 95% confidence interval are shown in units of 106 RBC. These are estimated from the coefficients of the group terms in a simple linear model relating parasitemia over days 8–11 post-challenge to day and group, as described in Methods. (E) Estimated percent reduction in mean day 8 parasitemia by treated group when compared to control RM, with 95% confidence intervals. These are estimated from the coefficients of the group terms in a simple linear model relating parasitemia over days 8–11 post-challenge to day and group, as described in Methods.
Fig 8
Fig 8. Immune responses in response to parasite challenge.
Animals in cohorts 1 and 2 were challenged with 100 PK Spz on day 273 after the first inoculation with RhCMV vectors. Animals in cohort 3 were challenged on the same day. AA) Average CD8+ and CD4+ T cell response frequencies (+/- SD) for each of the four antigens measured in the PBMC of the indicated cohorts by ICS at the indicated time points post-challenge. (B) Post-challenge CD8+ T cell levels correlate with reduced viremia. Scatterplots show association between post-challenge area under the ICS response measurement curve (AUC, left) or the Peak T cell response (right) versus observed Day 11 parasitemia (B) or estimated Day 8 parasitemia (C). Spearman rho (r) values and corresponding p-values shown on each panel indicate significant inverse correlations between CD8+ T cell responses and parasitemia outcome.
Fig 9
Fig 9. Post-challenge analysis of combined PK4-specific CD4+ and CD8+ T cell responses in individual tissues.
Flow cytometric ICS results of peripheral blood and tissue CD94+ and CD8+ T cell responses to the peptide mixes comprising each of the four PK antigens in 4 animals of cohort 1 (RhCMV/PK4), three animals of cohort 2 (ΔRh186-9/PK4) and three animals of control cohort 3. The sum of average response frequencies (+SEM), corrected for memory T cells, is shown for the indicated tissues. T cell response frequencies in the control cohort were below the detection limit.

Similar articles

Cited by

References

    1. WHO. World Malaria Report 2014. 2014; Available from: http://www.who.int/malaria/publications/world_malaria_report_2014/report/en.
    1. Plowe CV, Alonso P, Hoffman SL. The potential role of vaccines in the elimination of falciparum malaria and the eventual eradication of malaria. J Infect Dis. 2009. December 1;200(11):1646–9. 10.1086/646613 - DOI - PubMed
    1. Singh B, Daneshvar C. Human infections and detection of Plasmodium knowlesi. Clin Microbiol Rev. 2013. April;26(2):165–84. 10.1128/CMR.00079-12 - DOI - PMC - PubMed
    1. Offeddu V, Thathy V, Marsh K, Matuschewski K. Naturally acquired immune responses against Plasmodium falciparum sporozoites and liver infection. Int J Parasitol. 2012. May 15;42(6):535–48. 10.1016/j.ijpara.2012.03.011 - DOI - PubMed
    1. Gupta S. Parasite immune escape: new views into host-parasite interactions. Curr Opin Microbiol. 2005. August;8(4):428–33. 10.1016/j.mib.2005.06.011 - DOI - PubMed

Publication types

MeSH terms