. 2019 Jan;565(7740):511-515.
doi: 10.1038/s41586-019-0874-3. Epub 2019 Jan 16.

HIF-1α metabolically controls collagen synthesis and modification in chondrocytes

Affiliations

HIF-1α metabolically controls collagen synthesis and modification in chondrocytes

Steve Stegen et al. Nature. 2019 Jan.

Abstract

Endochondral ossification, an important process in vertebrate bone formation, is highly dependent on correct functioning of growth plate chondrocytes1. Proliferation of these cells determines longitudinal bone growth and the matrix deposited provides a scaffold for future bone formation. However, these two energy-dependent anabolic processes occur in an avascular environment1,2. In addition, the centre of the expanding growth plate becomes hypoxic, and local activation of the hypoxia-inducible transcription factor HIF-1α is necessary for chondrocyte survival by unidentified cell-intrinsic mechanisms3-6. It is unknown whether there is a requirement for restriction of HIF-1α signalling in the other regions of the growth plate and whether chondrocyte metabolism controls cell function. Here we show that prolonged HIF-1α signalling in chondrocytes leads to skeletal dysplasia by interfering with cellular bioenergetics and biosynthesis. Decreased glucose oxidation results in an energy deficit, which limits proliferation, activates the unfolded protein response and reduces collagen synthesis. However, enhanced glutamine flux increases α-ketoglutarate levels, which in turn increases proline and lysine hydroxylation on collagen. This metabolically regulated collagen modification renders the cartilaginous matrix more resistant to protease-mediated degradation and thereby increases bone mass. Thus, inappropriate HIF-1α signalling results in skeletal dysplasia caused by collagen overmodification, an effect that may also contribute to other diseases involving the extracellular matrix such as cancer and fibrosis.


Figures
Extended Data Figure 1.
Extended Data Figure 1.. Phenotype of Phd2chon- mice
(a) Southern blot analysis showing efficient and selective recombination (black arrowhead) of the Phd2 gene in neonatal (P2.5) growth plate tissue from Phd2chon- mice. Representative images of 3 independent experiments are shown. (b) Phd1, Phd2 and Phd3 mRNA levels in neonatal growth plates (n= independent samples from 11 Phd2chon+ and 10 Phd2chon- mice). (c-d) Immunoblot of PHD2 and β-actin (c), and of HIF-1α, HIF-2α and Lamin A/C (d) levels in growth plate tissue (c) and cultured chondrocytes (d). Representative images of 4 independent experiments are shown. (e) Quantification of tibia length (n=11 Phd2chon+ − 8 Phd2chon- mice), body weight (n=11 Phd2chon+ − 8 Phd2chon- mice), lean body mass (n=4 mice) and fat mass (n=4 mice) of adult (14-week-old) mice. (f) Growth-related phenotype in adult Phd2chon- mice. (g) Sox9, Col2, Col10, Pthrp, Ihh, Mmp9, Mmp13 and Opn mRNA levels in neonatal growth plates (n= independent samples from 11 Phd2chon+ and 10 Phd2chon- mice). (h) In situ hybridization for Col2, Col10, Pthrp and Ihh on neonatal growth plates (n=4 biologically independent samples; scale bar is 250 μm). (i) Quantification of trabecular number (Tb.N; for P2.5, n=10 mice, for 14 weeks, n=11 Phd2chon+ − 8 Phd2chon- mice) and thickness (Tb.Th; for P2.5, n=10 mice, for 14 weeks, n=11 Phd2chon+ − 8 Phd2chon- mice), cortical thickness (Ct.Th; for P2.5, n=10 mice, for 14 weeks, n=11 Phd2chon+ − 8 Phd2chon- mice), calvarial thickness (calv.Th; n=4 mice) and porosity (calv.Po; n=4 mice) in neonatal and adult mice. Nd is not determined. (j) Quantification of osteoblast number (N.Ob/B.S; n=4 Phd2chon+ − 5 Phd2chon- mice), osteoblast surface (Ob.S/B.S; n=4 Phd2chon+ − 5 Phd2chon- mice) and osteoid surface per bone surface (O.S/B.S; n=6 mice), bone formation rate (BFR; n=4 mice), mineral apposition rate (MAR; n=4 mice), osteoclast surface per bone surface (Oc.S/B.S; n=11 Phd2chon+ − 7 Phd2chon- mice), blood vessel number per tissue surface (N.BV/T.S; ; n=9 Phd2chon+ − 6 Phd2chon- mice), and serum osteocalcin (OCN; n=16 biologically independent samples), CTx-I (n=8 biologically independent samples) and CTx-II levels (n=9 biologically independent samples) in adult mice. (k-l) Representative images of TRAP-positive multinuclear cells formed after one week of culture (k) with quantification (l) of the number of osteoclasts formed per well (n=4 biologically independent samples; scale bar is 50 μm). Quantification was based on the number of nuclei per osteoclast. (m) Type I collagen (COL1) and COL2 immunostaining of the metaphysis of neonatal mice (n=8 mice). Scale bar is 100 μm. (n) Quantification of the cell/extracellular matrix (ECM) ratio in two zones of the growth plate (n=8 mice). Data are means ± SEM in (c, d, l), or means ± SD in (b, e, g, i, j, n). *p<0.05 vs. Phd2chon+, **p<0.01 vs. Phd2chon+, ***p<0.001 vs. Phd2chon+ (two-sided Student’s t-test). Exact p values: 0.000000001 (Phd2; b), 0.00000002 (Phd3; b), 0.00003 (c), 0.0014 (HIF-1α; d), 0.00005 (tibia length; e), 0.019 (body weight; e), 0.00003 (Tb.N P2.5; i), 0.003 (Tb.N 14 weeks; i), 0.006 (Tb.Th P2.5; i), 0.037 (Tb.Th 14 weeks; i) or 0.02 (Serum CTx-II; j).
Extended Data Figure 2.
Extended Data Figure 2.. Metabolic alterations in PHD2-deficient chondrocytes
(a) Rhodamine labelling of mitochondria, with quantification of mitochondrial content (n= samples from 3 Phd2chon+ and 4 Phd2chon- mice). Yellow line denotes cell membrane. (b-c) Immunoblot of C-MYC (b), LC3-II (c) and β-actin levels in cultured chondrocytes. Representative images of 4 independent experiments are shown. (d) Oxygen consumption in cultured chondrocytes (n=9 biologically independent samples). (e) Pimonidazole immunostaining on neonatal (P2.5) growth plates, with a higher magnification of the boxed area and quantification of pimonidazole-positive cells within the growth plate (n=4 mice). (f) Glucose oxidation (GO), fatty acid oxidation (FAO) and glutamine oxidation (QO) in cultured chondrocytes (n=6 biologically independent samples). (g) Glucose (Glc) uptake and lactate (Lac) secretion (n=6 biologically independent samples). (h) Glycolytic flux (n=6 biologically independent samples). (i) Fractional contribution of 13C6- Glc to Lac, citrate (Cit), α-ketoglutarate (αKG), succinate (Suc), fumarate (Fum) and malate (Mal) (n=6 biologically independent samples). (j-l) ATP content (j), energy charge ([ATP] + ½ [ADP] / [ATP] + [ADP] + [AMP]; k), and energy status (ratio of ATP to AMP levels; l) (n=6 biologically independent samples). (m) Apoptosis rate of cultured chondrocytes (n=4 independent experiments). (n) TUNEL immunostaining of neonatal growth plates (n=6 mice). (o) ATP production resulting from glycolysis, GO, FAO and QO in cultured chondrocytes (n=6 biologically independent samples. (p) Proliferation rate of cultured chondrocytes (n=4 independent experiments). (q) Immunoblot of Na+/K+ ATPase and β-actin levels. Representative images of 3 independent experiments are shown. (r) Normalized Ca2+-rise in the cytosol of cultured chondrocytes upon stimulation with thapsigargin (TG) in the presence of EGTA (n=4 biologically independent samples). (s) Quantification of the Ca2+ release from the endoplasmic reticulum (ER) upon stimulation with TG (n=4 biologically independent samples). (t) 45Ca2+ loading capacity of the ER of permeabilised chondrocytes in intracellular-like medium supplemented with 5 mM Mg/ATP and 45Ca2+ (n=4 biologically independent samples). (u-v) Total protein (u) and proteoglycan synthesis (v) (n=8 biologically independent samples). Data are means ± SEM in (a-d, f-m, o-v), or means ± SD in (e, n). *p<0.05 vs. Phd2chon+, **p<0.01 vs. Phd2chon+, ***p<0.001 vs. Phd2chon+ (two-sided Student’s t-test), §p<0.05 vs. Phd2chon+-veh (ANOVA). Exact p values: 0.03 (a); 0.016 (b); Phd2chon+-veh vs. Phd2chon--veh 0.0004 (c); Phd2chon+-veh vs. Phd2chon--chloroquine 0.0002 (c); 0.000002 (d); 0.0005 (e); 0.00003 (GO; f); 0.000004 (FAO; f); 0.00001 (Glc; g); 0.000001 (Lac; g); 0.0007 (h); 0.00002 (Lac; i); 0.000002 (Cit; i); 0.000001 (αKG; i); 0.00009 (Suc; i); 0.011 (Fum; i); 0.004 (Mal; i); 0.000001 (j); 0.00005 (k); 0.00000001 (l); 0.0007 (p); 0.012 (q); 0.0003 (s); 0.0002 (u); 0.003 (v). Scale bar in (a) is 10 μm, and scale bars in (e, n) are 250 μm.
Extended Data Figure 3.
Extended Data Figure 3.. HIF-1α silencing in PHD2-deficient chondrocytes
(a) Expression of indicated genes in cultured chondrocytes, transduced with scrambled shRNA (shScr; -) or shRNA against HIF-1α (shHIF-1α) (n=3 biologically independent samples). (b) HIF-1α and Lamin A/C immunoblot of cultured chondrocytes, transduced with shScr or shHIF-1α. Representative images of 3 independent experiments are shown. (c-f) Oxygen consumption (c), glycolytic flux (d), energy charge (e) and energy status (f) of cultured chondrocytes, transduced with shScr or shHIF-1α (n=6 biologically independent samples). (g) P-AMPKT172 and AMPK immunoblot with quantification of p-AMPKT172 to AMPK ratio in cultured chondrocytes, transduced with shScr or shHIF-1α. Representative images of 3 independent experiments are shown. (h-i) Proliferation (h) and collagen synthesis (i) in cultured chondrocytes, transduced with shScr or shHIF-1α (n=6 biologically independent samples). (j-k) BiP (j), cleaved (c)ATF6 (k) and β-actin immunoblot of cultured chondrocytes, transduced with shScr or shHIF-1α. Representative images of 3 independent experiments are shown. (l-m) Hydroxyproline (OH-Pro) (l; n=6 biologically independent samples) and α-ketoglutarate (αKG) levels (m; n=5 biologically independent samples) in cultured chondrocytes, transduced with shScr or shHIF-1α. Data are means ± SEM. #p<0.05 (ANOVA), §p<0.05 vs. Phd2chon+-shScr, °p<0.05 vs. Phd2chon--shScr (ANOVA). Exact p values: Phd2chon+-shScr vs. Phd2chon+-shHIF-1α 0.0003 (b) or 0.002 (c); Phd2chon+-shScr vs. Phd2chon--shScr 0.050 (b), 0.0000002 (c), 0.00003 (d), 0.004 (e), 0.000002 (f), 0.050 (g), 0.00002 (h), 0.00005 (i), 0.004 (j), 0.03 (k), 0.00012 (l) or 0.00005 (m); Phd2chon--shScr vs. Phd2chon--shHIF-1α 0.045 (b), 0.00010 (c), 0.00011 (d), 0.0010 (e), 0.000012 (f), 0.03 (g), 0.00005 (h), 0.00010 (i), 0.004 (j), 0.006 (k), 0.00001 (l) or 0.0008 (m).
Extended Data Figure 4.
Extended Data Figure 4.. mTOR signalling and the unfolded protein response in PHD2-deficient chondrocytes
(a) Immunoblot and quantification of phosphorylated (at Serine 2448) mTOR (p-mTORS2448), mTOR, phosphorylated (at Threonine 389 and Serine 371) p70 S6 kinase (p-p70 S6KT389 and p-p70 S6KS371), p70 S6K, phosphorylated (at Serine 235 and 236) S6 (p-S6S235/236) and S6, phosphorylated (at Threonine 37 and 46) 4E-BP1 (p-4E-BP1T37/46), 4E-BP1 and β-actin in cultured chondrocytes. Representative images of 3 independent experiments are shown. (b-c) p-S6S235/236 immunostaining on neonatal (P2.5) growth plates (b), with a higher magnification of the boxed area and quantification (c) of the p-S6+ area (n=6 mice). GP is growth plate, PS is primary spongiosa. (d) Immunoblot of p-S6S235/236 and S6 in cultured chondrocytes. Cells were either cultured in full medium or in nutrient-deprived conditions (PBS), and then switched to full medium for indicated times. Representative images of 3 independent experiments are shown. These data show the absence of enhanced mTOR signalling. (e) Immunoblot and quantification of BiP, (p-)eIF2α, ATF4 and cleaved (c)ATF6 protein levels. Representative images of 3 independent experiments are shown. (f) Spliced Xbp-1 (Xbp-1s) mRNA levels in neonatal growth plates (n=8 biologically independent samples). (g-h) BiP and cATF6 immunostaining (g) of neonatal growth plates with quantification (h) of the percentage of positive cells (n=6 mice). Data are means ± SEM in (a, d, e), or means ± SD in (c, f, h). *p<0.05 vs. Phd2chon+, **p<0.01 vs. Phd2chon+, ***p<0.001 vs. Phd2chon+ (two-sided Student’s t-test), §p<0.05 vs. Phd2chon+-full medium, °p<0.05 vs. Phd2chon+-full medium 0.5 h (ANOVA). Exact p values: Phd2chon+-full vs. Phd2chon+-PBS 0.003 (d); Phd2chon+-full vs. Phd2chon--PBS 0.005 (d), Phd2chon+-full vs. Phd2chon−−0.5 h 0.03 (d); Phd2chon+−0.5 h vs. Phd2chon−−0.5 h 0.04 (d); 0.04 (BiP; e); 0.02 (p-eIF2a; e); 0.0005 (ATF4; e); 0.02 (cATF6; e); 0.002 (f); 0.00005 (BiP; h); 0.000009 (cATF6; h). Scale bars are 250 μm.
Extended Data Figure 5.
Extended Data Figure 5.. PHD2 controls type II collagen (COL2) modifications
(a) COL2 protein levels in neonatal (P2.5) growth plates, visualized by COL2 Western Blot. Protein loading was normalized to growth plate weight. Representative images of 2 experiments, each with 2 biologically independent replicates, are shown. (b) COL2 immunostaining of extracellular matrix produced by cultured chondrocytes and after removal of cells, with quantification of the COL2 positive area (n=4 mice). (c) Amide I peak (area under the curve, AUC), representing collagen, from FT-IR spectra of neonatal growth plates (n= samples from 8 Phd2chon+ and 6 Phd2chon- mice). (d) Transmission electron microscopy images of the collagen network in neonatal growth plates (n=3 mice). (e) Increase in hydroxylation and/or glycosylation (as %) of proline (Pro) and lysine (Lys) residues in type II collagen of Phd2chon- mice compared to Phd2chon+ mice (n=4 biologically independent samples). Glcgal is glucosyl-galactosyl. (f) Total, intracellular and extracellular hydroxyproline (OH-Pro) content of cultured chondrocytes (n=4 biologically independent samples). (g) Von Kossa staining of neonatal growth plates, with quantification of the percentage mineralized matrix (n=8 mice, boxed areas are enlarged). (h-i) Micromass mineralization, as evidenced by Alizarin Red (AR) staining (h), with quantification of AR intensity (i) (n=5 biologically independent samples) showing that increased matrix mineralization is not caused by HIF-1α-induced changes in mineralization capacity. (j) Expression of genes involved in mineralization (Ank, Tnap, Enpp1 and Spp1) is not changed in neonatal growth plates (n=6 biologically independent samples). (k) Phd2 mRNA levels in cultured periosteum-derived cells (PDC), calvarial osteoblasts (calv. OB) and trabecular (trab.) OB (n=4 biologically independent samples). (l) Change in hydroxylation and/or glycosylation (as %) of proline (OH-Pro) and lysine (OH-Lys) residues in type I collagen of Phd2chon- mice compared to Phd2chon+ mice (n=4 biologically independent samples). (m) OH-Pro levels in cultured PDC, and calvarial and trabecular osteoblasts (n=4 biologically independent samples). (n) OH-Pro content in bone tissue and supernatant, after incubation with MMP9 or MMP13 (n=4 biologically independent samples). (o) Fractional contribution of 13C5-glutamine (Gln) to proline (n=3 biologically independent samples). (p) Intracellular proline levels in cultured Phd2chon+ and Phd2chon- chondrocytes (n=3 biologically independent samples). Data are means ± SD in (a, c, g, j), or means ± SEM in (b, f, i, k-p). *p<0.05 vs. Phd2chon+, **p<0.01 vs. Phd2chon+, ***p<0.001 vs. Phd2chon+ (two-sided Student’s t-test), #p<0.05 (ANOVA). Exact p values: 0.0003 (a); 0.02 (b); 0.006 (c); 0.0018 (Pro459; e); 0.008 (Pro744; e); 0.014 (Pro795; e); 0.015 (Pro826; e); 0.016 (Pro945; e); 0.00015 (Pro966; e); 0.008 (Pro986; e); 0.019 (Lys87; e); 0.002 (total; f); 0.0014 (extra; f); 0.012 (g); vehicle vs. Phd2chon+ 0.0002 (i); IOX2 vs. Phd2chon- 0.0001 (i); Phd2chon+ vs. Phd2chon- 0.004 (i); 0.015 (Pro1011; l); 0.012 (Lys174; l). Scale bar in (b) is 50 μm, 0.5 μm in (d), and 100 μm in (g).
Extended Data Figure 6.
Extended Data Figure 6.. Genetic confirmation of HIF-1α signalling and metabolic adaptations
(a-c) Immunoblot of HIF-1α (a), GLS1 (b), PDK1 (c), Lamin A/C and β-actin in cultured control or PHD2-deficient (PHD2KD) periosteal cells, transduced with scrambled shRNA (shScr; -) or gene-specific shRNAs. Representative images of 3 independent experiments are shown. (d) Toluidine Blue staining of bone ossicles (n=5 biologically independent samples). Arrowheads indicate cartilage remnants (scale bar is 100 μm). (e) 3D CT models of bone ossicles, with quantification of the mineralized tissue volume (MV/TV) (n=5 biologically independent samples). (f-g) Immunoblot of GLS1 (f), PDK1 (g), and β-actin in cultured chondrocytes, transduced with shScr or gene-specific shRNAs. Representative images of 3 independent experiments are shown. (h) P-AMPKT172 and AMPK immunoblot with quantification of p-AMPKT172 to AMPK ratio in cultured chondrocytes, transduced with shScr or gene-specific shRNAs. Representative images of 3 independent experiments are shown. (i-k) Proliferation (i), α-ketoglutarate (αKG) levels (j) and hydroxyproline (OH-Pro) content (k) in cultured chondrocytes, transduced with shScr or gene-specific shRNAs (n=5 biologically independent samples). Data are means ± SEM in (a-c, f-k), or means ± SD in (e). #p<0.05 (ANOVA), §p<0.05 vs. control/Phd2chon+-shScr, °p<0.05 vs. PHD2KD/Phd2chon--shScr (ANOVA). Exact p values: control-shScr vs. control-gene specific shRNA 0.0005 (a), 0.0003 (b), 0.010 (c), 0.0004 (shHIF-1α; e) or 0.00012 (shGLS1; e); control-shScr vs. PHD2KD-shScr 0.02 (a), 0.04 (b), 0.046 (c) or 0.003 (e); PHD2KD-shScr vs. PHD2KD-gene specific shRNA 0.03 (a), 0.03 (b), 0.03 (c), 0.002 (shHIF-1α; e), 0.0005 (shGLS1; e), 0.049 (shPDK1; e); Phd2chon+-shScr vs. Phd2chon+-gene specific shRNA 0.000010 (shGLS1; f), 0.006 (shPDK1; g), 0.00011 (shGLS1; i), 0.002 (shGLS1;j) or 0.0006 (shGLS1; k); Phd2chon+-shScr vs. Phd2chon--shScr 0.0020 (f), 0.00010 (g), 0.006 (h), 0.00012 (i), 0.00011 (j) or 0.0002 (k); Phd2chon--shScr vs. Phd2chon--gene specific shRNA 0.005 (shGLS1; f), 0.00015 (shPDK1; g), 0.003 (shPDK1; h), 0.0002 (shPDK1; i), 0.00008 (shGLS1; j), 0.00010 (shGLS1; k) or 0.0006 (shPDK1; k); Phd2chon+-shScr vs. Phd2chon--gene specific shRNA 0.002 (shGLS1; h).
Extended Data Figure 7.
Extended Data Figure 7.. PHD2-deficient chondrocytes display enhanced glutamine metabolism
(a) Intracellular glutamate (Glu), α-ketoglutarate (αKG), succinate (Suc), fumarate (Fum), malate (Mal) and citrate (Cit) levels in cultured chondrocytes, with or without BPTES treatment (n=3 biologically independent samples). (b) Ratio of αKG/Suc and αKG/Fum (n=3 biologically independent samples). (c) GLS1 and β-actin immunoblot of cultured chondrocytes transduced with scrambled shRNA (shScr; -) or shRNA against HIF-1α (shHIF-1α). Representative images of 3 independent experiments are shown. (d) Immunoblot of GLS1, GLS2 and β-actin in cultured chondrocytes, compared to HeLa cells. Representative images of 3 independent experiments are shown. (e) Fractional contribution of 13C5-glutamine (Gln) to Glu, αKG, Suc, Fum, Mal and Cit in cultured chondrocytes, with or without BPTES treatment (n=3 biologically independent samples). (f) Citrate mass isotopomer distribution (MID) from 13C5-Gln (n=3 biologically independent samples). (g) Relative abundance of reductive carboxylation-specific mass isotopomers of Cit, Mal and Fum (n=3 biologically independent samples). (h) Type II collagen (COL2) immunostaining of the tibia of neonatal (P2.5) mice treated with BPTES and/or αKG with quantification of the percentage COL2-positive matrix (green) relative to bone volume (BV) (n=5 for Phd2chon+-veh or Phd2chon--veh mice; and n=7 for Phd2chon+-BPTES, Phd2chon+-BPTES+αKG, Phd2chon--BPTES or Phd2chon--BPTES+αKG mice). Scale bar is 250 μm, GP is growth plate, PS is primary spongiosa, arrowheads indicate COL2 cartilage remnants. (i) 3D microCT models of the tibial metaphysis of mice treated with BPTES, with or without αKG, and quantification of trabecular bone volume (TBV) (n=6 for Phd2chon+-veh, Phd2chon+-BPTES+αKG or Phd2chon--veh mice; n=5 for Phd2chon+-BPTES mice; and n=7 for Phd2chon--BPTES or Phd2chon--BPTES+αKG mice). (j) Immunoblot of HIF-1α and Lamin A/C in cultured chondrocytes treated with BPTES, with or without αKG. Representative images of 3 independent experiments are shown. (k) Relative mRNA levels of indicated genes in growth plates derived from mice treated with BPTES, with or without αKG (n=3 biologically independent samples). (l) Immunoblot of p-AMPKT172 and AMPK in cultured chondrocytes treated with BPTES, with or without αKG. Representative images of 3 independent experiments are shown. (m) Proliferation, as determined by BrdU incorporation, of cultured chondrocytes, treated with BPTES, with or without αKG (n=3 biologically independent samples). (n) Tibia length of mice treated with BPTES, with or without αKG (n=5 for Phd2chon+-veh or Phd2chon--veh mice; and n=7 for Phd2chon+-BPTES, Phd2chon+-BPTES+αKG, Phd2chon--BPTES or Phd2chon--BPTES+αKG mice). (o) BiP, cleaved (c)ATF6 and β-actin immunoblot in cultured chondrocytes treated with BPTES, with or without αKG. Representative images of 3 independent experiments are shown. Data are means ± SEM in (a-g, j, l, m, o), or means ± SD in (h, i, k, n). *p<0.05 vs. Phd2chon+, **p<0.01 vs. Phd2chon+, ***p<0.001 vs. Phd2chon+ (two-sided Student’s t-test), #p<0.05 (ANOVA), §p<0.05 vs. Phd2chon+-shScr/veh, °p<0.05 vs. Phd2chon--shScr/veh (ANOVA). Exact p values: Phd2chon+-veh vs. Phd2chon--veh 0.045 (αKG/Suc; b), 0.010 (αKG/Fum; b), 0.00008 (Glu; e), 0.00004 (αKG; e), 0.02 (Suc; e), 0.0007 (Fum; e), 0.009 (Mal; e), 0.050 (Cit; e), 0.00001 (h), 0.00003 (i), 0.03 (j), 0.0001 (P4ha1; k), 0.0006 (P4ha2; k), 0.00002 (P3h1; k), 0.0001 (Plod1; k), 0.0002 (Plod2; k), 0.0003 (Pdi; k), 0.0004 (Lox; k), 0.004 (l), 0.006 (m), 0.000002 (n), 0.0005 (BiP; o) or 0.002 (cATF6; o); Phd2chon+-veh vs. Phd2chon+-BPTES 0.00001 (Glu; e), 0.000003 (αKG; e), 0.02 (Suc; e), 0.0006 (Fum; e), 0.00005 (Mal; e), 0.02 (Cit; e), 0.00001 (h), 0.0001 (i), 0.002 (m) or 0.0000001 (n); Phd2chon+-BPTES vs. Phd2chon+-BPTES+αKG 0.004 (m) or 0.0003 (n); Phd2chon+-veh vs. Phd2chon--BPTES 0.03 (αKG/Fum; b), 0.005 (j), 0.0003 (P4ha1; k), 0.001 (P4ha2; k), 0.0006 (P3h1; k), 0.0001 (Plod1; k), 0.0006 (Plod2; k), 0.002 (Pdi; k), 0.0006 (Lox; k), 0.012 (l), 0.007 (m), 0.000007 (n), 0.003 (BiP; o) or 0.004 (cATF6; o); Phd2chon+-veh vs. Phd2chon--BPTES+αKG 0.00006 (h), 0.00002 (i), 0.03 (j), 0.0003 (P4ha1; k), 0.001 (P4ha2; k), 0.0001 (P3h1; k), 0.00008 (Plod1; k), 0.0007 (Plod2; k), 0.00003 (Pdi; k), 0.0003 (Lox; k), 0.04 (l), 0.019 (m), 0.000005 (n), 0.02 (BiP; o) or 0.0010 (cATF6; o); Phd2chon--veh vs. Phd2chon--BPTES 0.025 (αKG/Suc; b), 0.049 (αKG/Fum; b), 0.00001 (Glu; e), 0.00001 (αKG; e), 0.02 (Suc; e), 0.006 (Fum; e), 0.002 (Mal; e), 0.02 (Cit; e), 0.000002 (h) or 0.000005 (i); Phd2chon+-shScr vs. Phd2chon--shScr 0.007 (c); Phd2chon+-veh vs. Phd2chon+-shHIF-1α 0.006 (c); Phd2chon--veh vs. Phd2chon--shHIF-1α 0.013 (c); Phd2chon+ vs. Phd2chon- 0.007 (GLS1; d), 0.0013 (m+4; f), 0.0006 (m+5; f), 0.0006 (Cit; g), 0.0002 (Mal; g) or 0.048 (Fum; g); Phd2chon+ vs. HeLa 0.04 (GLS1; d) or 0.0088 (GLS2; d).
Extended Data Figure 8.
Extended Data Figure 8.. Inhibition of pyruvate uptake does not affect collagen or bone properties
(a) Intracellular α-ketoglutarate (αKG) levels in cultured chondrocytes, with or without treatment with an inhibitor of monocarboxylate transporter 2 (MCT2i) (n=3 biologically independent samples). (b) P-AMPKT172 and AMPK immunoblot with quantification of p-AMPKT172 to AMPK ratio in cultured chondrocytes treated with MCT2i. Representative images of 3 independent experiments are shown. (c) Tibia length of mice treated with MCT2i (n=5 mice). (d) Collagen synthesis in cultured chondrocytes, with or without MCT2i treatment (n=4 biologically independent samples). (e) BiP, cleaved (c)ATF6 and β-actin immunoblot in cultured chondrocytes treated with MCT2i. Representative images of 3 independent experiments are shown. (f) Hydroxyproline (OH-Pro) content in neonatal growth plates of mice treated with MCT2i (n=5 biologically independent samples). (g) Safranin O staining of the tibia of mice treated with MCT2i, and quantification of the percentage Safranin O (SafO) positive matrix relative to bone volume (BV) (n=5 mice). (h) Type II collagen (COL2) immunostaining of the tibia of mice treated with MCT2i, with quantification of the percentage COL2-positive matrix (green) relative to bone volume (n=5 mice). GP is growth plate, PS is primary spongiosa, arrowheads indicate COL2 cartilage remnants. (i) 3D microCT models of the tibial metaphysis of mice treated with MCT2i, and quantification of trabecular bone volume (TBV) (n=5 mice). Data are means ± SEM in (a-b, d-e), or means ± SD in (c, f-i). #p<0.05 (ANOVA), §p<0.05 vs. Phd2chon+-veh (ANOVA). Exact p values: Phd2chon+-veh vs. Phd2chon--veh 0.00002 (a), 0.015 (b), 0.00001 (c), 0.00011 (d), 0.012 (BiP; e), 0.008 (cATF6; e), 0.00012 (f), 0.00013 (g), 0.00001 (h) or 0.00001 (i); Phd2chon+-MCT2i vs. Phd2chon--MCT2i 0.0003 (a), 0.000002 (c), 0.005 (d) or 0.0003 (f); Phd2chon+-veh vs. Phd2chon--MCT2i 0.02 (b), 0.004 (BiP; e), 0.002 (cATF6; e), 0.00007 (g), 0.0001 (h) or 0.00002 (i). Scale bars in (g) and (h) are 250 μm.
Extended Data Figure 9.
Extended Data Figure 9.. Administration of α-ketoglutarate increases collagen hydroxylation and bone mass in wild-type mice
(a) Intracellular α-ketoglutarate (αKG) levels in cultured chondrocytes, with or without supplementation of dimethyl-αKG (hereafter αKG) (n=4 biologically independent samples). (b) P-AMPKT172 and AMPK immunoblot with quantification of p-AMPKT172 to AMPK ratio in cultured chondrocytes, with or without αKG supplementation. Representative images of 3 independent experiments are shown. (c) Tibia length of mice treated with αKG (n=5 mice). (d) Collagen synthesis in cultured chondrocytes, with or without αKG supplementation (n=4 biologically independent samples). (e) Immunoblot of BiP, cleaved (c)ATF6 and β-actin in cultured chondrocytes, with or without αKG supplementation. Representative images of 3 independent experiments are shown. (f) Hydroxyproline (OH-Pro) content in neonatal growth plates of mice treated with αKG (n=5 biologically independent samples). (g) Safranin O staining of the tibia of mice treated with αKG, and quantification of the percentage Safranin O (SafO) positive matrix relative to bone volume (BV) (n=5 mice). (h) Type II collagen (COL2) immunostaining of the tibia of mice treated with αKG, with quantification of the percentage COL2-positive matrix (green) relative to bone volume (n=5 mice). GP is growth plate, PS is primary spongiosa, arrowheads indicate COL2 cartilage remnants. (i) 3D microCT models of the tibial metaphysis of mice treated with αKG, and quantification of trabecular bone volume (TBV) (n=5 mice). (j) Immunoblot of HIF-1α and Lamin A/C in cultured chondrocytes, with or without αKG supplementation. Representative images of 3 independent experiments are shown. (k) Relative mRNA levels of indicated genes in growth plates derived from mice treated with αKG (n=3 biologically independent samples). Data are means ± SEM in (a-b, d-e, j), or means ± SD in (c, f-i, k). #p<0.05 (ANOVA), §p<0.05 vs. Phd2chon+-veh (ANOVA). Exact p values: Phd2chon+-veh vs. Phd2chon--veh 0.000001 (a), 0.04 (b), 0.00000001 (c), 0.002 (d), 0.046 (BiP; e), 0.011 (cATF6; e), 0.0003 (f), 0.0002 (g), 0.000004 (h), 0.00002 (i), 0.03 (j), 0.00008 (P4ha1; k), 0.0007 (P4ha2; k), 0.0003 (P3h1; k), 0.004 (Plod1; k), 0.0005 (Plod2; k), 0.0005 (Pdi; k) or 0.002 (Lox; k); Phd2chon+-veh vs. Phd2chon+-αKG 0.000007 (a), 0.02 (f), 0.006 (g), 0.00002 (h) or 0.0003 (i); Phd2chon+-veh vs. Phd2chon--αKG 0.02 (b), 0.008 (BiP; e), 0.02 (cATF6; e), 0.005 (f), 0.0003 (g), 0.000002 (h), 0.000003 (i), 0.010 (j), 0.0010 (P4ha1; k), 0.002 (P4ha2; k), 0.0011 (P3h1; k), 0.02 (Plod1; k), 0.00001 (Plod2; k), 0.007 (Pdi; k) or 0.004 (Lox; k); Phd2chon+-αKG vs. Phd2chon--αKG 0.0002 (a), 0.00000007 (c) or 0.002 (d); Phd2chon--veh vs. Phd2chon--αKG 0.003 (a). Scale bars in (g) and (h) are 250 μm.
Extended Data Figure 10.
Extended Data Figure 10.. Normalization of glucose oxidation corrects the energy deficit in PHD2-deficient chondrocytes
(a-e) Glucose oxidation (a), oxygen consumption (b), palmitate oxidation (c), glutamine oxidation (d) and glycolytic flux (e) in cultured chondrocytes, with or without DCA treatment (n=6 biologically independent samples for a, n=3 biologically independent samples for b-e). (f) Proliferation, as determined by BrdU incorporation, of cultured chondrocytes, with or without DCA treatment (n=3 biologically independent samples). (g) Tibia length of mice treated with DCA (n=5 Phd2chon+-veh, Phd2chon--veh or Phd2chon--DCA mice - n=7 Phd2chon+-DCA). (h-i) BiP (h), cleaved (c)ATF6 (i) and β-actin immunoblot in cultured DCA-treated chondrocytes. Representative images of 3 independent experiments are shown. (j) Hydroxyproline (OH-Pro) content in neonatal growth plates of mice treated with DCA, with or without BPTES (n=5 from Phd2chon+-veh or Phd2chon--veh mice - n=7 from Phd2chon+-DCA, Phd2chon+-DCA+BPTES, Phd2chon--DCA or Phd2chon--DCA+BPTES mice). (k) Type II collagen (COL2) immunostaining of the tibia of mice treated with DCA, with or without BPTES with quantification of the percentage COL2-positive matrix (green) relative to bone volume (BV) (n=5 from Phd2chon+-veh mice - n=7 from Phd2chon--veh, Phd2chon+-DCA, Phd2chon+-DCA+BPTES, Phd2chon--DCA or Phd2chon--DCA+BPTES mice). Scale bar is 250 μm, GP is growth plate, PS is primary spongiosa, arrowheads indicate COL2 cartilage remnants. (l) 3D microCT models of the tibial metaphysis of mice treated with DCA, with or without BPTES, and quantification of trabecular bone volume (TBV) (n=5 from Phd2chon+-veh or Phd2chon--veh mice - n=7 from Phd2chon+-DCA, Phd2chon+-DCA+BPTES, Phd2chon--DCA or Phd2chon--DCA+BPTES mice). (m) Intracellular α-ketoglutarate (αKG) levels in cultured chondrocytes treated with DCA, with or without BPTES (n=4 biologically independent samples). (n) Relative mRNA levels of indicated genes in growth plates derived from mice treated with DCA, with or without BPTES (n=3 biologically independent samples). Data are means ± SEM in (a-f, h-i, m), or means ± SD in (g, j-l, n). #p<0.05 (ANOVA), §p<0.05 vs. Phd2chon+-veh, °p<0.05 vs. Phd2chon--veh (ANOVA). Exact p values: Phd2chon+-veh vs. Phd2chon--veh 0.00002 (a), 0.0006 (b), 0.0009 (c), 0.0096 (e), 0.003 (f), 0.00006 (g), 0.003 (h), 0.005 (i), 0.0003 (j), 0.0000004 (k), 0.0002 (l), 0.002 (m), 0.00008 (P4ha1; n), 0.00003 (P4ha2; n), 0.0004 (P3h1; n), 0.004 (Plod1; n), 0.005 (Plod2; n), 0.0002 (Pdi; n) or 0.002 (Lox; n); Phd2chon+-veh vs. Phd2chon+-DCA 0.003 (a); Phd2chon--veh vs. Phd2chon--DCA 0.0003 (a), 0.002 (b), 0.003 (e), 0.02 (f), 0.00012 (g), 0.004 (h), 0.005 (i), 0.000003 (k) or 0.0001 (l); Phd2chon+-veh vs. Phd2chon--DCA 0.005 (c), 0.000008 (j), 0.0000002 (k), 0.00005 (l), 0.0004 (m), 0.0002 (P4ha1; n), 0.00003 (P4ha2; n), 0.00001 (P3h1; n), 0.0004 (Plod1; n), 0.001 (Plod2; n), 0.001 (Pdi; n) or 0.00008 (Lox; n); Phd2chon+-veh vs. Phd2chon+-DCA+BPTES 0.0000002 (j), 0.0003 (k), 0.004 (l) or 0.005 (m); Phd2chon--veh vs. Phd2chon--DCA+BPTES 0.00002 (j), 0.000000002 (k), 0.000003 (l), 0.0014 (m), 0.0008 (P4ha1; n), 0.0002 (P4ha2; n), 0.0001 (P3h1; n), 0.0001 (Plod1; n), 0.001 (Plod2; n), 0.001 (Pdi; n) or 0.0002 (Lox; n).
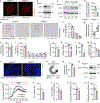
Figure 1.
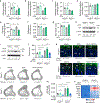
Figure 1.. Skeletal dysplasia in Phd2chon- mice
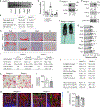
(a) Safranin O staining of the growth plate of neonatal (P2.5) mice, with quantification of the total length (TL), of the proliferating (PZ) and hypertrophic zone (HZ) (n=8 mice). (b) 3D microCT models of the tibial metaphysis and quantification of trabecular bone volume (TBV) in neonatal (n=10 mice) and adult (14 weeks) mice (n=10 Phd2chon+ − 8 Phd2chon- mice). (c) Safranin O staining of the tibia of adult mice with quantification of the percentage Safranin O (SafO) positive matrix (red) relative to BV (n=8 Phd2chon+ − 9 Phd2chon- mice). (d) P-AMPKT172 and AMPK immunoblot, with quantification of p-AMPKT172 to AMPK ratio. Representative images of 4 independent experiments are shown. (e) BrdU immunostaining of neonatal growth plates with quantification of the percentage BrdU-positive cells (n=6 mice). (f) Collagen synthesis in cultured chondrocytes (n=8 biologically independent samples). Data are means ± SD in (a-c, e), or means ± SEM in (d, f). **p<0.01 vs. Phd2chon+, ***p<0.001 vs. Phd2chon+ (two-sided Student’s t-test). Exact p values: 0.0000002 (TL; a), 0.00001 (PZ; a), 0.0005 (HZ; a), 0.00001 (P2,5; b), 0.0006 (14w; b), 0.004 (c), 0.004 (d), 0.0002 (e), 0.0004 (f). Scale bar in (a) is 250 μm, scale bars in (c) and (e) are 100 μm.
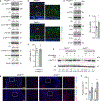
Figure 2.
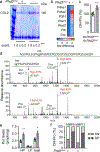
Figure 2.. Altered collagen processing in Phd2chon- growth plates
(a) Type II collagen (COL2) levels in neonatal (P2.5) growth plates, analysed by SDS page and Coomassie staining. Protein loading was normalized to growth plate weight. Representative images of 2 experiments, each with 2 biologically independent replicates, are shown. (b) P4ha1, Ph4ha2, P3h1, Plod1, Plod2, Pdi and Lox mRNA levels in neonatal growth plates (n=4 biologically independent samples). (c) Hydroxyproline (OH-Pro) content in neonatal growth plates, normalized for tissue weight (n=6 biologically independent samples). (d) Mass spectral analysis of Pro744 and Pro795 hydroxylation in peptides obtained after in-gel trypsin digest of the α1(II) chain of collagen extracted from neonatal growth plates. Representative images of 4 biologically independent samples are shown. Hyp is hydroxyproline. (e) Hydroxylysylpyridinoline (HP) and lysylpyridinoline (LP) content and total pyridinoline (Pyr) cross-links (total) in neonatal growth plates, normalized for tissue weight (n=4 biologically independent samples). (f) OH-Pro content in neonatal growth plates (GP) and supernatant (SN), after incubation with MMP9 or MMP13 (n=5 biologically independent samples). Data are means ± SD. *p<0.05 vs. Phd2chon+, **p<0.01 vs. Phd2chon+, ***p<0.001 vs. Phd2chon+ (two-sided Student’s t-test). Exact p values: 0.0009 (a), 0.045 (P4ha1; b), 0.0013 (P4ha2; b), 0.006 (P3h1; b), 0.0017 (Plod1; b), 0.002 (Plod2; b), 0.010 (Pdi; b), 0.03 (Lox; b), 0.00004 (c), 0.007 (HP; e), 0.014 (total; e).
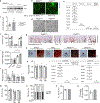
Figure 3.
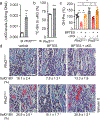
Figure 3.. Enhanced collagen hydroxylation relies on glutamine-dependent α-ketoglutarate production
(a) Intracellular α-ketoglutarate (αKG) levels in cultured chondrocytes (n=3 biologically independent samples). (b) Fractional contribution of 13C5-glutamine (Gln) to αKG (n=3 biologically independent samples). (c) Hydroxyproline (OH-Pro) content in neonatal growth plates of mice treated with BPTES, with or without αKG (n=6 for Phd2chon+-veh, Phd2chon--BPTES or Phd2chon--BPTES+αKG mice; and n=7 for Phd2chon+-BPTES, Phd2chon+-BPTES+αKG or Phd2chon--veh mice). (d) Safranin O staining of the tibia of mice treated with BPTES, with or without αKG, and quantification of the percentage Safranin O (SafO) positive matrix relative to bone volume (BV) (n=5 for Phd2chon+-BPTES mice; n=6 for Phd2chon+-veh or Phd2chon--veh mice; and n=7 for Phd2chon+-BPTES+αKG, Phd2chon--BPTES or Phd2chon--BPTES+αKG mice). Scale bar is 250 μm. Data are means ± SEM in (a, b), or means ± SD in (c,d). ***p<0.001 vs. Phd2chon+ (two-sided Student’s t-test), #p<0.05 (ANOVA), §p<0.05 vs. Phd2chon+-veh, °p<0.05 vs. Phd2chon--veh (ANOVA). Exact p values: 0.0009 (a); 0.00004 (b); Phd2chon+-veh vs. Phd2chon--veh 0.0010 (c) or 0.00001 (d); Phd2chon+-veh vs. Phd2chon+-BPTES 0.000001 (c) or 0.00003 (d); Phd2chon+-veh vs. Phd2chon--BPTES+αKG 0.005 (c) or 0.000002 (d); Phd2chon+-BPTES vs. Phd2chon+-BPTES+αKG 0.0000001 (c); Phd2chon--veh vs. Phd2chon--BPTES 0.00005 (c) or 0.0000002 (d); Phd2chon--BPTES vs. Phd2chon--BPTES+αKG 0.0003 (c).
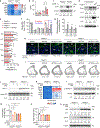
Figure 4.
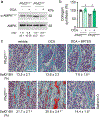
Figure 4.. Stimulating glucose oxidation in PHD2-deficient chondrocytes avoids energy deficit and restores collagen synthesis
P-AMPKT172 and AMPK immunoblot with quantification of p-AMPKT172 to AMPK ratio in cultured chondrocytes, with or without DCA treatment. Representative images of 3 independent experiments are shown. (b) Collagen synthesis in cultured chondrocytes, with or without DCA treatment (n=6 biologically independent samples). (c) Safranin O staining of the tibia of mice treated with DCA, with or without BPTES, with quantification of the percentage Safranin O (SafO) positive matrix relative to bone volume (BV) (n=5 for Phd2chon+-veh or Phd2chon--veh mice; n=7 for Phd2chon+-DCA, Phd2chon+-DCA+BPTES, Phd2chon--DCA, Phd2chon--DCA+BPTES mice). Scale bar is 250 μm. Data are means ± SEM in (a, b), or means ± SD in (c). #p<0.05 (ANOVA), §p<0.05 vs. Phd2chon+-veh, °p<0.05 vs. Phd2chon--veh (ANOVA). Exact p values: Phd2chon+-veh vs. Phd2chon--veh 0.03 (a), 0.0000002 (b) or 0.0014 (c); Phd2chon--veh vs. Phd2chon--DCA 0.013 (a), 0.00013 (b) or 0.0006 (c); Phd2chon+-veh vs. Phd2chon+-DCA+BPTES 0.0006 (c); Phd2chon+-veh vs. Phd2chon--DCA 0.000003 (c); Phd2chon--veh vs. Phd2chon--DCA+BPTES 0.0002 (c).

Similar articles

Cited by

References

Main text references

    1. Kronenberg HM Developmental regulation of the growth plate. Nature 423, 332–336, doi:10.1038/nature01657 (2003). - DOI - PubMed
    1. Buttgereit F & Brand MD A hierarchy of ATP-consuming processes in mammalian cells. Biochem J 312 ( Pt 1), 163–167 (1995). - PMC - PubMed
    1. Maes C et al. VEGF-independent cell-autonomous functions of HIF-1alpha regulating oxygen consumption in fetal cartilage are critical for chondrocyte survival. J Bone Miner Res 27, 596–609, doi:10.1002/jbmr.1487 (2012). - DOI - PubMed
    1. Pfander D, Cramer T, Schipani E & Johnson RS HIF-1alpha controls extracellular matrix synthesis by epiphyseal chondrocytes. J Cell Sci 116, 1819–1826 (2003). - PubMed
    1. Aro E et al. Hypoxia-inducible factor-1 (HIF-1) but not HIF-2 is essential for hypoxic induction of collagen prolyl 4-hydroxylases in primary newborn mouse epiphyseal growth plate chondrocytes. J Biol Chem 287, 37134–37144, doi:10.1074/jbc.M112.352872 (2012). - DOI - PMC - PubMed

Methods references

    1. Mazzone M et al. Heterozygous deficiency of PHD2 restores tumor oxygenation and inhibits metastasis via endothelial normalization. Cell 136, 839–851, doi:10.1016/j.cell.2009.01.020 (2009). - DOI - PMC - PubMed
    1. Ovchinnikov DA, Deng JM, Ogunrinu G & Behringer RR Col2a1-directed expression of Cre recombinase in differentiating chondrocytes in transgenic mice. Genesis 26, 145–146 (2000). - PubMed
    1. Maes C et al. Soluble VEGF isoforms are essential for establishing epiphyseal vascularization and regulating chondrocyte development and survival. J Clin Invest 113, 188–199, doi:10.1172/JCI19383 (2004). - DOI - PMC - PubMed
    1. Stegen S et al. Osteocytic oxygen sensing controls bone mass through epigenetic regulation of sclerostin. Nat Commun 9, 2557, doi:10.1038/s41467-018-04679-7 (2018). - DOI - PMC - PubMed
    1. Stegen S et al. HIF-1alpha Promotes Glutamine-Mediated Redox Homeostasis and Glycogen-Dependent Bioenergetics to Support Postimplantation Bone Cell Survival. Cell Metab 23, 265–279, doi:10.1016/j.cmet.2016.01.002 (2016). - DOI - PMC - PubMed

Publication types

MeSH terms