. 2019 Mar 5;93(6):e01815-18.
doi: 10.1128/JVI.01815-18. Print 2019 Mar 15.

TMPRSS2 Contributes to Virus Spread and Immunopathology in the Airways of Murine Models after Coronavirus Infection

Affiliations

TMPRSS2 Contributes to Virus Spread and Immunopathology in the Airways of Murine Models after Coronavirus Infection

Naoko Iwata-Yoshikawa et al. J Virol. .

Abstract

Transmembrane serine protease TMPRSS2 activates the spike protein of highly pathogenic human coronaviruses such as severe acute respiratory syndrome-related coronavirus (SARS-CoV) and Middle East respiratory syndrome-related coronavirus (MERS-CoV). In vitro, activation induces virus-cell membrane fusion at the cell surface. However, the roles of TMPRSS2 during coronavirus infection in vivo are unclear. Here, we used animal models of SARS-CoV and MERS-CoV infection to investigate the role of TMPRSS2. Th1-prone C57BL/6 mice and TMPRSS2-knockout (KO) mice were used for SARS-CoV infection, and transgenic mice expressing the human MERS-CoV receptor DPP4 (hDPP4-Tg mice) and TMPRSS2-KO hDPP4-Tg mice were used for MERS-CoV infection. After experimental infection, TMPRSS2-deficient mouse strains showed reduced body weight loss and viral kinetics in the lungs. Lack of TMPRSS2 affected the primary sites of infection and virus spread within the airway, accompanied by less severe immunopathology. However, TMPRSS2-KO mice showed weakened inflammatory chemokine and/or cytokine responses to intranasal stimulation with poly(I·C), a Toll-like receptor 3 agonist. In conclusion, TMPRSS2 plays a crucial role in viral spread within the airway of murine models infected by SARS-CoV and MERS-CoV and in the resulting immunopathology.IMPORTANCE Broad-spectrum antiviral drugs against highly pathogenic coronaviruses and other emerging viruses are desirable to enable a rapid response to pandemic threats. Transmembrane protease serine type 2 (TMPRSS2), a protease belonging to the type II transmembrane serine protease family, cleaves the coronavirus spike protein, making it a potential therapeutic target for coronavirus infections. Here, we examined the role of TMPRSS2 using animal models of SARS-CoV and MERS-CoV infection. The results suggest that lack of TMPRSS2 in the airways reduces the severity of lung pathology after infection by SARS-CoV and MERS-CoV. Taken together, the results will facilitate development of novel targets for coronavirus therapy.

Keywords: MERS-CoV; SARS-CoV; TMPRSS2; animal model; immunopathology.


Figures

FIG 1
FIG 1
Genotyping of C57BL/6 (WT), TMPRSS2-KO (KO), hDPP4-Tg (Tg), and TMPRSS2-KO hDPP4 (KO-Tg) mice by PCR analysis. PCR analysis was performed on the genomic DNA from ear punches taken from WT (WT, 4 to 5 weeks old; n = 3 male mice), TMPRSS2-KO (4 to 5 weeks old; n = 3 male mice), hDPP4-Tg (4 to 5 weeks old; n = 3 [male, 1; female, 2]), and TMPRSS2-KO Tg (4 to 5 weeks old; n = 3 [male, 1; female, 2] mice), and the resulting products (391 bp for hDPP4 and 388 bp for TMPRSS2) are shown. Numbers indicate positions of the 500-bp molecular weight marker ladder. M, 100-bp ladder; P, positive controls for hDPP4 or TMPRSS2; N, negative control without the ear punch template.
FIG 2
FIG 2
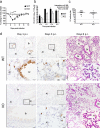
Experimental infection of TMPRSS2-knockout (KO) mice with SARS-CoV. C57BL/6 (WT) and TMPRSS2-KO mice were inoculated with F-musX (SARS-CoV). (a) Body weight curve during the first 10 days postinfection (p.i.). Numbers of animals per group were as follows: TMPRSS2-KO, n = 14 (male, 11; female, 3); WT, n = 10 (male, 5; female, 5). Mice 22 to 28 weeks old were used. Error bars represent standard errors (*, P < 0.05; ****, P < 0.0001, by one-way ANOVA). (b) Virus titer in lungs from SARS-CoV-inoculated animals at 6 h and at 1, 2, and 3 days p.i. Numbers of animals per group were as follows: TMPRSS2-KO, n = 4 to 5 mice per time point (male, 0 to 1; female, 3 to 4); WT, n = 4 to 5 per time point (male, 0 to 1; female, 3 to 4). Mice 14 to 30 weeks old were used. Error bars represent standard errors. The dotted line indicates the limit of detection. P values in the graph were calculated by two-way ANOVA to determine significant effects of viral titers in different animal strains at different time points. (c) Neutralizing antibody titer in serum on day 10 p.i. The data are from the same animals used in for the experiments shown in panel a, except for one mouse that died. Each symbol represents an individual mouse. Numbers of animals per group were as follows: TMPRSS2-KO, n = 14 (male, 11; female, 3); WT, n = 9 (male, 4; female, 5). Mice of 22 to 28 weeks-old were used. Error bars represent standard errors. P-values for the graph were calculated by the Mann-Whitney test. The dotted line indicates the limit of detection. (d) Histopathological examination of the lungs from WT and TMPRSS2-KO mice after infection by SARS-CoV. Numbers of animals per group were as follows: TMPRSS2-KO, n = 3 per time point (male, 1 to 2; female, 1 to 2); WT, n = 3 per time point (male, 1 to 2; female, 1 to 2). Mice 15 to 20 weeks old were used. Representative images of lungs from mice on days 1 and 3 days p.i. are shown. Immunohistochemical analysis was performed using an anti-SARS-CoV polyclonal antibody (at 1 and 3 days p.i.). Hematoxylin and eosin staining at 3 days p.i. On day 1 p.i., viral antigen-positive cells are seen mainly in the bronchi of a WT mouse, whereas very weakly positive cells are seen in a TMPRSS2-KO mouse (left panels, brown staining). On day 3 p.i., several alveolar cells around the bronchi in both WT and TMPRSS2-KO mice are positive for viral antigen (middle panels, brown). Cell debris and diffuse inflammatory infiltration by neutrophils and mononuclear cells are seen around bronchi and in the alveolar area of WT mice, whereas focal inflammatory infiltration is observed in the alveoli of TMPRSS2-KO (right panels, inset). Br, bronchi; Al, alveolar area; V, vein.
FIG 3
FIG 3
Formation of granulation tissue in TMPRSS2-knockout (KO) mice after infection with SARS-CoV. Histopathological examination of the lungs from WT and TMPRSS2-KO mice at 10 days after infection with SARS-CoV. Representative images of lungs are from the same animals used for the experiment shown in Fig. 2a. HE, hematoxylin and eosin staining; MT, Masson’s trichrome staining. Granulation tissue, known as Masson bodies (blue arrows with hematoxylin and eosin staining; red arrows with Masson’s trichrome staining), was located in the alveolar duct walls of WT mice and to a lesser extent in TMPRSS2-KO mice. Br, bronchi; Ad, Alveolar duct; Al, alveolar area.
FIG 4
FIG 4
Immune responses in TMPRSS2-knockout (KO) mice after infection with SARS-CoV. C57BL/6 wild-type (WT) and TMPRSS2-KO mice were inoculated with F-musX (SARS-CoV). Cytokine and chemokine responses (a) and the levels of type I IFN and TLR3 mRNA expression (b) in the lungs at 6 h and at 1, 2, and 3 days p.i. are shown. The lung homogenates were from the same animals used in the experiment shown in Fig. 1b, and assays were done using unicate samples per animal. Expression of each gene was normalized to that of β-actin in panel b. Numbers of animals per group were as follows: TMPRSS2-KO, n = 4 per time point (male, 0 to 1; female, 3 to 4); WT, n = 4 per time point (male, 0 to 1; female, 3 to 4). Mice 14 to 30 weeks old were used. Error bars represent standard errors. P values for the graph were calculated by ANOVA (*, P < 0.05; **, P < 0.01; ****, P < 0.0001).
FIG 5
FIG 5
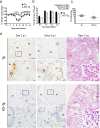
Experimental infection of TMPRSS2-knockout hDPP4-transgenic (TMPRSS2-KO Tg) mice with MERS-CoV. hDPP4-Tg (Tg) and TMPRSS2-KO Tg (KO-Tg) mice were inoculated with EMC-HCoV (MERS-CoV). (a) Body weight curve during the 14 days postinfection (p.i.). Numbers of animals per group were as follows: TMPRSS2-KO Tg, n = 8 (male, 2; female, 6); hDPP4-Tg, n = 6 (male, 3; female, 3). Mice 12 to 14 weeks old were used. Error bars represent standard errors (***, P < 0.001, by one-way ANOVA). (b) Virus titer in the lungs of MERS-CoV-inoculated animals at 6 h and at 1, 2, and 3 days p.i. Numbers of animals per group were as follows: TMPRSS2-KO Tg, n = 4 per time point (male, 0 to 1; female, 3 to 4); hDPP4-Tg, n = 4 per time point (male, 1 to 2; female, 2 to 3). Mice 13 to 22 weeks old were used. Error bars represent standard errors. The dotted line indicates the limit of detection. P values indicated in the graph were calculated by two-way ANOVA for significant effects of viral titers in different animal strains at different time points. (c) Neutralizing antibodies in serum from mice on day 14 p.i. The sera were from the same animals used in the experiment shown in panel a. Numbers of animals per group were as follows: TMPRSS2-KO Tg, n = 8 (male, 2; female, 6); Tg, n = 6 (male, 3; female, 3). Mice 12 to 14 weeks old were used. Error bars represent standard errors. P values in the graph were calculated by a Mann-Whitney test (*, P < 0.05). The dotted line indicates the limit of detection. (d) Histopathological examination of the lungs of hDPP4-Tg mice and TMPRSS2-KO Tg mice after infection with MERS-CoV. Numbers of animals per group were as follows: TMPRSS2-KO Tg, n = 3 per time point (male, 1 to 2; female, 1 to 2); WT, n = 3 per time point (male, 2 to 3; female, 0 to 1). Mice were 19 to 25 weeks old. Representative images from mice were taken on days 1, 3, and 7 p.i. Immunohistochemical analysis was performed at 1 and 3 days p.i. using an anti-MERS-CoV nucleocapsid polyclonal antibody. Hematoxylin and eosin staining was performed at day 7 p.i. Viral antigen-positive cells are seen both in the bronchi and alveoli of a hDPP4-Tg mouse (left panels, brown). Some pneumocytes in the hDPP4-Tg mouse are positive for viral antigen but negative in a TMPRSS2-KO Tg mouse (day 1 p.i.; left panels, brown). Several viral antigen-positive cells are seen in the alveoli and bronchi of an hDPP4-Tg mouse on day 3 p.i., but fewer are present in a TMPRSS2-KO Tg mouse (middle panels, brown). On day 7, massive cellar proliferation is observed in the alveoli of a hDPP4-Tg mouse, with numerous macrophages and mononuclear cells (right panels, inset). In contrast, multinuclear cells (including neutrophils and eosinophils) are seen in the alveoli of a TMPRSS2-KO Tg mouse (right panels, arrows in inset). Br, bronchi; Al, alveolar area; V, vein.
FIG 6
FIG 6
Recovery from acute pneumonia without granulation tissue in TMPRSS2-knockout hDPP4-transgenic (TMPRSS2 KO-Tg) mice with MERS-CoV. Histopathological examination of the lungs from hDPP4-Tg (Tg) and TMPRSS2-KO Tg (KO-Tg) mice was performed 14 days after infection with MERS-CoV. Representative images of lungs are from the same animals used in the experiment shown in Fig. 5a. HE, Hematoxylin and eosin staining; MT, Masson’s trichrome staining. A lymphocyte aggregate (*) and cellular infiltrations persisted in the alveolar area of the hDPP4-Tg mouse, whereas infiltrations in TMPRSS2-KO Tg mice were mild. No granulation tissues were detected in these mice. Br, bronchi; Al, alveolar area.
FIG 7
FIG 7
Immune responses in TMPRSS2-knockout (KO) hDPP4-transgenic mice after infection with MERS-CoV. hDPP4-Tg (Tg) and TMPRSS2-KO hDPP4-Tg (TMPRSS2-KO Tg) mice were inoculated with EMC-HCoV (MERS-CoV). (a) The lung homogenates were from the same animals used in the experiment shown in Fig. 5b, and assays were done using unicate samples per animal. The dotted line indicates the limit of detection. (b) The levels of type I IFN and TLR3 mRNA expression in the lungs at 6 h and at 1, 2, and 3 days p.i. Numbers of animals per group were as follows: TMPRSS2-KO Tg (KO-Tg), n = 4 per time point (male, 0 to 1; female, 3 to 4); hDPP4-Tg (Tg), n = 4 per time point (male, 1 to 2; female, 2 to 3). Mice 13 to 22 weeks old were used. Expression of each gene was normalized to that of β-actin. Error bars represent standard errors. P values for the graphs were calculated by ANOVA (*, P < 0.05; **, P < 0.01; ***, P < 0.001).
FIG 8
FIG 8
Immune responses after intranasal inoculation of mice with poly(I·C). Concentrations of inflammatory cytokines and chemokines in the lungs at 24 h postinfection are shown. The assays were done using unicate samples per animal. Numbers of animals per group were as follows: (a) WT, n = 4 per group (male, 2; female, 2); TMPRSS2-KO (KO), n = 4 per group (male, 2; female, 2). (b) hDPP4-Tg (Tg), n = 4 per group (male, 2; female, 2); TMPRSS2-KO Tg (KO-Tg), n = 4 per group [with poly(I·C): male, 2; female, 2; with PBS: male, 1; female, 3]. Mice 14 to 16 weeks old were used. Error bars represent standard errors. P values for the graph were calculated by ANOVA (*, P < 0.05).

Similar articles

Cited by

References

    1. Ksiazek TG, Erdman D, Goldsmith CS, Zaki SR, Peret T, Emery S, Tong S, Urbani C, Comer JA, Lim W, Rollin PE, Dowell SF, Ling AE, Humphrey CD, Shieh WJ, Guarner J, Paddock CD, Rota P, Fields B, DeRisi J, Yang JY, Cox N, Hughes JM, LeDuc JW, Bellini WJ, Anderson LJ, SARS Working Group. 2003. A novel coronavirus associated with severe acute respiratory syndrome. N Engl J Med 348:1953–1966. doi:10.1056/NEJMoa030781. - DOI - PubMed
    1. Drosten C, Gunther S, Preiser W, van der Werf S, Brodt HR, Becker S, Rabenau H, Panning M, Kolesnikova L, Fouchier RA, Berger A, Burguiere AM, Cinatl J, Eickmann M, Escriou N, Grywna K, Kramme S, Manuguerra JC, Muller S, Rickerts V, Sturmer M, Vieth S, Klenk HD, Osterhaus AD, Schmitz H, Doerr HW. 2003. Identification of a novel coronavirus in patients with severe acute respiratory syndrome. N Engl J Med 348:1967–1976. doi:10.1056/NEJMoa030747. - DOI - PubMed
    1. Lee N, Hui D, Wu A, Chan P, Cameron P, Joynt GM, Ahuja A, Yung MY, Leung CB, To KF, Lui SF, Szeto CC, Chung S, Sung JJ. 2003. A major outbreak of severe acute respiratory syndrome in Hong Kong. N Engl J Med 348:1986–1994. doi:10.1056/NEJMoa030685. - DOI - PubMed
    1. Peiris JSM, Lai ST, Poon LLM, Guan Y, Yam LYC, Lim W, Nicholls J, Yee WKS, Yan WW, Cheung MT, Cheng VCC, Chan KH, Tsang DNC, Yung RWH, Ng TK, Yuen KY. 2003. Coronavirus as a possible cause of severe acute respiratory syndrome. Lancet 361:1319–1325. doi:10.1016/S0140-6736(03)13077-2. - DOI - PMC - PubMed
    1. Zhong NS, Zheng BJ, Li YM, Poon LLM, Xie ZH, Chan KH, Li PH, Tan SY, Chang Q, Xie JP, Liu XQ, Xu J, Li DX, Yuen KY, Peiris JSM, Guan Y. 2003. Epidemiology and cause of severe acute respiratory syndrome (SARS) in Guangdong, People's Republic of China, in February, 2003. Lancet 362:1353–1358. doi:10.1016/S0140-6736(03)14630-2. - DOI - PMC - PubMed

Publication types

MeSH terms

LinkOut - more resources