. 2019 Jan 8;10(1):69.
doi: 10.1038/s41467-018-08028-6.

Munc18 and Munc13 serve as a functional template to orchestrate neuronal SNARE complex assembly

Affiliations

Munc18 and Munc13 serve as a functional template to orchestrate neuronal SNARE complex assembly

Shen Wang et al. Nat Commun. .

Abstract

The transition of the Munc18-1/syntaxin-1 complex to the SNARE complex, a key step involved in exocytosis, is regulated by Munc13-1, SNAP-25 and synaptobrevin-2, but the underlying mechanism remains elusive. Here, we identify an interaction between Munc13-1 and the membrane-proximal linker region of synaptobrevin-2, and reveal its essential role in transition and exocytosis. Upon this interaction, Munc13-1 not only recruits synaptobrevin-2-embedded vesicles to the target membrane but also renders the synaptobrevin-2 SNARE motif more accessible to the Munc18-1/syntaxin-1 complex. Afterward, the entry of SNAP-25 leads to a half-zippered SNARE assembly, which eventually dissociates the Munc18-1/syntaxin-1 complex to complete SNARE complex formation. Our data suggest that Munc18-1 and Munc13-1 together serve as a functional template to orchestrate SNARE complex assembly.


Conflict of interest statement

The authors declare no competing interests.

Figures
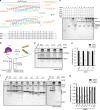
Fig. 1
Fig. 1
A half-zippered SNARE assembly gates the transition. a Crystal structure of the SNARE complex (PDB entry: 3HD7). The lower panel displays the sequence of the SNARE motifs of Syx1, SN25, and Syb2. Hydrophobic binding layers −7 to +8 are indicated by rainbow-colored sticks in the upper panel and shaded in gray in the lower panel. b Scheme of the native PAGE assay for monitoring MUN-catalyzed transition from the Munc18-1/Syx1 complex to the SNARE complex. The Munc18-1/Syx1 complex (2 μM) displays a sharp band at the top of the gel; upon the addition of the MUN domain (30 μM), SN25 (10 μM), and Syb2 (10 μM), this band disappears with the formation of the SNARE complex. c Standard examples of the native PAGE assay. The Munc13-1 MUN domain, Munc18-1, or free Syb2 show smeared band; free Syx1 displays multi-bands that likely represent different assembly/aggregation states; SN25 shows a strong and clear band; Syx1 bound to Munc18-1 exhibits a strong and clear band. * indicates a putative non-productive aggregation of the Munc18-1/Syx1 complex. # indicates putative SNARE assembly intermediates that coexist with the actual ternary SNARE complex (lane 14). Disappearance of the Munc18-1/Syx1 complex can only be detected when all components are included (lane 14). Lane numbers are indicated at the top of the chart. d Effects of Syb2 N-terminal mutations or truncations on MUN-catalyzed transition from the Munc18-1/Syx1 complex to the SNARE complex using native PAGE. The representative gel displayed is one of three replicates. e Quantification of d. Integrated density represents the normalized integrated gray level of each assessed Munc18-1/Syx1 band. Data are presented as the means ± SD, n = 3, two-tailed t test, ***p < 0.001. f Effects of SN25 C-terminal truncations on MUN-catalyzed transition from the Munc18-1/Syx1 complex to the SNARE complex using native PAGE. The representative gel displayed is one of three replicates. g Quantification of f. Integrated density represents the normalized integrated gray level of each assessed Munc18-1/Syx1 band. Data are presented as the means ± SD, n = 3, two-tailed t test, **p < 0.01; ***p < 0.001. Source data are provided as a Source Data file
Fig. 2
Fig. 2
N- and C-portions of Syb2 are both required for the transition. a Effects of Syb2 C-terminal truncations on MUN-catalyzed transition from the Munc18-1/Syx1 complex to the SNARE complex using native PAGE. The representative gel displayed is from one of three replicates. b Quantification of a. Integrated density represents the normalized integrated gray level of each assessed Munc18-1/Syx1 band. Data are presented as the means ± SD, n = 3, two-tailed t test, ***p < 0.001. c Functional analysis of the N- and/or C-portion of Syb2 in MUN-catalyzed transition from the Munc18-1/Syx1 complex to the SNARE complex using native PAGE. The representative gel displayed is from one of three replicates. d Quantification of c. Integrated density represents the normalized integrated gray level of each assessed Munc18-1/Syx1 band. Data are presented as the means ± SD, n = 3, two-tailed t test, ***p < 0.001. Source data are provided as a Source Data file
Fig. 3
Fig. 3
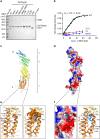
Crystal structure of the Syb2/MUN complex. a Screening of the MUN-binding sites on Syb2 (residues 29–96). Excess of the MUN protein or its mutants (3 μM) was added to GST-Syb2 (2 μM) in the GST pull-down assay. The representative gel displayed is from one of three replicates. b Determination of the disassociation constant between the MUN domain and Syb2 (residues 29–96) by fluorescence anisotropy. Data plots were fitted to the Hill equation, where the Hill coefficient (n) was fixed to 1. c Crystal structure of the Syb2/MUN complex. Subdomains of MUN are displayed by segmented color. Syb2 binds the MUN domain via a fragment of the Syb2 linker region (colored in blue). d Surface electron potential of the Syb2/MUN complex. The potential was scaled from −10 to 10kT/e, with red and blue denoting negative and positive potential, respectively. e Close-up view of the Syb2/MUN-binding interface on the MUN domain, showing a hydrophobic core formed by several residues on helices H12, H13, and H14 of subdomain D. f Close-up view of the negatively charged patch adjacent to the hydrophobic pocket bound to W89/W90. The right panel displays three potential residues (D1358, Q1362, and D1366) that are likely involved in Syb2 binding. Source data are provided as a Source Data file
Fig. 4
Fig. 4
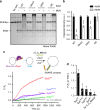
Syb2/MUN interaction is crucial for the transition as well as membrane fusion. a Functional analysis of Syb2 mutations in MUN-catalyzed transition from the Munc18-1/Syx1 complex to the SNARE complex. The RKAA, 2WD, and 4W mutations of Syb2 (residues 29–96) that disrupt the Syb2/MUN interaction strongly impaired the transition detected by native PAGE. The representative gel displayed is from one of three replicates. b Quantification of a. Integrated density represents the normalized integrated gray level of each assessed Munc18-1/Syx1 band. Data are presented as the means ± SD, n = 3, two-tailed t test, ***p < 0.001. c Fusion between liposomes reconstituted with the Munc18-1/Syx1 (full-length) complex and liposomes reconstituted with Syb2 (full-length) and Syt1 in the presence of the C1-C2B-MUN fragment, SN25, and 1 mM Ca2+. The RKAA, 2WD, and 4W mutations of Syb2 (residues 29–96) strongly impaired the fusion. Representative traces displayed are from one of three replicates. The liposome fusion assay is illustrated at the top of the chart. d Quantification of c. Data are presented as the means ± SD, n = 3. Source data are provided as a Source Data file
Fig. 5
Fig. 5
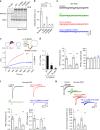
Syb2/MUN interaction is essential for synaptic vesicle docking/priming. a Functional analysis of mutations in the negatively charged patch of the Munc13-1 MUN domain in the transition from the Munc18-1/Syx1 complex to the SNARE complex using native PAGE. The representative gel displayed is from one of three replicates. b Quantification of a. Integrated density represents the normalized integrated gray level of each assessed Munc18-1/Syx1 band. Data are presented as the means ± SD, n = 3, two-tailed t test, *p < 0.05; ***p < 0.001. c Fusion between liposomes reconstituted with the Munc18-1/Syx1 complex and liposomes reconstituted with Syb2 and Syt1 in the presence of the C1-C2B-MUN fragment, SN25, and 1 mM Ca2+. Representative traces displayed are from one of three replicates. The liposome fusion assay is illustrated at the top of the chart. d Quantification of c. Data are presented as the means ± SD, n = 3. e Sample traces (top) and statistical summary (bottom) of mini IPSCs recorded in neuronal cultures that were infected with a control lentivirus (Control) (n = 14) or a lentivirus expressing only Munc13-1 shRNAs (KD) (n = 16) or Munc13-1 shRNAs plus either the C1-C2B-MUN fragment (KD/C1-C2B-MUN) (n = 21) or the D1358K mutation (KD/C1-C2B-MUN D1358K) (n = 12), respectively. Recorded cells are from three independent litters of mice. f Sample traces (top) and statistical summary (bottom) of action potential-evoked IPSCs recorded in neuronal cultures that were infected with a control lentivirus (Control) (n = 16) or a lentivirus expressing only Munc13-1 shRNAs (KD) (n = 17) or Munc13-1 shRNAs plus either the C1-C2B-MUN fragment (KD/C1-C2B-MUN) (n = 19) or the D1358K mutation (KD/C1-C2B-MUN D1358K) (n = 18), respectively. Recorded cells are from three independent litters of mice. g Sample traces (top) and statistical summary (bottom) of IPSCs evoked by 0.5 M sucrose recorded in neuronal cultures that were infected with a control lentivirus (Control) (n = 28) or a lentivirus expressing only Munc13-1 shRNAs (KD) (n = 24) or Munc13-1 shRNAs plus either the C1-C2B-MUN fragment (KD/C1-C2B-MUN) (n = 24) or the D1358K mutation (KD/C1-C2B-MUN D1358K) (n = 18), respectively. Recorded cells are from four independent litters of mice. **p < 0.01; ***p < 0.001, two-tailed t test. Source data are provided as a Source Data file
Fig. 6
Fig. 6
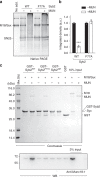
The MUN domain enables specific binding of Syb2 to the Munc18-1/Syx1 complex. a The F77A mutation of Syb2 severely impairs MUN-catalyzed transition from the Munc18-1/Syx1 complex to the SNARE complex. The representative gel displayed is from one of three replicates. b Quantification of a. Integrated density represents the normalized integrated gray level of each assessed Munc18-1/Syx1 band. Data are presented as the means ± SD, n = 3, two-tailed t test, ***p < 0.001. c Binding of Syb2 and its mutations to the Munc18-1/Syx1 complex in the absence or presence of the MUN domain detected by GST pull-down assay combined with immunoblotting. The MUN domain enables an interaction between Syb2 and the Munc18-1/Syx1 complex, and this interaction was able to be disrupted by the F77A or 4M mutation. The representative gels displayed are from one of three replicates. Source data are provided as a Source Data file
Fig. 7
Fig. 7
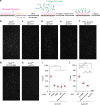
Syb2/MUN interaction promotes membrane association. a Illustration of the single-vesicle tethering assay. Glass surfaces were modified by PEG and biotin-PEG mixtures. DiD-labeled PM-vesicles containing 0.5% biotin-PE were first immobilized on a surface treated with neutravidin. After extensive washing, 1 μM Munc13-1 C1-C2B-MUN fragment (M13) and 40 μM (total lipids) Dil-labeled SV-vesicles were added and incubated for 30 min at 30 °C. Finally, another washing step was performed before imaging. b Representative channel image using Syb2WT-bearing SV-vesicles and wild-type Munc13-1 C1-C2B-MUN fragment (M13). c Example channel image using Syb2RKAA-bearing SV-vesicles and wild-type Munc13-1 C1-C2B-MUN fragment (M13). d Example channel image using Syb22WD-bearing SV-vesicles and wild-type Munc13-1 C1-C2B-MUN fragment (M13). e Example channel image using Syb24M-bearing SV-vesicles and wild-type Munc13-1 C1-C2B-MUN fragment (M13). f Example channel image using plain SV-vesicles and wild -type Munc13-1 C1-C2B-MUN fragment (M13). g Example channel image using Syb2WT-bearing SV-vesicle and Munc13-1 C1-C2B-MUN fragment (M13) D1358K mutant. h Example channel image using Syb2WT-bearing SV-vesicles only. i Quantification of the results in bf. j Quantification of the results in b, fh. Data are presented as the means ± SEM with dots showing individual single-vesicle counts from 10 randomly chosen frames (n = 10). **p < 0.01; ***p < 0.001, two-tailed t test. Source data are provided as a Source Data file
Fig. 8
Fig. 8
Working model of Munc18–Munc13 route to SNARE complex assembly. a The Syb2/MUN interaction and the C1-C2B/DAG-PIP2 interaction might pre-align synaptic vesicles with the plasma membrane, thus enhancing the binding reactivity between Syb2 and the Munc18-1/Syx1 complex. Yellow pentagrams represent the hydrophobic (W89/W90) and charged (R86/K87) residues in the Syb2 linker region. Orange and magenta spheres indicate DAG and PIP2, respectively. b The Syb2/MUN interaction, in coordination with the Munc18-1/Syx1/MUN interaction, allows binding of Syb2 to the extended conformation of domain 3 and thereby primes Syb2 and Syx1. c Munc18-1 and Munc13-1 proofread SNARE N-terminal nucleation with the entry of SN25. A half-zippered SNARE assembly releases Syx1 from Munc18-1 clamping, thus gating the transition to the SNARE complex. d Full zippering of the C-terminal region of the SNARE complex into the membrane leads to fusion of synaptic vesicles with the plasma membrane

Similar articles

Cited by

References

    1. Sudhof TC. The molecular machinery of neurotransmitter release (Nobel lecture) Angew. Chem. Int. Ed. Engl. 2014;53:12696–12717. doi: 10.1002/anie.201406359. - DOI - PubMed
    1. Jahn R, Scheller RH. SNAREs—engines for membrane fusion. Nat. Rev. Mol. Cell. Biol. 2006;7:631–643. doi: 10.1038/nrm2002. - DOI - PubMed
    1. Rizo J, Rosenmund C. Synaptic vesicle fusion. Nat. Struct. Mol. Biol. 2008;15:665–674. doi: 10.1038/nsmb.1450. - DOI - PMC - PubMed
    1. Kloepper TH, Kienle CN, Fasshauer D. An elaborate classification of SNARE proteins sheds light on the conservation of the eukaryotic endomembrane system. Mol. Biol. Cell. 2007;18:3463–3471. doi: 10.1091/mbc.e07-03-0193. - DOI - PMC - PubMed
    1. Sutton RB, Fasshauer D, Jahn R, Brunger AT. Crystal structure of a SNARE complex involved in synaptic exocytosis at 2.4 A resolution. Nature. 1998;395:347–353. doi: 10.1038/26412. - DOI - PubMed

Publication types

LinkOut - more resources