. 2019 Jan 16;101(2):207-223.e10.
doi: 10.1016/j.neuron.2018.12.006. Epub 2018 Dec 31.

Developmental Heterogeneity of Microglia and Brain Myeloid Cells Revealed by Deep Single-Cell RNA Sequencing

Affiliations

Developmental Heterogeneity of Microglia and Brain Myeloid Cells Revealed by Deep Single-Cell RNA Sequencing

Qingyun Li et al. Neuron. .

Abstract

Microglia are increasingly recognized for their major contributions during brain development and neurodegenerative disease. It is currently unknown whether these functions are carried out by subsets of microglia during different stages of development and adulthood or within specific brain regions. Here, we performed deep single-cell RNA sequencing (scRNA-seq) of microglia and related myeloid cells sorted from various regions of embryonic, early postnatal, and adult mouse brains. We found that the majority of adult microglia expressing homeostatic genes are remarkably similar in transcriptomes, regardless of brain region. By contrast, early postnatal microglia are more heterogeneous. We discovered a proliferative-region-associated microglia (PAM) subset, mainly found in developing white matter, that shares a characteristic gene signature with degenerative disease-associated microglia (DAM). Such PAM have amoeboid morphology, are metabolically active, and phagocytose newly formed oligodendrocytes. This scRNA-seq atlas will be a valuable resource for dissecting innate immune functions in health and disease.

Keywords: brain myeloid cells; brain regions; cell cycle; development; disease-associated microglia; heterogeneity; microglia; phagocytosis; proliferative-region-associated microglia; single-cell RNA-seq.


Conflict of interest statement

Declaration of Interests

The authors declare no competing interests.

Figures
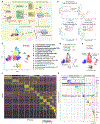
Figure 1.
Figure 1.. Clustering of brain myeloid cells across developmental stages by deep scRNA-seq.
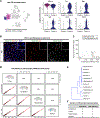
(A) Schematic graph showing the experimental design. c-KitCD45+ (bold) was the sorting gate for E14.5 cells, and CD45+CD11b+ (bold) was for P7 and P60 cells. Other surface markers were recorded as metadata. (B) Representative FACS plots showing the cells sequenced (red or blue). (C) tSNE plot showing 15 clusters and population annotations with microglia-like clusters in bold and the number of cells in parentheses. (D) Overlaying FACS gating information onto the same tSNE plot in (C). The vast majority of P60 microglia are CD45low, while P7 microglia are comprised of both CD45low and CD45hi cells. Almost all cells from non-microglia clusters are CD45hi. (E) Overlaying developmental stage information onto the same tSNE plot in (C). (F) Heatmap showing the top 20 markers (or all markers if less than 20) for each of the 15 clusters. (G) Bar plots showing gene expression levels of two representative markers for each cluster. See also Figure S1, Table S1.
Figure 2.
Figure 2.. Postnatal transcriptional alteration of choroid plexus macrophages (CP MΦ).
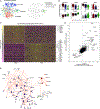
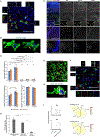
(A) tSNE plot (left) and heatmap (right) highlighting two stage-specific CP MΦ clusters and differentially expressed genes. Genes for validation in (C) and (D) are underlined and in bold. (B) Violin plots showing that H2-Eb1 and Lilra5 are highly expressed by adult CP MΦ (cluster 7), and Clec4n is highly enriched in early postnatal CP MΦ (cluster 9). (C) RNA in situ validation of abundant H2-Eb1 and Lilra5 expression in P60 CP MΦ (H2-Eb1+Lilra5+Cx3cr1+, arrow heads) but not in P7 cells. H2-Eb1 Cx3cr1+Lilra5+ (arrows) cells were occasionally seen in both stages. H2-Eb1+Lilra5 Cx3cr1 (asterisks) are non-myeloid cells. (D) Immunostaining validation of more abundant CLEC4N expression in P7 CP MΦ (CLEC4N+CX3CR1-GFP+, arrow heads). CLEC4NCX3CR1-GFP+ (arrow) cells also exist in P7. CP, choroid plexus. Dashed lines demarcate ventricle borders. Scale bars in (C) and (D) are 50um.
Figure 3.
Figure 3.. Limited transcriptomic heterogeneity of adult homeostatic microglia across brain regions.
(A) tSNE plot (left) and violin plots (right) highlighting two P60 microglia clusters, and examples of differentially expressed genes. (B) RNA in situ showing negative expression of Fos and Egr1 in microglia (Tmem119+), and positive signals from surrounding non-microglia cells. (C) Quantification of fluorescence signals in (B). n=30 cells for each. (D) Pearson correlation between bulk RNA-seq samples from P60 brain regions. (E) Dendrogram showing hierarchical clustering of bulk RNA-seq samples, irrelevant of regions. (F) Numbers of differentially expressed genes between homeostatic microglia from different regions by scRNA-seq and bulk RNA-seq. Scale bar in (B) is 50um. See also Figure S2, Table S2, Table S3.
Figure 4.
Figure 4.. Phase-specific gene expression of dividing microglia (P7-C0 cluster) along cell cycle pseudotime.
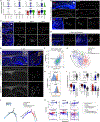
(A) tSNE plots demonstrating cell cycle regression and re-clustering of P7 microglia. Cells in all tSNE plots are color coded exactly the same way as in Figure 1C. Numbers of cells in each cluster are given in parentheses. Two tSNE plots in the box (lower left) demonstrate consistency of two analyses (before and after cell cycle regression) and distribution of the original dividing clusters (cluster 3 and 4) into P7-C0, P7-C1 and P7-C2 following cell cycle regression. (B) – (F) showing analysis for the 264 P7-C0 microglia identified in (A). (B) Heatmap (upper panel) showing pseudotime ordering of P7-C0 microglia based on raw phase scores. Each column is a cell, and each row denotes raw scores for a specific cell cycle phase. G0 cells have no dominant phase scores for any phase and were not ordered. Heatmap (lower panel) showing expression levels of identified phase-specific genes. Each column is a cell and each row is a gene. The original identities (bottom bar) are color coded as in (A). (C) Dot plots showing expression levels of phase-specific genes along microglia dividing pseudotime. Genes for each phase are plotted in separate graphs with each dot representing the level of expression for a given gene in a given cell. Curves show average expression of all genes assigned to a phase along dividing pseudotime. Expression of microglial signature genes (Butovsky et al., 2014) is shown at the bottom. (D) The gray pie chart showing overlaps of phase-specific genes identified by the algorithm compared with four published cell cycle gene sets (Grant et al., 2013). Colored pie charts are breakdowns of the genes from each category based on the phase assignment. (E) Table showing gene names identified as “Novel” in (D). Genes that may play a role in cell division are in bold. (F) Heatmap (upper panel) showing pseudotime ordering of P7-C0 microglia by normalized phase scores. The bottom panels show Ankle1 as an example for its expression dynamics along dividing pseudotime. Each dot is a single cell. The smoothened expression is the average expression of Ankle1 computed with a fixed window size (length of ordered cells/10). See also Figure S3, Figure S4, Table S4.
Figure 5.
Figure 5.. Heterogeneity of early postnatal microglia revealed by scRNA-seq.
(A) Re-clustering of P7 microglia (as in Figure 4A) to highlight that P7-C2 are mainly embryonic-like cells (cluster 5) in the original clustering result. (B) Violin plots showing some differentially expressed genes between P7-C2 and the other two clusters. (C) Heatmap showing top 70 differentially expressed genes between P7-C0 and P7-C1. P7-C0 express higher levels of homeostatic genes and P7-C1 enrich many disease-associated genes. (D) Comparison of gene expression changes in DAM (relative to homeostatic microglia) with the changes in P7-C1 (relative to P7-C0) showing similar sets of up-and down-regulated genes in two cases. (E) Gene network showing correlated gene modules underlying cluster identities of P7 microglia (See STAR Methods). Each gene is colored based on its differential expression levels among three P7 clusters. Solid lines are for positive correlation and dashed lines are for negative correlation. See also Table S5.
Figure 6.
Figure 6.. Validation of early postnatal proliferative region-associated microglia.
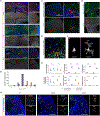
(A) Violin plots showing some top up-regulated genes in P7-C1 (PAM) compared with the other two clusters. (B) RNA in situ (RNAscope) showing that Spp1 and Gpnmb signals mainly overlap in the corpus callosum (CC, inset) and white matter region of cerebellum (CB), and they also overlap with the microglia marker Cx3cr1. (C) RNA in situ showing that Gpnmb+Cx3cr1+ microglia are positive for Igf1 in CC (inset) and CB white matter. Microglia in the cortex (CTX), hippocampus (HIP) and striatum (STR) are negative for Gpnmb and Igf1 (arrow heads). Gpnmb+Cx3cr1+Igf1+ cells in the lateral ventricle (LV) (asterisk) and Igf1+Cx3cr1 neural cells (arrows) are also labeled. (D) RNA in situ showing that Gpnmb+Cx3cr1+ microglia are intermingled with Mbp+ oligodendrocytes in the developing white matter. (E) Immunohistochemistry showing CLEC7A expression by P7-C1 (PAM) in the developing white matter and near ventricles. TH: thalamus. (F) FACS plot showing P7 cerebellar GPNMB+CLEC7A+ cells (orange box) isolated for scRNA-seq. (G) Histograms showing higher levels of LILRB4 and CD63 surface expression in GPNMB+CLEC7A+ microglia compared with GPNMBCLEC7Acells. (H) tSNE plot showing clustering result (dashed circles) after combining GPNMB+CLEC7A+ cells with the originally sequenced P7 microglia. The arrow indicates gradual changes of transcriptomes from postnatal immature state (P7-C0) towards more polarized GPNMB+CLEC7A+ state. (I) Violin plots showing further up-or down-regulation of differentially expressed genes in P7-GPNMB+CLEC7A+ compared with P7-C1 microglia by scRNA-seq. (J) Pseudotime analysis of P7 microglia together with P7-GPNMB+CLEC7A+ and P60 homeostatic microglia showing developmental trajectories from P7-C0/P7-C1 mixed starting point to P7-GPNMB+CLEC7A+ early postnatal PAM branch (via P7-C1) and to P60 homeostatic branch (via P7-C0). Each dot is a cell. (K) Gene expression dynamics for two trajectories in (J) along developmental pseudotime, when the PAM branch gradually turns on disease-associated genes and down-regulates homeostatic genes. Scale bars: 50um in (B)-(D), 500um in (E). See also Figure S5, Table S5.
Figure 7.
Figure 7.. Transient appearance of PAM in developing white matter, independent of TREM2-APOE regulation.
(A) Immunohistochemistry showing CLEC7A+ microglia (arrow heads) from different developmental stages. Inset shows CLEC7A+ microglia in hippocampal dentate gyrus at P14. SVZ: subventricular zone. (B) Quantification of CLEC7A+ microglia across developmental stages. n=3 sections for each stage. (C) At P60, CLEC7A+ microglia are present in hippocampal dentate gyrus (DG, arrow heads). Arrows point to CLEC7Acells. HL: hilus. (D) At P60, CLEC7A+ microglia are also present in SVZ and rostral migratory stream (RMS). OB: olfactory bulb. (E) 63X confocal images showing differences in morphology and density between CLEC7A+ (in CC) and CLEC7A(in CTX) microglia at P7. (F) 3D reconstruction of representative P7 microglia. (G) Quantification showing differences in morphology (n=10 cells each) and density (n=3 sections each) between CLEC7A+ and CLEC7Amicroglia at P7. *** P<0.001, ** P<0.01, * P<0.05. (H) RNA in situ showing the presence of Gpnmb+Spp1+ microglia in Trem2−/− or Apoe−/− cerebellum at P7. Scale bars: 500um in (A), left panels in (C), (D) and (H); 50um in (E) and the right panels of (C); 10um in (F). Data are represented as mean ± SEM in (B) and (G). See also Figure S6.
Figure 8.
Figure 8.. Phagocytosis of newly formed oligodendrocytes by early postnatal PAM.
(A) Single optical section of a confocal image (full stack in Movie S1) showing engulfment of nuclei by CLEC7A+ microglia in the P7 cerebellar white matter. Images from the X-Z and Y-Z axes are shown on the top and sides, respectively. (B) 3D reconstruction of a CLEC7A+ microglia (asterisk in (A)) engulfing a pyknotic nucleus. Arrow points to the microglia nucleus in transparent rendering of the CX3CR1-GFP channel. (C) Phagocytosis on slice culture sections showing that pH-sensitive beads were engulfed by CLEC7A+ microglia in CC (arrow heads) and CB white matter but rarely in other regions. Arrow points to beads-eaten CLEC7A+ cells near ventricles. (D) Quantification of the phagocytosis assay in (C). n=5 sections (3 fields for each section). *** P<0.001, ** P<0.01, * P<0.05. WM: white matter. (E) Immunostaining of P7 corpus callosum (CC) showing interactions between early postnatal PAM and MBP+ oligodendrocytes (arrows). Asterisks label cCASP3+ oligodendrocytes. Arrow head points to cCASP3+ inclusion in microglia. (F) Single optical section of a confocal image showing engulfment of cCASP3+ oligodendrocytes (inset) by CLEC7A+ microglia in the P7 CC. Images from the X-Z and Y-Z axes are shown on the top and left, respectively. The microglial cell (asterisk) physically contacting an oligodendrocyte is 3D reconstructed in (G). (H) Quantification for percentage of each cell type interacting with CLEC7A+ cells in CC. n=3 sections each. ** P<0.01, * P<0.05. (I) Mbp and Gfap transcripts in different P7 populations by scRNA-seq. tSNE plots (same as in Figure 6H) on the right highlight cells that have detectable Mbp or Gfap expression. Scale bars: 50um in (A), (E) and (F); 500um in (C); 10um in (B) and (G). Data are represented as mean ± SEM in (D) and (H). See also Figure S7, Table S6, Table S7, Movie S1, Movie S2.

Comment in

Similar articles

Cited by

References

    1. Anders S, Pyl PT, and Huber W (2015). HTSeq--a Python framework to work with high-throughput sequencing data. Bioinformatics 31, 166–169. - PMC - PubMed
    1. Ayata P, Badimon A, Strasburger HJ, Duff MK, Montgomery SE, Loh YE, Ebert A, Pimenova AA, Ramirez BR, Chan AT, et al. (2018). Epigenetic regulation of brain region-specific microglia clearance activity. Nature neuroscience 21, 1049–1060. - PMC - PubMed
    1. Barres BA, Hart IK, Coles HS, Burne JF, Voyvodic JT, Richardson WD, and Raff MC (1992). Cell death and control of cell survival in the oligodendrocyte lineage. Cell 70, 31–46. - PubMed
    1. Bennett ML, Bennett FC, Liddelow SA, Ajami B, Zamanian JL, Fernhoff NB, Mulinyawe SB, Bohlen CJ, Adil A, Tucker A, et al. (2016). New tools for studying microglia in the mouse and human CNS. Proceedings of the National Academy of Sciences of the United States of America - PMC - PubMed
    1. Bohlen CJ, Bennett FC, Tucker AF, Collins HY, Mulinyawe SB, and Barres BA (2017). Diverse Requirements for Microglial Survival, Specification, and Function Revealed by Defined-Medium Cultures. Neuron 94, 759–773 e758. - PMC - PubMed

Publication types

MeSH terms