. 2019 Jan 3;10(1):22.
doi: 10.1038/s41467-018-07884-6.

PRMT5 is essential for B cell development and germinal center dynamics

Affiliations

PRMT5 is essential for B cell development and germinal center dynamics

Ludivine C Litzler et al. Nat Commun. .

Abstract

Mechanisms regulating B cell development, activation, education in the germinal center (GC) and differentiation, underpin the humoral immune response. Protein arginine methyltransferase 5 (Prmt5), which catalyzes most symmetric dimethyl arginine protein modifications, is overexpressed in B cell lymphomas but its function in normal B cells is poorly defined. Here we show that Prmt5 is necessary for antibody responses and has essential but distinct functions in all proliferative B cell stages in mice. Prmt5 is necessary for B cell development by preventing p53-dependent and p53-independent blocks in Pro-B and Pre-B cells, respectively. By contrast, Prmt5 protects, via p53-independent pathways, mature B cells from apoptosis during activation, promotes GC expansion, and counters plasma cell differentiation. Phenotypic and RNA-seq data indicate that Prmt5 regulates GC light zone B cell fate by regulating transcriptional programs, achieved in part by ensuring RNA splicing fidelity. Our results establish Prmt5 as an essential regulator of B cell biology.


Conflict of interest statement

The authors declare no competing interests.

Figures

Fig. 1
Fig. 1
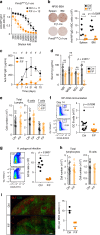
Regulated Prmt5 expression in B cells. a Prmt5 transcript levels in B cell stages from the indicated datasets, each normalized to follicular (Fo) B cells. RT-qPCR data were normalized to Actin mRNA and obtained from a pool of two mice sorted for Hardy’s BM fractions (FrA to E), or from splenic B cells from two mice stimulated ex vivo with LPS and IL-4 for 48 h (Activated). CLP common lymphoid progenitor, T1–T3 transitional B cells, MZ marginal zone B cells, PC plasma cells, Sp spleen. b Prmt5 expression kinetics and sDMA-modified proteins by WB in extracts of WT splenic B cells stimulated with LPS (5 µg/mL) and IL-4 (5 ng/mL) probed with anti-PRMT5, -Actin (as loading control), and -sDMA (SYM11) antibodies. c Absolute number of B cell subpopulations in the spleen of CD19-cre (Ctrl) and Prmt5F/F CD19-cre (F/F) mice. Individual mice (dots) and mean (bars) values are plotted. Gatings in Supplementary Fig. 1B. d Representative WB of resting splenic B cell extracts from CD19-cre (Ctrl) and Prmt5F/F CD19-cre (F/F) mice. Means + s.d. levels of Prmt5 normalized to Actin quantified from n mice by WB are plotted relative to the Ctrl. e Representative Prmt5, Actin, and sDMA (SYM11) WB and quantitation as in d, in extracts of splenic B cells activated with LPS (5 µg/mL) and IL-4 (5 ng/mL) for 72 h. f Prmt5 mRNA (by RT-qPCR) as a function of Prmt5 protein (by WB) at 72 h post-stimulation for individual mice. Spearman’s test correlation coefficient (r) and p-value (p) are indicated. g Representative immunohistochemical staining for PNA as GC marker and Prmt5 on consecutive mouse spleen sections at day 14 post-immunization. Scale bars, 500 µm
Fig. 2
Fig. 2
Prmt5 is required for the survival of activated B cells in vivo. All panels compare Prmt5F/F CD19-cre (F/F) versus CD19-cre (Ctrl) mice. a Representative flow cytometry plots of splenic GC B cells (B220+, GL7high, CD95+) 14 days after NP-CGG immunization. Total number of GC B cell number for individual mice (symbols) and mean values (bars) from three experiments are plotted. b Representative immunofluorescence microscopy of mouse spleen sections stained for Prmt5, B220, GL7, and IgD from unimmunized (two per genotype from one experiment) or immunized with NP-CGG, day 14 (four per genotype from two experiments). Scale bars, 100 μm. The Prmt5 signal per follicular (Fo) and GC B cell was quantified in individual follicles from four immunized mice of each genotype. The lefthand plot shows mean normalized Prmt5 signal in Fo and GC B cells from 4–7 follicles per mouse (symbols), with lines joining mean values (bars) of the two B cell types in individual mice. The righthand plot shows the mean GC/Fo signal ratio per mouse. c Absolute number of splenic lymphocytes for individual mice unimmunized or 14 days post-immunization (symbols) with means (bars) from two experiments. d Representative histograms of GL7 expression in non-GC B cells (B220+ CD95) from mice injected or not with Alum (day 14). One experiment, two mice per genotype per treatment. e Absolute number of B and T cells in mesenteric lymph node (MLN) and spleen of individual mice (symbols) 14 days post-infection with H. polygyrus, with medians (bars), from two experiments. f Sequential gating to analyze T, GC, and non-GC B cells, as well as the GL7− and GL7+ fractions of the latter (top) and representative histograms of pan-caspase staining in MLN of the mice analyzed in e. Gates were set using cells treated with etoposide (3 µM). Means + s.d. proportion of pan-caspase+ cells from six mice from two experiments are plotted, normalized to the control’s average for each subset. p-Values are by Mann–Whitney test (b) or an unpaired, two-tailed Student's t test (c, e, f); ns, not significant
Fig. 3
Fig. 3
Prmt5 protects B cells from apoptosis and promotes proliferation. ad One million naïve splenic B cells from CD19-cre (Ctrl) and Prmt5F/F CD19-cre (F/F) mice were plated with LPS (5 µg/mL) + IL-4 (5 ng/mL). a Cell expansion over time monitored by cell counting (left) and number of cell divisions by day 3 monitored by CFSE stain dilution (right) from two experiments, four mice per genotype. b Cell cycle profile of cells pulsed with BrdU at day 3 before staining with anti-BrdU and propidium iodide (PI). Data for three mice (symbols) per genotype and means (bars) from one experiment are plotted. c Representative Annexin-V+ staining histograms of B cells 3 days post-plating. The proportion of Annexin-V+ cells for individual mice (symbols) and means (bars) from five experiments are plotted normalized to the Ctrl mean. d Proportion of Annexin-V+ B cells as a function of Prmt5 protein levels measured by WB and normalized to Actin 72 h post-stimulation. Spearman’s correlation coefficient (r) and p-value (p) are indicated. e WB of Prmt5 and Revert protein staining as loading control in extracts of splenic B cells from Cγ1-cre (Ctrl) and Prmt5F/F Cγ1-cre (F/F) mice, stimulated as in a for 72 h. The normalized proportion of Annexin-V+ cells for individual mice (symbols) from three experiments and mean values (bars) are plotted. f Top, resting splenic B cells from Prmt5F/+ CD19-cre (Ctrl) or Prmt5F/F CD19-cre (F/+) and Prmt5F/F CD19-cre (F/F) mice plated onto 40LB cells with 1 ng/mL IL-4 to generate GC-like B cells (iGBs). Mean ± s.e.m. cell counts per day are plotted for two experiments with two mice each. Bottom, proportion of Annexin-V+ iGBs for individual mice (symbols) and means (bars) for both experiments are plotted, pooling +/+ and F/+ as controls. g Cγ1-cre (Ctrl) and Prmt5F/F Cγ1-cre (F/F) mice iGBs analyzed as in f. h Representative cell cycle profile as in b in Cγ1-cre (Ctrl) and Prmt5F/F Cγ1-cre (F/F) iGBs at day 4. Means + s.d. of six mice per genotype from three experiments are plotted. Unpaired, two-tailed Student's t test was performed in a, c, eg, only significant p-values are shown
Fig. 4
Fig. 4
Antibody response and GC defects caused by Prmt5 deficiency. ai Cγ1-cre (Ctrl) and Prmt5F/F Cγ1-cre (F/F) mice were used throughout. a Total anti-NP IgG1 in the serum of mice, measured by ELISA 14 days after NP-CGG immunization. Mean ± s.d. OD values for serial dilutions are plotted for n mice from three experiments. b Representative pictures of ELISPOT for NP-specific IgG1 antibody secreting cells (ASC) at day 14 post-immunization. The number of ASC of individual mice (symbols) and means (bars) are plotted. c Anti-NP IgG1 in the serum of mice at various times post-immunization. Mean ± s.d. values for n mice at each time point from two experiments are plotted. d Total levels of antibody isotypes in the serum of n non-immunized mice. e Mean + s.d. number of lymphocytes per spleen at day 14 post-immunization, enumerated by flow cytometry for n mice from two experiments. f Representative flow cytometry plots (gated on B220+) of splenic GC B cell proportions at 14 days post-immunization with NP-CGG. The number of GC B cells per spleen for individual mice (symbol) and medians (bars) from three experiments are plotted. g As in f, for MLN of mice infected with H. polygyrus for 14 days. Data from two experiments are plotted. h Mean + s.d. number of lymphocytes per MLN in the mice from g. i Representative IF in MLN from mice infected with H. polygyrus from g, stained for the indicated antigens. Scale bar, 100 µm. GC numbers per MLN scored in individual mice (symbols) are plotted to the right. p-Values throughout are by an unpaired, two-tailed Student's t test
Fig. 5
Fig. 5
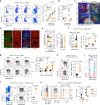
Prmt5 is necessary for GC expansion. al Cγ1-cre (Ctrl) versus Prmt5F/F Cγ1-cre (F/F) mice. a Representative flow cytometry plots for GC B cells at various times post-SRBC immunization. Mean ± s.d. absolute GC B cell numbers from n mice from two to three experiments are plotted. b GCs per spleen section in individual mice (symbols), with means (bars). c Representative fluorescent microscopy images of spleen sections from mice in a stained for B cells (B220), T cells (CD3), FDCs (CD35), and activated B cells (GL7). Scale bar, 100 µm. d Representative IF confocal images in splenic sections from immunized mice, stained for the indicated markers, Prmt5 and sDMA (SYM11). GCs are contoured. Scale bars, 100 µm. e Representative histograms of activated pan-caspase staining in splenic GC B cells at day 8 post-SRBC immunization. Etoposide (3 µM) was used to induce apoptosis as a positive control. Mean + s.d. proportion of caspase+ GC B cells for six mice per group from two independent experiments are plotted. f Representative histograms of Ki67 expression in splenic GC B cells. Mean + s.d. proportion of Ki67low GC B cells for individual mice (symbols) from two experiments and means (bars) are plotted. g Representative flow cytometry plots of dark zone (DZ), light zone (LZ), and a CXCR4 CD86low GC B cells (gated on B220+ Gl7+ CD95+) in SRBC-immunized mice. The proportion of CXCR4 CD86low GC B cells for individual mice (symbols) from two to three experiments and means (bars) are plotted. h GC B cells in mice infected with H. polygyrus for 14 days analyzed as in g. Data from two experiments. i Representative histograms of Ki67 levels in GC B cell subsets in mice immunized with SRBC. j GC B cells and subpopulations as in g for Aicda/− Cγ1-cre (Ctrl) or Aicda−/− Prmt5F/F Cγ1-cre (F/F) mice immunized with SRBC. k Histograms of AID-GFP levels for individual Aicda-GFPtg Cγ1-cre (Ctrl) or Aicda-GFPtg Prmt5F/F Cγ1-cre (F/F) mice at day 9 post-SRBC immunization. The AIDdim/AIDhigh ratio for individual mice (symbols) from two experiments and means (bars) are plotted. p-Values indicated throughout are by an unpaired, two-tailed Student's t test
Fig. 6
Fig. 6
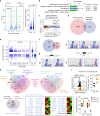
Prmt5 regulates gene expression and maintains splicing fidelity in B cells. a Volcano plot of gene expression changes in Prmt5F/F Cγ1-cre versus Cγ1-cre iGB cells. The number of genes significantly changed by ≥2- or ≥4-fold (in red), are indicated. The violin plot shows the absolute change for the genes changing by ≥2-fold, p value from two-sided t-test. b GO terms significantly enriched for the 257 genes upregulated ≥2-fold in Prmt5-null iGBs, analyzed against a background list of all expressed genes in iGBs at the DAVID server. c GSEA of a curated set of 346 genes that are direct targets of p53 and are upregulated in response to p53. d Venn diagrams comparing genes differentially expressed by ≥1.5-fold to genes with at least one splicing alteration. Only significant events (P-value <0.05) for well-expressed genes (basemean >50) are included. e Scatter plot of inclusion level difference (ILD) in WT/KO for each significant splicing event (P < 0.05, ≥10% ILD) separated by category (SE, skipped exon; MXE, mutually exclusive exons; A5SS and A3SS, altered 5′ and 3′ splicing site; RI, retained intron). Violin plots for SE and RI highlight the preferential direction of the change in each. f Venn diagram of significant skipped exon (SE) and retained intron (RI) events. g Sequence logos of the splicing donor and acceptor sites around RI and SE events in Prmt5F/F Cγ1-cre iGBs. Each letter’s height represents the probability of appearing at that position. h Venn diagrams of chosen overlapping GO terms containing genes with significantly affected splicing in Prmt5-null B cells. Selected genes involved in DNA repair are indicated along with ILD and splicing event type. i Representative histograms of γH2AX staining in Cγ1-cre (Ctrl) and Prmt5F/F Cγ1-cre (F/F) mice GC B cells (B220+ Gl7+ CD95+), 10 days post-SRBC immunization. Proportion of γH2AX+ and normalized γH2AX levels estimated from mean fluorescent intensity (MFI) are plotted for five mice (symbols) per genotype from two experiments. p-Values are by an unpaired, two-tailed Student's t test
Fig. 7
Fig. 7
Prmt5 is required for B cell development. a BM lymphocytes and splenic B cells in MB1-cre (Ctrl) or Prmt5F/F MB1-cre (F/F) mice. Representative flow cytometry plots and bar plots of mean + s.d. absolute lymphocyte counts for n mice from four experiments. b Representative flow cytometry plots gating for Hardy fractions A to E in BM from 3–4-months-old MB1-cre (Ctrl) and Prmt5F/F MB1-cre (F/F) mice. Means + s.d. of absolute cell numbers for each fraction from n of mice from four independent experiments are plotted. c As in b, for MB1-cre B1-8 (ki+/+) and Prmt5F/F MB1-cre B1-8 (ki F/F) mice, from three experiments. d As in b, for MB1-cre Trp53−/− (pko+/+) and Prmt5F/F MB1-cre Trp53−/− (pko F/F) mice, from three experiments. e Proportion of large Pre-B cells in fractions C+C′ estimated by the pre-BCR expression in individual (symbols) MB1-cre Trp53−/− (Ctrl) and Prmt5F/F MB1-cre Trp53−/− (F/F) mice. p-Values throughout are from an unpaired, two-tailed Student's t test
Fig. 8
Fig. 8
Prmt5 loss induces p53-independant apoptosis. a WB probed for the indicated proteins on extracts from CD19-cre (Ctrl) and Prmt5F/F CD19-cre (F/F) splenic B cells cultured with LPS and IL-4 for 3 days. b Gene transcript levels by RT-qPCR in splenic B cells from a. Mean + s.d. RNA level normalized to Actin for n mice are plotted relative to the Ctrl mean. c Representative histograms of Annexin-V levels in CD19-cre (Ctrl) and Prmt5F/F CD19-cre (F/F) mice in either Trp53+/+ or Trp53−/− background. Annexin-V+ proportion for individual mice and mean + s.e.m cell concentration over time are plotted from one experiment. d Representative confocal microscopy of sDMA (SYM11) IF in iGB cells from wt mice treated with DMSO or 5 μM EPZ for 48 h. Large nuclei are from feeder cells. Scale bar, 10 µm. e Expansion of iGBs derived from wt, Trp53−/− and Cdkn1a−/− splenic B cells, treated with DMSO or EPZ 24 h after plating. Means ± s.e.m cell counts of two mice from one experiment are plotted. f Sensitivity of iGB cells to EPZ 4 days after treating with EPZ doses. Relative mean ± s.e.m cell number and Cdkn1a expression by RT-qPCR are plotted for two mice from one experiment. g Expansion of iGBs from Cγ1-cre (Ctrl) and Prmt5F/F Cγ1-cre (F/F) mice and their Trp53−/− counterparts. Mean ± s.e.m of cell count for n mice are plotted. h Cell cycle profile of Cγ1-cre Trp53−/− (Ctrl) and Prmt5F/F Cγ1-cre Trp53−/− (F/F) iGBs pulsed with BrdU for 1 h at day 4 and stained with anti-BrdU and propidium iodide (PI). Means + s.d. for three mice per genotype from two independent experiments are plotted. i GC B cells in the spleen of Cγ1-cre Trp53−/− (Ctrl) and Prmt5F/F Cγ1-cre Trp53−/− (F/F) mice 10 days after immunization with SRBC. Individual mice (symbols) and mean (bars) values are plotted from three experiments. j Representative flow cytometry and proportion of GC Cxcr4 Cd86low B cells in the mice in i. p-Values throughout are from an unpaired, two-tailed Student's t test
Fig. 9
Fig. 9
Prmt5 acts in the light zone to prevent B cell differentiation. a IHC images for Prmt5 and AID, as GC marker, on consecutive spleen sections from wt mice 14 days post-NP-CGG immunization. Representative of three mice from two experiments. Scale bar, 40 µm. b Representative IF on wt mouse spleen section 10 days after SRBC immunization, stained for GL7 CD35 (LZ marker) and Prmt5. Scale bar, 100 µm. c GSEA of transcriptional changes in Prmt5F/F Cγ1-cre (F/F) versus Cγ1-cre (Ctrl) iGB cells against the indicated gene signatures. Enrichment was considered significant for P < 0.05 and FDR < 5%. d Relative gene expression in positively selected GC B cells. e Proportion of plasma cell-like B cells in Cγ1-cre (Ctrl) or Prmt5F/F Cγ1-cre (F/F) iGB cultures at day 7 post-plating, or at day 3 after replating with 1 ng/mL IL-4 or 10 ng/mL IL-21. Individual mice (symbols) from one experiment are plotted. f Representative flow cytometry histograms of intracellular IgG1 and IgM staining of plasma cells in Prmt5F/F Cγ1-cre (F/F) or Cγ1-cre (Ctrl) mice 6 days post-SRBC immunization. Proportion of IgG1+ and IgM+ plasma cells in individual mice (symbols) from two experiments are plotted. g Representative flow cytometry plots of plasma cells in CD19-cre (Ctrl) or Prmt5F/F CD19-cre (F/F) B cells cultured 4 days in LPS and IL-4. Plasma cell proportion for individual mice (symbols) from three independent experiments are plotted. h Gene expression by RT-qPCR in splenic B cells cultured as in g for 3 days. Mean + s.d. mRNA levels normalized to Actin for n mice from two experiments are plotted relative to Ctrl average. i Mean ± s.d. (or ± s.e.m for n = 2) of plasma cell proportion in splenic B cells stimulated with LPS and IL-4 and treated with various EPZ doses for 4 days, are plotted for n mice from one to five experiments. j Gene expression by RT-qPCR in B cells treated with 5 μM EPZ as in i; individual mice (symbols) are plotted. Bars indicate mean values in all scatter plots. Significant p-values throughout are by an unpaired, two-tailed Student's t test except for GSEA, in which statistics are indicated

Similar articles

Cited by

References

    1. Clark MR, Mandal M, Ochiai K, Singh H. Orchestrating B cell lymphopoiesis through interplay of IL-7 receptor and pre-B cell receptor signalling. Nat. Rev. Immunol. 2014;14:69–80. doi: 10.1038/nri3570. - DOI - PMC - PubMed
    1. De Silva NS, Klein U. Dynamics of B cells in germinal centres. Nat. Rev. Immunol. 2015;15:137–148. doi: 10.1038/nri3804. - DOI - PMC - PubMed
    1. Kouzine F, et al. Global regulation of promoter melting in naive lymphocytes. Cell. 2013;153:988–999. doi: 10.1016/j.cell.2013.04.033. - DOI - PMC - PubMed
    1. Victora GD, Nussenzweig MC. Germinal centers. Annu. Rev. Immunol. 2012;30:429–457. doi: 10.1146/annurev-immunol-020711-075032. - DOI - PubMed
    1. Nutt SL, Hodgkin PD, Tarlinton DM, Corcoran LM. The generation of antibody-secreting plasma cells. Nat. Rev. Immunol. 2015;15:160–171. doi: 10.1038/nri3795. - DOI - PubMed

Publication types

MeSH terms

Substances