Cardiomyocyte cell cycle dynamics and proliferation revealed through cardiac-specific transgenesis of fluorescent ubiquitinated cell cycle indicator (FUCCI)
- PMID: 30571978
- PMCID: PMC6588545
- DOI: 10.1016/j.yjmcc.2018.12.007
Cardiomyocyte cell cycle dynamics and proliferation revealed through cardiac-specific transgenesis of fluorescent ubiquitinated cell cycle indicator (FUCCI)
Abstract
Rationale: Understanding and manipulating the cardiomyocyte cell cycle has been the focus of decades of research, however the ultimate goal of activating mitotic activity in adult mammalian cardiomyocytes remains elusive and controversial. The relentless pursuit of controlling cardiomyocyte mitosis has been complicated and obfuscated by a multitude of indices used as evidence of cardiomyocyte cell cycle activity that lack clear identification of cardiomyocyte "proliferation" versus cell cycle progression, endoreplication, endomitosis, and even DNA damage. Unambiguous appreciation of the complexity of cardiomyocyte replication that avoids oversimplification and misinterpretation is desperately needed.
Objective: Track cardiomyocyte cell cycle activity and authenticate fidelity of proliferation markers as indicators of de novo cardiomyogenesis in post-mitotic cardiomyocytes.
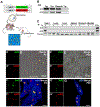
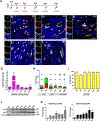
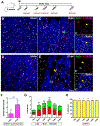
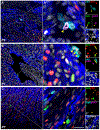
Methods and results: Cardiomyocytes expressing the FUCCI construct driven by the α-myosin heavy chain promoter were readily and uniformly detected through the myocardium of transgenic mice. Cardiomyocyte cell cycle activity peaks at postnatal day 2 and rapidly declines thereafter with almost all cardiomyocytes arrested at the G1/S cell cycle transition. Myocardial infarction injury in adult hearts prompts transient small increases in myocytes progressing through cell cycle without concurrent mitotic activity, indicating lack of cardiomyogenesis. In comparison, cardiomyogenic activity during early postnatal development correlated with coincidence of FUCCI and cKit+ cells that were undetectable in the adult myocardium.
Conclusions: Cardiomyocyte-specific expression of Fluorescence Ubiquitination-based Cell Cycle Indicators (FUCCI) reveals previously unappreciated aspects of cardiomyocyte cell cycle arrest and biological activity in postnatal development and in response to pathologic damage. Compared to many other methods and model systems, the FUCCI transgenic (FUCCI-Tg) mouse represents a valuable tool to unambiguously track cell cycle and proliferation of the entire cardiomyocyte population in the adult murine heart. FUCCI-Tg provides a desperately needed novel approach in the armamentarium of tools to validate cardiomyocyte proliferative activity that will reveal cell cycle progression, discriminate between cycle progression, DNA replication, and proliferation, and provide important insight for enhancing cardiomyocyte proliferation in the context of adult myocardial tissue.
Keywords: Cardiomyocyte; Cell-cycle; FUCCI; Myocardial infarct; Regeneration.
Copyright © 2018 Elsevier Ltd. All rights reserved.
Figures


Similar articles
-
Identification and characterization of distinct cell cycle stages in cardiomyocytes using the FUCCI transgenic system.Exp Cell Res. 2021 Nov 15;408(2):112880. doi: 10.1016/j.yexcr.2021.112880. Epub 2021 Oct 14. Exp Cell Res. 2021. PMID: 34655601
-
Time-lapse imaging of cell cycle dynamics during development in living cardiomyocyte.J Mol Cell Cardiol. 2014 Jul;72:241-9. doi: 10.1016/j.yjmcc.2014.03.020. Epub 2014 Apr 3. J Mol Cell Cardiol. 2014. PMID: 24704900
-
Analysis of cardiomyocyte movement in the developing murine heart.Biochem Biophys Res Commun. 2015 Sep 4;464(4):1000-1007. doi: 10.1016/j.bbrc.2015.07.036. Epub 2015 Jul 10. Biochem Biophys Res Commun. 2015. PMID: 26168730
-
Adult Cardiomyocyte Cell Cycle Detour: Off-ramp to Quiescent Destinations.Trends Endocrinol Metab. 2019 Aug;30(8):557-567. doi: 10.1016/j.tem.2019.05.006. Epub 2019 Jun 28. Trends Endocrinol Metab. 2019. PMID: 31262545 Free PMC article. Review.
-
Promoting cardiomyocyte proliferation for myocardial regeneration in large mammals.J Mol Cell Cardiol. 2024 Mar;188:52-60. doi: 10.1016/j.yjmcc.2024.01.005. Epub 2024 Feb 9. J Mol Cell Cardiol. 2024. PMID: 38340541 Review.
Cited by
-
Cardiac regenerative therapy: Many paths to repair.Trends Cardiovasc Med. 2020 Aug;30(6):338-343. doi: 10.1016/j.tcm.2019.08.009. Epub 2019 Sep 2. Trends Cardiovasc Med. 2020. PMID: 31515053 Free PMC article. Review.
-
CCND2 Modified mRNA Activates Cell Cycle of Cardiomyocytes in Hearts With Myocardial Infarction in Mice and Pigs.Circ Res. 2023 Sep;133(6):484-504. doi: 10.1161/CIRCRESAHA.123.322929. Epub 2023 Aug 11. Circ Res. 2023. PMID: 37565345 Free PMC article.
-
The small molecule Chicago Sky Blue promotes heart repair following myocardial infarction in mice.JCI Insight. 2019 Nov 14;4(22):e128025. doi: 10.1172/jci.insight.128025. JCI Insight. 2019. PMID: 31723055 Free PMC article.
-
Adaptation within embryonic and neonatal heart environment reveals alternative fates for adult c-kit+ cardiac interstitial cells.Stem Cells Transl Med. 2020 May;9(5):620-635. doi: 10.1002/sctm.19-0277. Epub 2019 Dec 31. Stem Cells Transl Med. 2020. PMID: 31891237 Free PMC article.
-
Cardiac interstitial tetraploid cells can escape replicative senescence in rodents but not large mammals.Commun Biol. 2019 Jun 13;2:205. doi: 10.1038/s42003-019-0453-z. eCollection 2019. Commun Biol. 2019. PMID: 31231694 Free PMC article.

