

A selective ER-phagy exerts procollagen quality control via a Calnexin-FAM134B complex
- PMID: 30559329
- PMCID: PMC6331724
- DOI: 10.15252/embj.201899847
A selective ER-phagy exerts procollagen quality control via a Calnexin-FAM134B complex
Abstract
Autophagy is a cytosolic quality control process that recognizes substrates through receptor-mediated mechanisms. Procollagens, the most abundant gene products in Metazoa, are synthesized in the endoplasmic reticulum (ER), and a fraction that fails to attain the native structure is cleared by autophagy. However, how autophagy selectively recognizes misfolded procollagens in the ER lumen is still unknown. We performed siRNA interference, CRISPR-Cas9 or knockout-mediated gene deletion of candidate autophagy and ER proteins in collagen producing cells. We found that the ER-resident lectin chaperone Calnexin (CANX) and the ER-phagy receptor FAM134B are required for autophagy-mediated quality control of endogenous procollagens. Mechanistically, CANX acts as co-receptor that recognizes ER luminal misfolded procollagens and interacts with the ER-phagy receptor FAM134B. In turn, FAM134B binds the autophagosome membrane-associated protein LC3 and delivers a portion of ER containing both CANX and procollagen to the lysosome for degradation. Thus, a crosstalk between the ER quality control machinery and the autophagy pathway selectively disposes of proteasome-resistant misfolded clients from the ER.
Keywords: Calnexin; FAM134B; autophagy; collagen; endoplasmic reticulum.
© 2018 The Authors. Published under the terms of the CC BY 4.0 license.
Figures
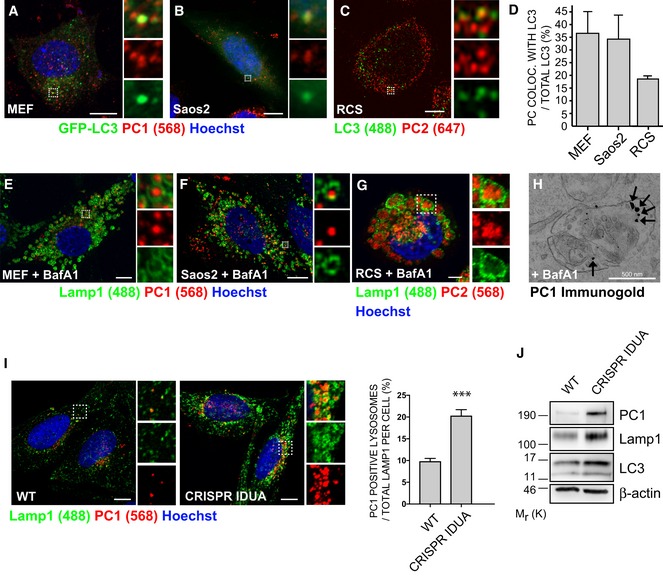
- A, B
Airyscan confocal analysis of PC1 (568, red) co‐localization with GFP‐LC3 (green) in (A) MEF (B) Saos2. Scale bars = 10 μm. The insets show higher magnification (A = x4.68; B = x6.76) and single colour channels of the boxed area.
- C
Airyscan confocal analysis of PC2 (647, red) co‐localization with LC3 (488, green) in RCS cells. Scale bars = 10 μm. The insets show higher magnification (x7.33) and single colour channels of the boxed area.
- D
Quantification of GFP (A, B) or LC3 (C) vesicles positive for PC1 or PC2, expressed as % of total LC3 (mean ± SEM), n = 18 cells (MEFs and Saos2); n = 12 (RCS) from three independent experiments.
- E–G
Scanning confocal microscopy analysis of MEFs, Saos2 and RCS cells treated with BafA1, immunolabelled for PC1 or PC2 and LAMP1. Nuclei were stained with Hoechst. (E, F) Scale bars = 10 μm, (G) Scale bars = 5 μm. The insets show higher magnification (E = x4.99; F = x6.49; G = x2.01) and single colour channels of the boxed area.
- H
Transmission EM analysis in Saos2 cells, treated with BafA1, showing in detail a lysosome which contains immunolabelled PC1 (with nanogold particles), as indicated by arrows.
- I
Scanning confocal microscopy analysis of Saos2 WT and CRISPR‐Cas9 IDUA Saos2 at steady state, immunolabelled for PC1 and LAMP1. Nuclei were stained with Hoechst. Scale bar = 10 μm. The insets show higher magnification (left = x3.09; right = x3.12) and single colour channels of the boxed area. Bar graph shows quantification of lysosomes containing PC1 expressed as % of total LAMP1 per cell (mean ± SEM). n = 31 WT cells, n = 33 CRISPR cells counted; three independent experiments. Student's unpaired, two‐tailed t‐test ***P < 0.0001.
- J
WT and CRISPR‐IDUA Saos2 lysed and analysed by Western blot. Data are representative of three independent experiments.
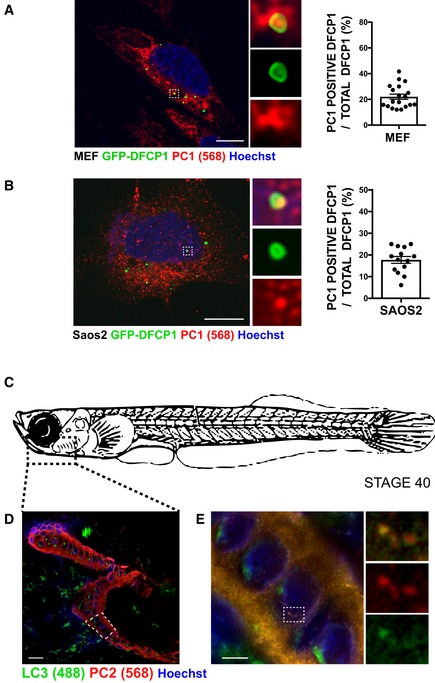
- A, B
Scanning confocal analysis of immunofluorescence for PC1 (568, red) and GFP‐DFCP1 (green) in (A) MEF and (B) Saos2 and quantification of AVs positive for GFP‐DFCP1 containing PC1 expressed as % of total DFCP1 per cell (mean ± SEM). The insets show higher magnification (A = x5.9; B = x6.04) and single colour channels of the boxed area. Scale bar = 10 μm. (A) n = 19 and (B) n = 14 cells counted per condition; three independent experiments.
- C
Schematic representation of a stage 40 medaka fish. Dotted box represents area of mandible analysed in (D and E).
- D
Scanning confocal image of mandible from stage 40 medaka, immunostained with LC3 (488, green) PC2 (568, red) and nuclei stained with Hoechst (blue). Dotted box represents area of mandible containing osteoblasts that was further analysed in (E). Scale bar = 20 μm.
- E
Airyscan confocal image of mandible at higher magnification, scale bar = 3 μm. Boxes on the right show magnification (x4.02) of boxed area.
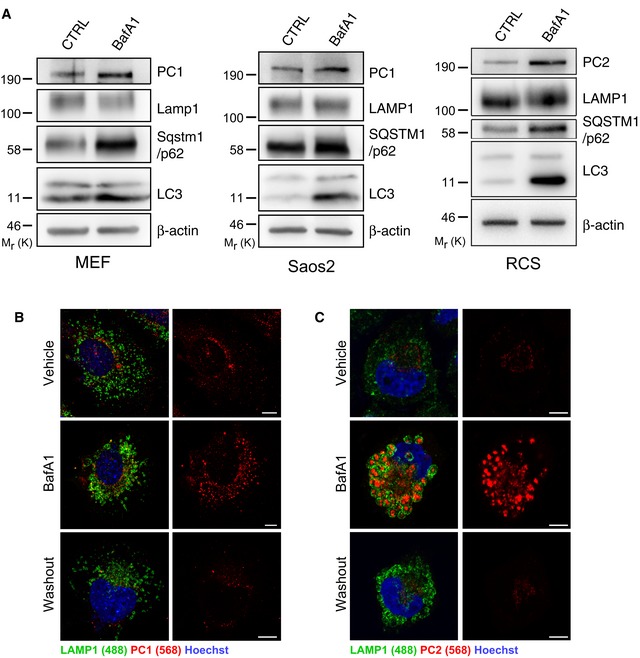
- A
MEFs, Saos2 and RCS were untreated or treated with 100 nM BafA1 for 6 h in MEFs, 100 nM BafA1 for 9 h in Saos2, 200 nM BafA1 for 6 h in RCS, then lysed and analysed by Western blot. Bands were visualized with antibodies against PC1, PC2, LAMP1, SQSTM1/p62, LC3 and β‐actin. Western blots are representative of three independent experiments.
- B, C
(B) MEFs or (C) RCS treated with vehicle, 100 nM BafA1 for 4 h, followed by 4‐h washout. Cells immunolabelled with LAMP1 (488, green) and PC1 (568, red). Nuclei were stained with Hoechst (blue). Scale bars = 10 μm.
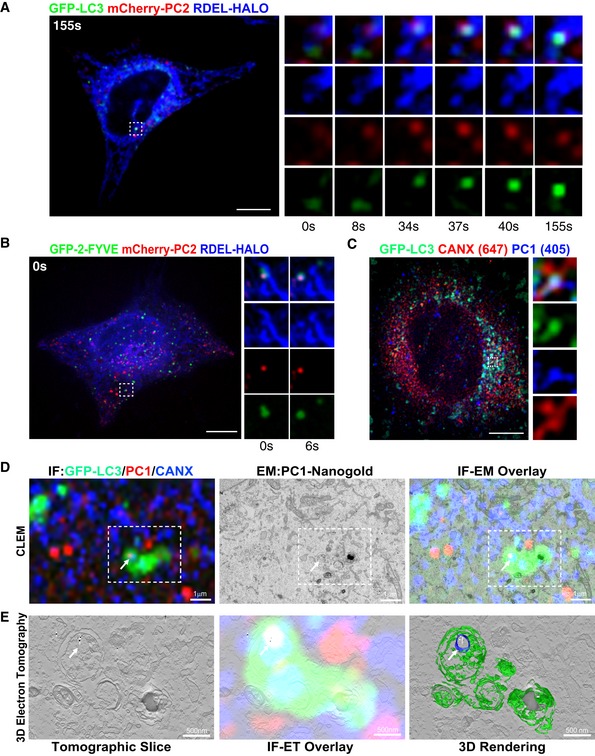
- A, B
U2OS expressing (A) GFP‐LC3 or (B) GFP‐2‐FYVE (green), mCherry‐PC2 (red) and RDEL‐HALO (blue) were imaged live by spinning disc microscopy. Single and merge channels time‐lapse stills at higher magnification (A = x3.93; B = x3.42) from the boxed region are shown on the right. Scale bar = 10 μm.
- C
Airyscan analysis of Saos2 cells expressing GFP‐LC3 (green) and immunolabelled for PC1 (405, blue) and CANX (647, red). The insets show higher magnification (x5.26) and single colour channels of the boxed area. Scale bar = 10 μm.
- D
Correlative light electron microscopy (CLEM) and electron tomography of Saos2 cells transfected with GFP‐LC3 (green) and labelled for PC1 (568, red and nanogold particles) and CANX (647, blue). Cells were first imaged by confocal microscopy (top left panel), and then, the same region was retraced in EM (upper middle panel) and overlay is shown (upper right panel). Arrow indicates a LC3‐positive vesicle containing CANX and PC1 molecules.
- E
Single tomography slice (left panel, taken from boxed are in D at a magnification of x2.84), overlay with immunofluorescence (IF) (central panel) and IF 3D rendering of AV (green) and the CANX positive vesicle containing gold particles of labelled collagen (blue and white, respectively) inside an AV (right panel).
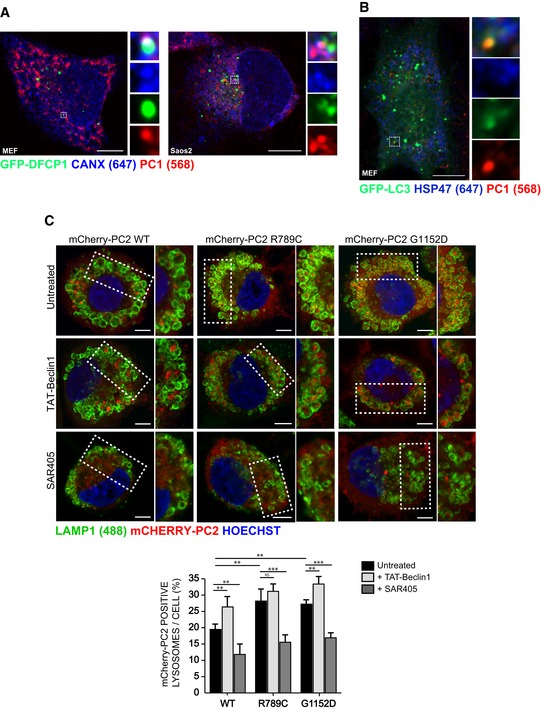
DFCP1, a marker of autophagosome biogenesis co‐localizes with PC1 and CANX. GFP‐DFCP1 (green) expressing MEF and Saos2 immunolabelled for PC1 (568, red) and CANX (647, blue). Cells were imaged with scanning confocal microscopy. The insets show higher magnification (left = x5.57; right = x4.25) and single colour channels of the boxed area. Scale bars = 10 μm.
Hsp47 is excluded from PC1 containing autophagosomes. GFP‐LC3 (green) expressing MEFs immunolabelled for PC1 (568, red) and Hsp47 (647, blue). Cells were imaged by scanning confocal microscopy. The insets show higher magnification (x4.34) and single colour channels of the boxed area. Scale bars = 10 μm.
Mutant PC2 is targeted to lysosomes at a higher rate than WT, and modulated via autophagy. RCS cells were transiently transfected with mCherry‐PC2 WT, R789C or G1152D mutants (568, red) and treated for 6 h with 100 nM BafA1, and as indicated with SAR405 or Tat‐BECLIN‐1. Cells were fixed and immunolabelled for LAMP1 (488, green). Nuclei were stained with Hoechst (blue). The insets show higher magnification (top left to bottom right: x1.37, x1.2, x1.39, x1.34, x1.44, x1.07, x1.61, x1.7, x1.56). Scale bars = 10 μm. Bar graph shows quantification of LAMP1 vesicles positive for mCherry‐PC2, expressed as % of total lysosomes per cell (mean ± SEM), minimum of n = 11 cells per genotype. Two‐way ANOVA with Tukey's post hoc test performed and P‐value adjusted for multiple comparisons. ns ≥ 0.05, **P < 0.005; ***P < 0.0001.
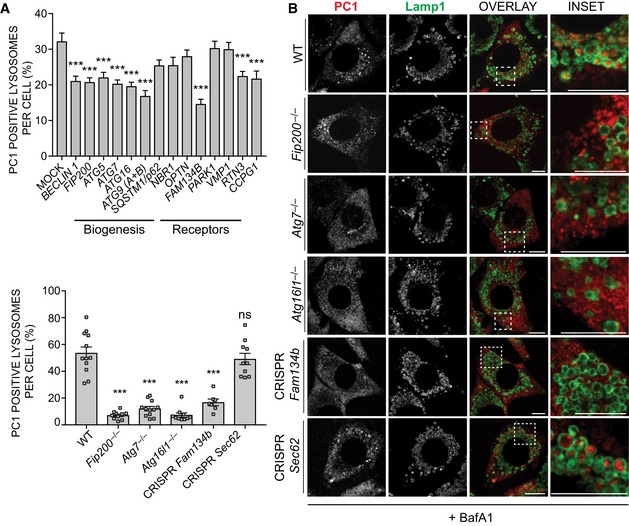
Bar graph shows quantification of lysosomes (LAMP1+) containing PC1 expressed as % of total number of lysosomes (mean ± SEM) in Saos2 cells mock transfected or transfected with siRNA against the indicated genes and treated with 100 nM BafA1 for 9 h. n = 20 cells per condition; three independent experiments. One‐way ANOVA with Dunnett's multiple comparisons test performed, ***P < 0.0001.
MEF cell lines lacking the expression of indicated genes were treated for 12 h with 50 nM BafA1, fixed and immunolabelled for PC1 (568, red) and LAMP1 (488, green). Scale bar = 10 μm. Insets show magnification of the boxed area. Bar graph (on the left) shows quantification of LAMP1 vesicles positive for PC1, expressed as % of total lysosomes (mean ± SEM), n = 12, 10, 12, 10, 7, 10 cells per genotype, respectively; three independent experiments. One‐way ANOVA with Dunnett's multiple comparisons test performed and P‐value adjusted for multiple comparisons. ns ≥ 0.05, ***P < 0.0001.
- A–C
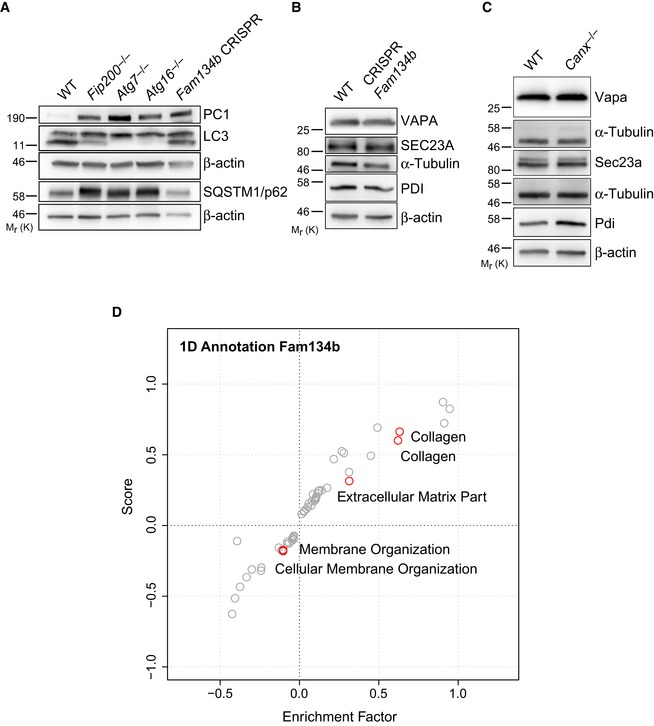
WT and KO MEFs for indicated genes were lysed at steady state and analysed by Western blotting. Bands were visualized with antibodies against PC1, SQSTM1/p62, LC3, Sec23a, VAPA, PDI and α‐tubulin or β‐actin as controls. Western blots are representative of three independent experiments.
- D
Collagens are highly enriched in Fam134b −/−. Scatter plot for 1D annotation enrichment analysis of significantly upregulated peptides in the Fam134b −/− MEFs proteome.
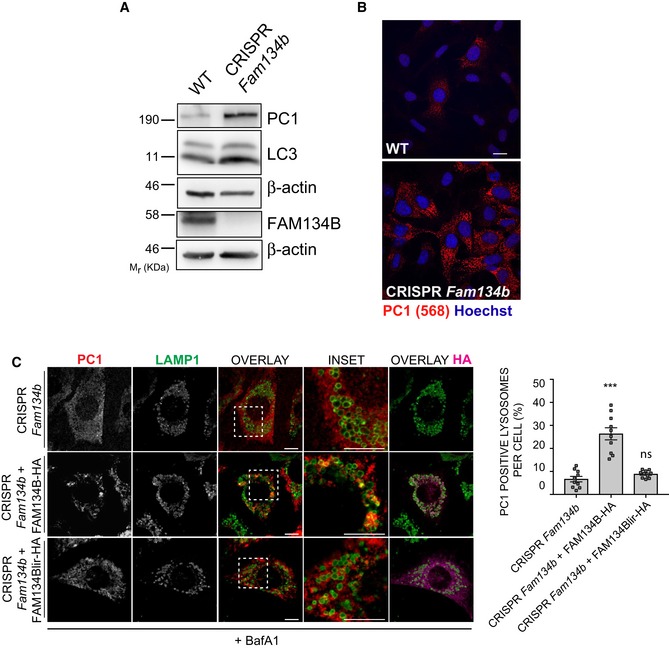
WT and CRISPR‐Cas9 Fam134b knockout MEFs were treated as indicated, lysed and analysed by Western blot with the indicated antibodies. Western blots are representative of 4 independent experiments.
WT and CRISPR‐Cas9 Fam134b MEFs were immunolabelled for PC1 (568, red), nuclei stained with Hoechst (blue) and analysed by scanning confocal microscopy. Scale bar = 10 μm.
CRISPR Fam134b MEF mock, wild‐type FAM134B‐HA or FAM134Blir‐HA transfected were immunolabelled for PC1 (568, red), Lamp1 (488, green) and HA (647, violet) and analysed by scanning confocal microscopy. Scale bar = 10 μm. Inset panels show magnification of the boxed area. Bar graph shows quantification of Lamp1 vesicles positive for PC1, expressed as % of total lysosomes (mean ± SEM), quantification of n = 10 cells per treatment; three independent experiments. One‐way ANOVA with Dunnett's multiple comparisons test was performed. ns ≥ 0.05, ***P < 0.0001.
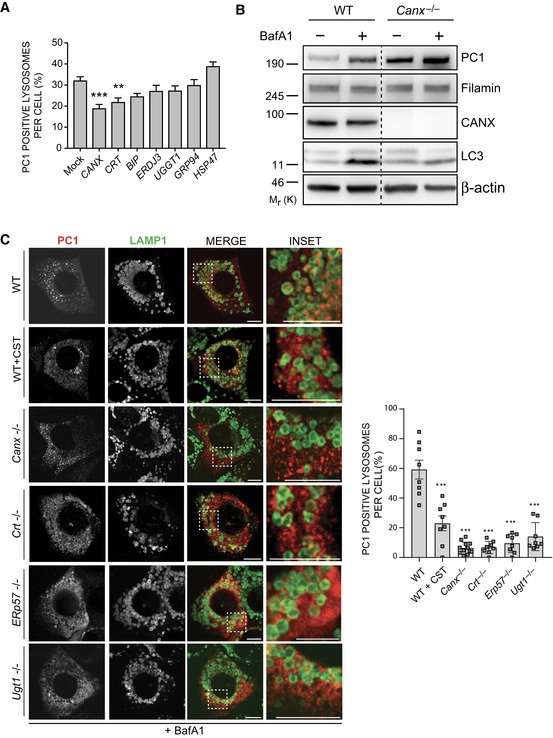
Bar graph shows quantification of lysosomes (LAMP1+) containing PC1 expressed as % of lysosomes (mean ± SEM) in Saos2 cells mock transfected or transfected with siRNA against the indicated genes, treated with 100 nM BafA1 for 9 h. n = 18 cells/treatment; three independent experiments. One‐way ANOVA with Dunnett's multiple comparisons test performed, **P < 0.005, ***P < 0.0001.
WT and Canx −/− MEFs were untreated or treated with BafA1 (10 μM) for 6 h, lysed and analysed by Western blot with indicated antibodies. Filamin and β‐actin were used as loading control. Dashed line indicates that unnecessary lanes were removed. Western blot is representative of three independent experiments.
MEF cell lines lacking the indicated genes were treated for 12 h with 50 nM BafA1 fixed and immunolabelled for PC1 (568, red) and LAMP1 (488, green). CST was added where indicated. Scale bar = 10 μm. Inset panels show magnification of the boxed area. Bar graph on the right shows quantification of LAMP1 vesicles positive for PC1, expressed as % of total lysosomes (mean ± SEM), n = 8, 8, 12, 8, 8, 8 cells, respectively; three independent experiments. One‐way ANOVA with Dunnett's multiple comparisons test performed and P‐value adjusted for multiple comparisons. ***P < 0.0001.
- A, B
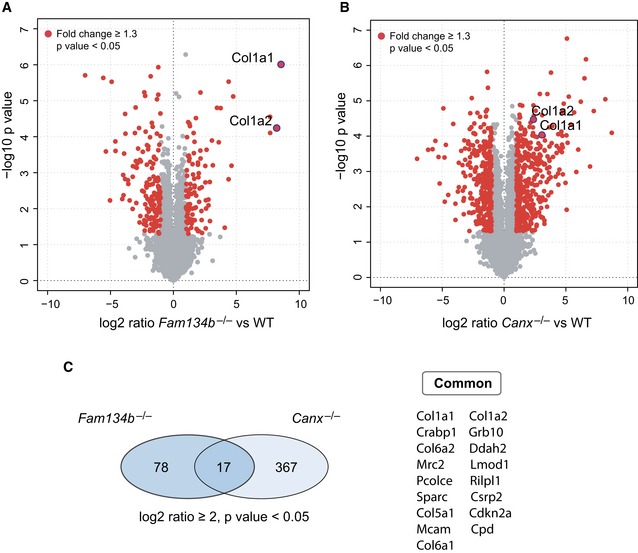
Volcano plot comparing protein fold changes between WT versus Fam134b −/− (A) and WT versus Canx −/− MEFs (B). Significantly regulated proteins are labelled in red (log2 fold change > 1, −log10 P > 1.3). Red dots with blue ring indicate collagen 1 peptides. Graphs represent statistics from three separate experiments for each genotype.
- C
Left: Venn diagrams represent the number of identified peptides significantly enriched in Fam134b −/− and Canx −/− MEFs. Right: List of peptides upregulated in both Fam134b −/− and Canx −/− MEFs.
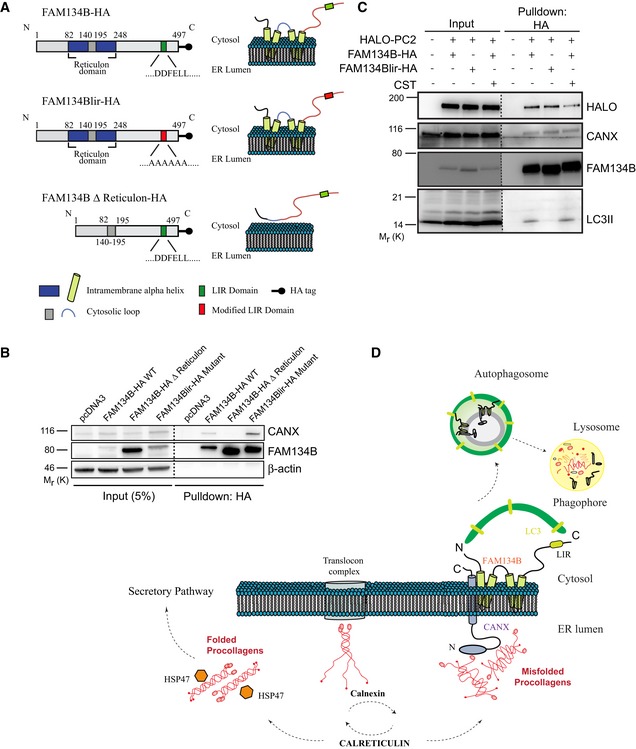
Schematic representation of FAM134B WT, lir mutant and delta reticulon constructs.
U2OS cells were transfected with empty vector control (pcDNA3), FAM134B‐HA WT or mutant constructs as indicated.
U2OS cells were transfected with HALO‐PC2, FAM134B‐HA or FAM134Blir‐HA constructs, treated with 100 nM BafA1 for 6 h and with CST where indicated. (B, C) Complexes were immune‐isolated with HA‐magnetic beads, separated by Western blot and visualized with antibodies against HALO, CANX, FAM134B, LC3 and β‐actin. 5% of the input is shown. Western blots are representative of three independent experiments. Dashed line indicates that unnecessary lanes were removed.
Proposed model of collagen recognition by autophagy. After synthesis, PC chains are subjected to quality control operated by the CANX/CRT chaperone system. Properly folded PC associates with HSP47 and is then secreted, whereas the misfolded fraction is sequestered by the CANX‐FAM143B complex and delivered to lysosomes through ER‐phagy.
- A
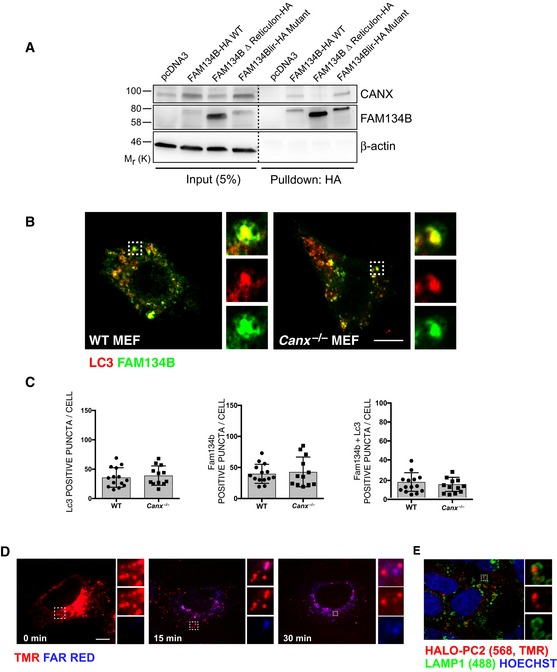
HeLa (Kyoto) cells were transfected with empty vector control, FAM134B‐HA WT or mutant constructs as indicated. Complexes were immunoisolated with HA‐magnetic beads, separated by Western blot and visualized with antibodies against CANX, FAM134B and β‐actin as control. 5% of the input is shown. Western blots are representative of three independent experiments.
- B, C
WT and Canx −/− MEFs were transiently transfected with RFP‐LC3 and WT GFP‐FAM134B. Representative immunofluorescence, the insets show higher magnification (x3.62) and single colour channels of the boxed area. Scale bar = 10 μm. Quantification of AVs positive for RFP‐LC3 (red) containing GFP‐FAM134B (green) expressed as % of total LC3, FAM134B and FAM134B+LC3 per cells (mean ± SEM). n = 12 cells counted per condition; three independent experiments.
- D, E
Addition of HaloTag does not perturb trafficking of PC2 molecules. (D) Pulse chase of U2OS cells transfected with Mifepristone inducible HALO‐PC2. Cells were pulsed for 20 min with HALO ligand (568, TMR, red) then chased in medium containing HALO ligand (Far red, blue) for 0, 15, 30 min. Images show that after 30 min, the majority of TMR‐bound HALO was secreted. The insets show higher magnification (left = x2.56, middle = x3.31, right = x6.79) and single colour channels of the boxed area. Scale bar = 10 μm. (E) Scanning confocal analysis of U2OS transfected with HALO‐PC2, treated for 9 h with 100 nM BafA1 in the presence of TMR (red) and immunolabelled for LAMP1 (488, green). Nuclei were stained with Hoechst (blue). The insets show higher magnification (x4.52) and single colour channels of the boxed area. Scale bar = 10 μm.
Similar articles
-
MiT/TFE factors control ER-phagy via transcriptional regulation of FAM134B.EMBO J. 2020 Sep 1;39(17):e105696. doi: 10.15252/embj.2020105696. Epub 2020 Jul 27. EMBO J. 2020. PMID: 32716134 Free PMC article.
-
Excessive ER-phagy mediated by the autophagy receptor FAM134B results in ER stress, the unfolded protein response, and cell death in HeLa cells.J Biol Chem. 2019 Dec 27;294(52):20009-20023. doi: 10.1074/jbc.RA119.008709. Epub 2019 Nov 20. J Biol Chem. 2019. PMID: 31748416 Free PMC article.
-
ER-to-lysosome-associated degradation of proteasome-resistant ATZ polymers occurs via receptor-mediated vesicular transport.EMBO J. 2018 Sep 3;37(17):e99259. doi: 10.15252/embj.201899259. Epub 2018 Aug 3. EMBO J. 2018. PMID: 30076131 Free PMC article.
-
Crosstalk of ER stress-mediated autophagy and ER-phagy: Involvement of UPR and the core autophagy machinery.J Cell Physiol. 2018 May;233(5):3867-3874. doi: 10.1002/jcp.26137. Epub 2017 Aug 30. J Cell Physiol. 2018. PMID: 28777470 Review.
-
Proteasomal and lysosomal clearance of faulty secretory proteins: ER-associated degradation (ERAD) and ER-to-lysosome-associated degradation (ERLAD) pathways.Crit Rev Biochem Mol Biol. 2019 Apr;54(2):153-163. doi: 10.1080/10409238.2019.1610351. Epub 2019 May 14. Crit Rev Biochem Mol Biol. 2019. PMID: 31084437 Review.
Cited by
-
Endoplasmic Reticulum Membrane and Contact Site Dynamics in Autophagy Regulation and Stress Response.Front Cell Dev Biol. 2020 May 29;8:343. doi: 10.3389/fcell.2020.00343. eCollection 2020. Front Cell Dev Biol. 2020. PMID: 32548114 Free PMC article. Review.
-
Collagen's enigmatic, highly conserved N-glycan has an essential proteostatic function.Proc Natl Acad Sci U S A. 2021 Mar 9;118(10):e2026608118. doi: 10.1073/pnas.2026608118. Proc Natl Acad Sci U S A. 2021. PMID: 33674390 Free PMC article.
-
Models of Intracellular Transport: Pros and Cons.Front Cell Dev Biol. 2019 Aug 7;7:146. doi: 10.3389/fcell.2019.00146. eCollection 2019. Front Cell Dev Biol. 2019. PMID: 31440506 Free PMC article.
-
Gametogenesis: Exploring an Endogenous Rejuvenation Program to Understand Cellular Aging and Quality Control.Annu Rev Genet. 2022 Nov 30;56:89-112. doi: 10.1146/annurev-genet-080320-025104. Epub 2022 Jul 25. Annu Rev Genet. 2022. PMID: 35878627 Free PMC article. Review.
-
A COPII subunit acts with an autophagy receptor to target endoplasmic reticulum for degradation.Science. 2019 Jul 5;365(6448):53-60. doi: 10.1126/science.aau9263. Science. 2019. PMID: 31273116 Free PMC article.
References
-
- Bartolomeo R, Cinque L, Leonibus CD, Forrester A, Salzano AC, Monfregola J, Gennaro ED, Nusco E, Azario I, Lanzara C, Serafini M, Levine B, Ballabio A, Settembre C (2017) mTORC1 hyperactivation arrests bone growth in lysosomal storage disorders by suppressing autophagy. J Clin Invest 127: 3717–3729 - PMC - PubMed
-
- Bateman JF, Boot‐Handford RP, Lamandé SR (2009) Genetic diseases of connective tissues: cellular and extracellular effects of ECM mutations. Nat Rev Genet 10: 173–183 - PubMed
-
- Bienkowski RS, Curran SF, Berg RA (1986) Kinetics of intracellular degradation of newly synthesized collagen. Biochemistry 25: 2455–2459 - PubMed
Publication types
MeSH terms
Substances
LinkOut - more resources
Full Text Sources
Research Materials
