. 2019 Mar;31(3):663-686.
doi: 10.1105/tpc.18.00437. Epub 2018 Dec 11.

The AREB1 Transcription Factor Influences Histone Acetylation to Regulate Drought Responses and Tolerance in Populus trichocarpa

Affiliations

The AREB1 Transcription Factor Influences Histone Acetylation to Regulate Drought Responses and Tolerance in Populus trichocarpa

Shuang Li et al. Plant Cell. 2019 Mar.

Abstract

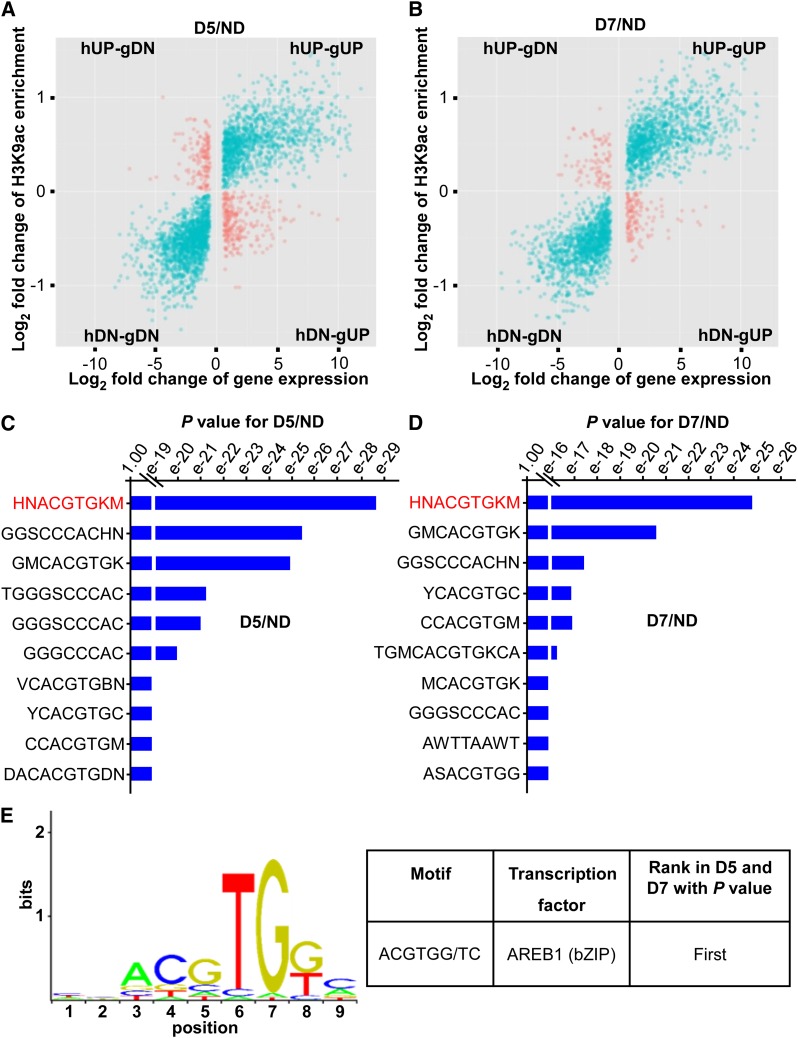
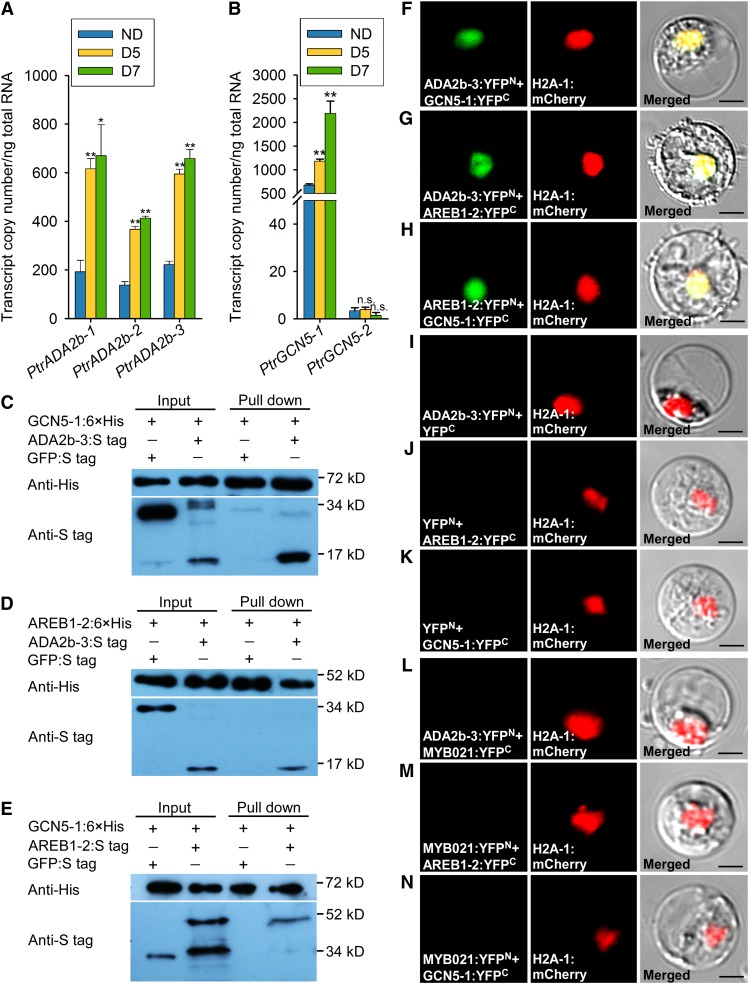
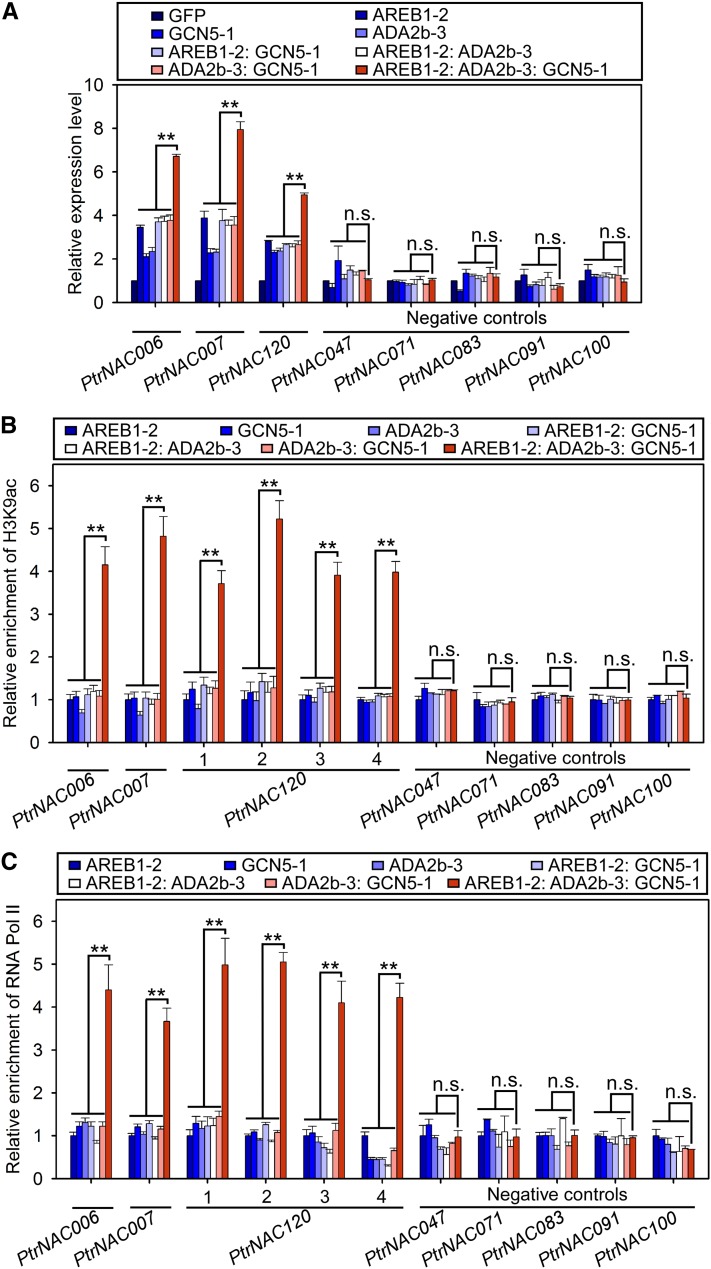
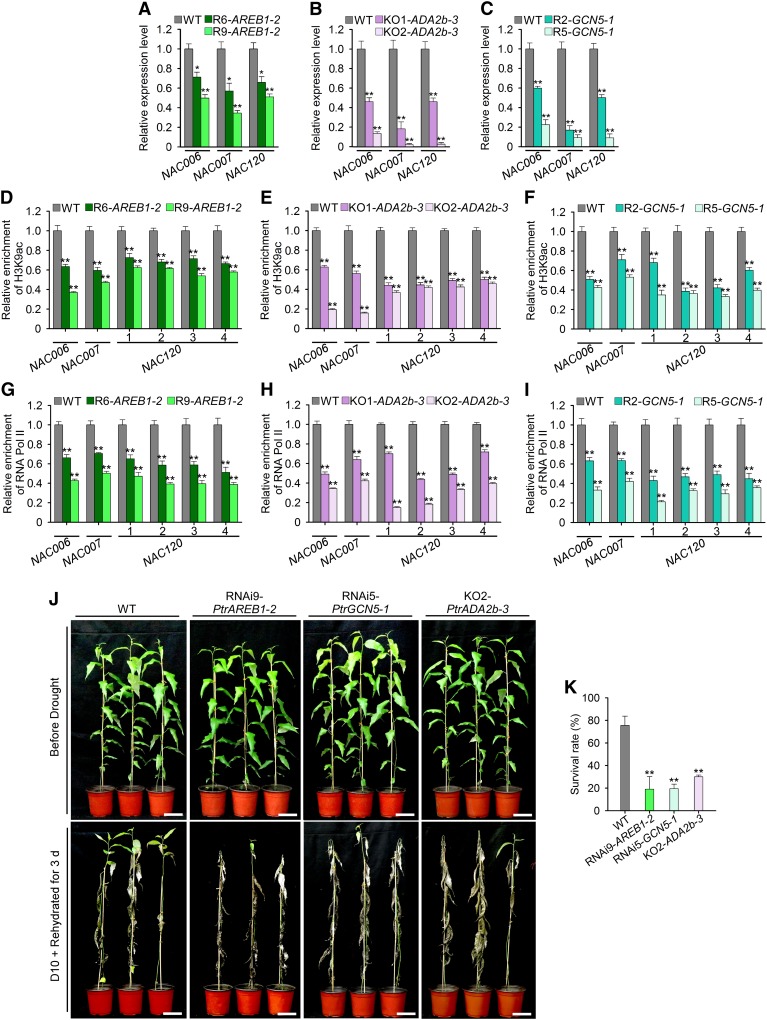
Plants develop tolerance to drought by activating genes with altered levels of epigenetic modifications. Specific transcription factors are involved in this activation, but the molecular connections within the regulatory system are unclear. Here, we analyzed genome-wide acetylated lysine residue 9 of histone H3 (H3K9ac) enrichment and examined its association with transcriptomes in Populus trichocarpa under drought stress. We revealed that abscisic acid-Responsive Element (ABRE) motifs in promoters of the drought-responsive genes PtrNAC006, PtrNAC007, and PtrNAC120 are involved in H3K9ac enhancement and activation of these genes. Overexpressing these PtrNAC genes in P trichocarpa resulted in strong drought-tolerance phenotypes. We showed that the ABRE binding protein PtrAREB1-2 binds to ABRE motifs associated with these PtrNAC genes and recruits the histone acetyltransferase unit ADA2b-GCN5, forming AREB1-ADA2b-GCN5 ternary protein complexes. Moreover, this recruitment enables GCN5-mediated histone acetylation to enhance H3K9ac and enrich RNA polymerase II specifically at these PtrNAC genes for the development of drought tolerance. CRISPR editing or RNA interference-mediated downregulation of any of the ternary members results in highly drought-sensitive P trichocarpa Thus, the combinatorial function of the ternary proteins establishes a coordinated histone acetylation and transcription factor-mediated gene activation for drought response and tolerance in Populus species.


Figures

Figure 1.
Figure 1.
Integration of ChIP-seq and RNA-seq Data to Identify Drought Stress-Responsive Genes with Differential H3K9ac of Promoters and Identification of Transcription Binding Motifs. (A) and (B) Plots for log2 fold change of gene expression and H3K9ac enrichment at promoters for D5/ND (A) and D7/ND (B). (C) and (D) Analysis of motif enrichment of the promoters with differential H3K9ac for D5/ND (C) and D7/ND (D). H represents A or C or T, N represents any base, K represents G or T, and M represents A or C. (E) The top-ranked motif in the promoters with differential H3K9ac for both D5/ND and D7/ND was the ABRE consensus motif for the AREB1 TF.
Figure 2.
Figure 2.
ABRE Motifs Mediate H3K9ac Association and the Regulation of PtrNAC Genes. (A) RT-qPCR detection of PtrNAC005, PtrNAC006, PtrNAC007, PtrNAC118, and PtrNAC120 in wild-type P. trichocarpa plants without (ND) or with drought treatment for 5 d (D5) and 7 d (D7). Error bars indicate 1 se of three biological replicates from independent pools of P. trichocarpa SDX tissues. Asterisks indicate significant differences between control (ND) and drought-treated (D5 and D7) samples for each gene (**, P < 0.01, Student’s t test). (B) Schematic diagram of ABRE motifs in five PtrNAC gene promoters. (C) ChIP-qPCR detection of H3K9ac in ABRE motif regions of PtrNAC promoters in wild-type P. trichocarpa plants without (ND) or with drought treatment for 5 d (D5) and 7 d (D7). Numbers indicate ABRE motif sites in each gene. ChIP assays were performed using antibodies against H3K9ac, and the precipitated DNA was quantified by qPCR. Enrichment values represent the relative fold change from ND, and error bars indicate 1 se of three biological replicates from independent pools of P. trichocarpa SDX tissues. Asterisks indicate significant differences between control (ND) and drought-treated (D5 and D7) samples for each fragment containing the ABRE motif (*, P < 0.05 and **, P < 0.01, Student’s t test).
Figure 3.
Figure 3.
Overexpressing PtrNAC Genes Improves the Drought Tolerance of P. trichocarpa. (A) Drought tolerance phenotypes of wild-type and OE-PtrNAC006, OE-PtrNAC007, and OE-PtrNAC120 transgenic plants. Three-month-old plants (Before Drought, top row) were dehydrated for 12 d (D12, middle row) and then rehydrated for 3 d (D12 + Rehydrated for 3 d, bottom row). Bars = 10 cm. (B) Statistical analysis of height and stem basal diameter of wild-type and OE-PtrNAC006 (OE-N6), OE-PtrNAC007 (OE-N7), and OE-PtrNAC120 (OE-N12) transgenic plants before drought, at D12, and at D12 + rehydrated for 3 d. Error bars represent 1 se of three independent experiments with 12 P. trichocarpa plants for each genotype in each replicate. Asterisks indicate significant differences between the transgenics harboring each gene construct and wild-type plants for each time point (*, P < 0.05 and **, P < 0.01, Student’s t test). (C) Statistical analysis of survival rates after drought treatment and recovery (D12 + Rehydrated for 3 d). The average percentage of survival and se values were calculated from three independent experiments with at least 12 plants of each genotype in each replicate. Asterisks indicate significant differences between the transgenics harboring each gene construct and wild-type plants (*, P < 0.05 and **, P < 0.01, Student’s t test). (D) Statistical analysis of stem water potential of wild-type and OE-PtrNAC transgenic plants with no drought treatment and drought treatment for 5 d. Error bars represent 1 se of three independent experiments with six P. trichocarpa plants of each genotype in each replicate, and asterisks indicate significant differences between the transgenics harboring each gene construct and wild-type plants for each condition (**, P < 0.01, Student’s t test).
Figure 4.
Figure 4.
Overexpressing PtrNAC Genes Affects the Size and Number of Vessels in Xylem Tissue of P. trichocarpa. (A) Stem cross sections of wild-type and OE-PtrNAC transgenic plants with the 10th internode. Bars = 200 µm. (B) to (D) Statistical analysis of mean lumen area of individual vessels (µm2) (B), number of vessels per cross-sectional area (mm2) (C), and area of vessels (µm2) per cross-sectional area (mm2) (D) using vessel cells from (A). Error bars represent 1 se of three independent replicates with at least 200 vessel cells for each genotype in each replicate, and asterisks indicate significant differences between the transgenics harboring each gene construct and wild-type plants (*, P < 0.05 and **, P < 0.01, Student’s t test). (E) Scanning electron micrographs of wild-type and OE-PtrNAC006 transgenic plants with the 10th internode imaged at ×500, ×1000, and ×2000 magnification. Bars = 20 µm.
Figure 5.
Figure 5.
PtrAREB1-2 Activates the Transcription of PtrNAC Genes and Binds Directly to the ABRE Motifs in Their Promoters. (A) Expression patterns of PtrAREB1-2, PtrAREB1-3, and PtrAREB1-4 genes in response to drought stress detected by RT-qPCR. Expression was highly induced by drought treatment. Error bars indicate 1 se of three biological replicates from independent pools of P. trichocarpa SDX tissues. Asterisks indicate significant differences between control (ND) and drought-treated (D5 and D7) samples for each gene (**, P < 0.01, Student’s t test). (B) RT-qPCR to detect the transcript abundance of PtrNAC006, PtrNAC007, and PtrNAC120 in SDX protoplasts overexpressing GFP (Control) or PtrAREB1-2 in the presence of external 50 µM ABA. Control values were set as 1. Error bars indicate 1 se of three biological replicates (three independent batches of SDX protoplast transfections). Asterisks indicate significant differences for each gene between control protoplasts and those overexpressing PtrAREB1-2 samples for each gene (**, P < 0.01, Student’s t test). (C) PtrAREB1-2 ChIP assays showing that PtrAREB1-2 binds directly to the promoters of PtrNAC genes. P. trichocarpa SDX protoplasts overexpressing PtrAREB1-2-GFP or GFP (control) were used for the ChIP assay with anti-GFP antibody, and the precipitated DNA was quantified by qPCR. Enrichment of DNA was calculated as the ratio between 35Spro:PtrAREB1-2-GFP and 35Spro:GFP (control), normalized to that of the PtrACTIN gene. Numbers indicate ABRE motif sites in PtrNAC120. Error bars represent 1 se of three biological replicates (three independent batches of SDX protoplast transfections). Asterisks indicate significant differences between the control fragment (PtrACTIN) and each fragment containing an ABRE motif (**, P < 0.01, Student’s t test). (D) to (F) Nucleotide sequences of the wild-type ABRE and a mutated ABRE motif (mABRE) (top panels). Core sequences are shaded in black, and the mutated nucleotide is shaded in gray. EMSA analysis of PtrAREB1-2 binding to ABRE motifs in PtrNAC006 (D), PtrNAC007 (E), and PtrNAC120 (F) promoters is shown in the bottom panels. The arrows show the shifted band representing the protein-DNA complex. PtrNAC006 (D), PtrNAC007 (E), and PtrNAC120 (F) promoter fragments were labeled with biotin. Fragments without biotin labeling were used as competitors. Wild-type or mutated ABRE competitors were used in a molar excess of 50×, 100×, or 150×.
Figure 6.
Figure 6.
PtrAREB1-2 Interacts with the HAT Complex PtrADA2b-3:PtrGCN5-1. (A) and (B) Abundance of alternatively spliced transcripts of PtrADA2b-1, PtrADA2b-2, and PtrADA2b-3 (A) as well as PtrGCN5-1 and PtrGCN5-2 (B) determined by RT-qPCR in the xylem of P. trichocarpa under well-watered and drought conditions. Error bars indicate 1 se of three biological replicates in (A) and six biological replicates in (B) from independent pools of P. trichocarpa SDX tissues. Asterisks indicate significant differences between control (ND) and drought-treated (D5 and D7) samples for each gene (*, P < 0.05 and **, P < 0.01, Student’s t test), and n.s. denotes no significant difference. (C) to (E) Interactions of PtrADA2b-3, PtrGCN5-1, and PtrAREB1-2 with each other determined by pull-down assays. His-tagged PtrGCN5-1 and PtrAREB1-2 as well as S-tagged PtrADA2b-3 and PtrAREB1-2 purified from E. coli were used for pull-down assays, and GFP was used as a negative control. (F) to (N) BiFC assays in P. trichocarpa SDX protoplasts showing that PtrADA2b-3, PtrGCN5-1, and PtrAREB1-2 proteins interact with each other in the nucleus ([F] to [H]). Cotransfection of each protein of interest with an empty plasmid served as a control ([I] to [K]). PtrMYB021, an unrelated TF expressed in the nucleus (Li et al., 2012), was used as another negative control ([L] to [N]). Neither negative control gave any YFP signal. Green shows the YFP signals from protein interaction, red indicates the nuclear marker H2A-1:mCherry, and yellow represents the merged signals from YFP and mCherry. Images from two other biological replicates are shown in Supplemental Figure 13. Bars = 10 µm.
Figure 7.
Figure 7.
PtrADA2b-3 and PtrGCN5-1 Together Enhance PtrAREB1-2-Mediated Transcriptional Activation of PtrNAC Genes by Increasing H3K9ac Level and RNA Pol II Recruitment at Their Promoters. (A) RT-qPCR detection of PtrNAC006, PtrNAC007, and PtrNAC120 transcripts in P. trichocarpa SDX protoplasts overexpressing GFP (control), PtrAREB1-2, PtrGCN5-1, PtrADA2b-3, PtrAREB1-2:PtrGCN5-1, PtrAREB1-2:PtrADA2b-3, PtrADA2b-3:PtrGCN5-1, or PtrAREB1-2:PtrADA2b-3:PtrGCN5-1 in the presence of external 50 µM ABA. Five genes without ABRE motifs were used as negative controls, none of which had activated expression. The control values were set as 1. Error bars represent 1 se of three biological replicates (three independent batches of SDX protoplast transfections). Asterisks indicate significant differences between the ternary complex and each monomeric or dimeric protein for each gene (**, P < 0.01, Student’s t test), and n.s. denotes no significant difference. (B) and (C) ChIP-qPCR showing that co-overexpression of PtrAREB1-2, PtrADA2b-3, and PtrGCN5-1 increased H3K9ac (B) and RNA Pol II (C) enrichment at the promoters of PtrNAC006, PtrNAC007, and PtrNAC120. SDX protoplasts overexpressing PtrAREB1-2, PtrGCN5-1, PtrADA2b-3, PtrAREB1-2:PtrGCN5-1, PtrAREB1-2:PtrADA2b-3, PtrADA2b-3:PtrGCN5-1, PtrAREB1-2:PtrADA2b-3:PtrGCN5-1, or GFP (control) were used for ChIP assays with anti-H3K9ac (B) and anti-RNA Pol II (C) antibodies, and the precipitated DNA was quantified by qPCR. None of the five negative control genes had enhanced H3K9ac (B) or RNA Pol II (C) levels at their promoters. Enrichment values represent the relative fold change compared with the protoplasts overexpressing PtrAREB1-2. Error bars indicate 1 se of three biological replicates (three independent batches of SDX protoplast transfections). Asterisks indicate significant differences between the ternary complex and each monomeric or dimeric protein for each fragment containing the ABRE motif (**, P < 0.01, Student’s t test), and n.s. denotes no significant difference.
Figure 8.
Figure 8.
Reduced or Deleted Expression of PtrAREB1-2, PtrADA2b-3, or PtrGCN5-1 in P. trichocarpa Decreases H3K9ac and RNA Pol II Enrichment on PtrNAC Genes, Expression of These NAC Genes, and Plant Drought Tolerance. (A) to (C) RT-qPCR detection of PtrNAC006, PtrNAC007, and PtrNAC120 transcripts in wild-type, RNAi-PtrAREB1-2 (R6 and R9 = lines 6 and 9) (A), KO-PtrADA2b-3 (KO1 and KO2 = knockout mutants 1 and 2) (B), and RNAi-PtrGCN5-1 (R2 and R5 = lines 2 and 5) (C) transgenic plants following drought treatment for 5 d. Error bars indicate 1 se of three biological replicates from independent pools of P. trichocarpa SDX tissues, and asterisks indicate significant differences between each transgenic line and wild-type plants for each PtrNAC gene (*, P < 0.05 and **, P < 0.01, Student’s t test). (D) to (F) ChIP-qPCR detection of H3K9ac at promoters of PtrNAC genes in wild-type, RNAi-PtrAREB1-2 (D), KO-PtrADA2b-3 (E), and RNAi-PtrGCN5-1 (F) transgenic plants following drought treatment for 5 d. (G) to (I) ChIP-qPCR detection of RNA Pol II enrichment at promoters of PtrNAC genes in wild-type, RNAi-PtrAREB1-2 (G), KO-PtrADA2b-3 (H), and RNAi-PtrGCN5-1 (I) transgenic plants following drought treatment for 5 d. ChIP assays were performed using antibodies against H3K9ac ([D] to [F]) and RNA Pol II ([G] to [I]), and the precipitated DNA was quantified by qPCR. Enrichment values represent the relative fold change compared with wild-type plants. Numbers in (D) to (I) indicate ABRE motif sites in PtrNAC120. Each experiment had three biological replicates showing similar results. Error bars indicate 1 se of three technical replicates, and asterisks indicate significant differences from wild-type plants (**, P < 0.01, Student’s t test). (J) Drought-sensitive phenotypes of RNAi9-PtrAREB1-2, RNAi5-PtrGCN5-1, and KO2-PtrADA2b-3 transgenic plants. Three-month-old plants (Before Drought, top row) were dehydrated for 10 d and then rehydrated for 3 d (D10 + Rehydrated for 3 d, bottom row). Bars = 10 cm. (K) Statistical analysis of survival rates after drought treatment and recovery (D10 + rehydrated for 3 d). Error bars represent 1 se of three independent experiments with at least 12 plants of each genotype in each replicate, and asterisks indicate significant differences between the transgenics of each gene construct and wild-type plants (**, P < 0.01, Student’s t test).
Figure 9.
Figure 9.
Proposed Model of AREB1-Mediated Histone Acetylation in the Regulation of Drought Stress-Responsive PtrNAC Genes. Under drought stress conditions, the expression of the AREB1 TF is induced. AREB1 interacts with the ADA2b-GCN5 HAT complex and recruits the proteins to PtrNAC006, PtrNAC007, and PtrNAC120 genes through binding to ABRE motifs, resulting in enhanced H3K9ac and RNA Pol II enrichment for activating the expression of the PtrNAC006, PtrNAC007, and PtrNAC120 genes.
None

Comment in

Similar articles

Cited by

References

    1. Arango-Velez A., Zwiazek J.J., Thomas B.R., Tyree M.T. (2011). Stomatal factors and vulnerability of stem xylem to cavitation in poplars. Physiol. Plant. 143: 154–165. - PubMed
    1. Ascenzi R., Gantt J.S. (1999). Molecular genetic analysis of the drought-inducible linker histone variant in Arabidopsis thaliana. Plant Mol. Biol. 41: 159–169. - PubMed
    1. Aubert Y., Vile D., Pervent M., Aldon D., Ranty B., Simonneau T., Vavasseur A., Galaud J.P. (2010). RD20, a stress-inducible caleosin, participates in stomatal control, transpiration and drought tolerance in Arabidopsis thaliana. Plant Cell Physiol. 51: 1975–1987. - PubMed
    1. Balasubramanian R., Pray-Grant M.G., Selleck W., Grant P.A., Tan S. (2002). Role of the Ada2 and Ada3 transcriptional coactivators in histone acetylation. J. Biol. Chem. 277: 7989–7995. - PubMed
    1. Barber V.A., Juday G.P., Finney B.P. (2000). Reduced growth of Alaskan white spruce in the twentieth century from temperature-induced drought stress. Nature 405: 668–673. - PubMed

Publication types

MeSH terms