. 2018 Dec 7;9(1):5239.
doi: 10.1038/s41467-018-07543-w.

Dynamin-related protein 1 has membrane constricting and severing abilities sufficient for mitochondrial and peroxisomal fission

Affiliations

Dynamin-related protein 1 has membrane constricting and severing abilities sufficient for mitochondrial and peroxisomal fission

Sukrut C Kamerkar et al. Nat Commun. .

Abstract

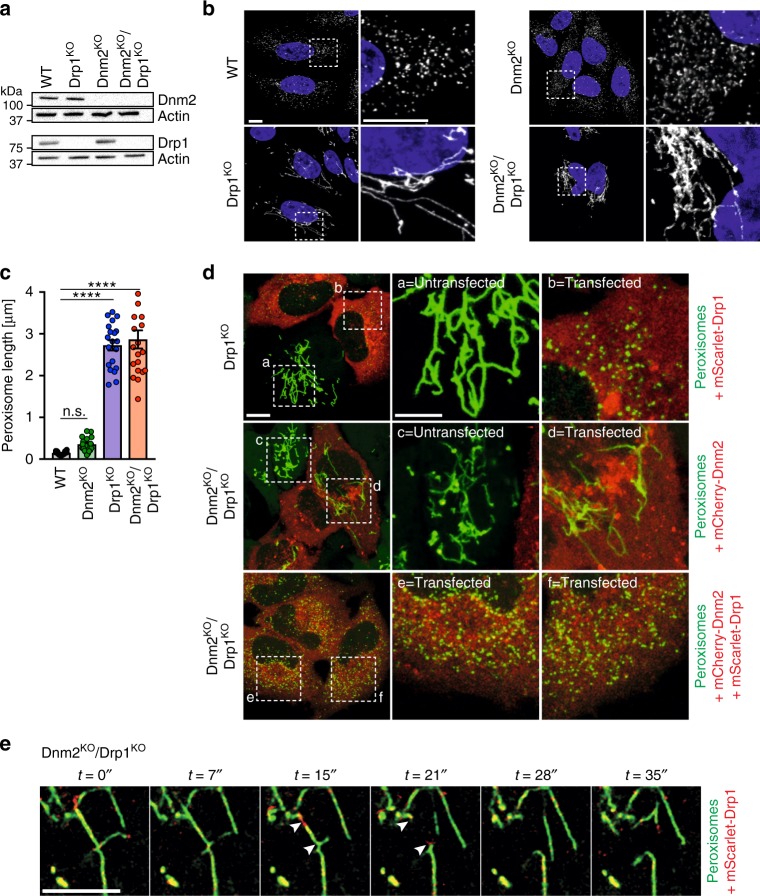
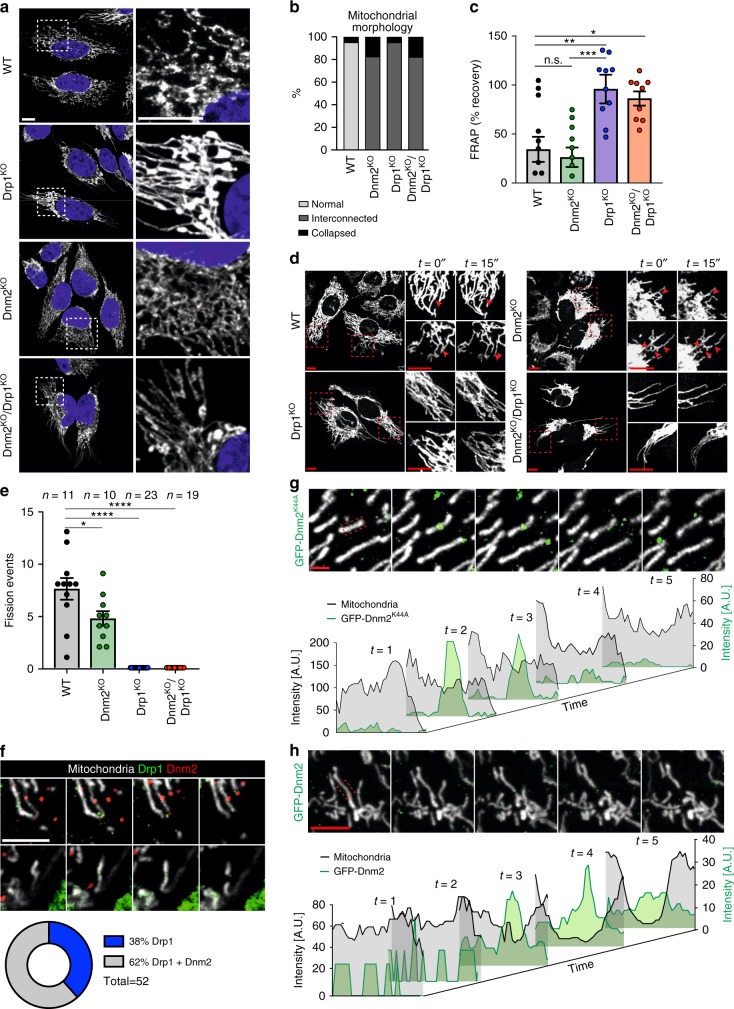
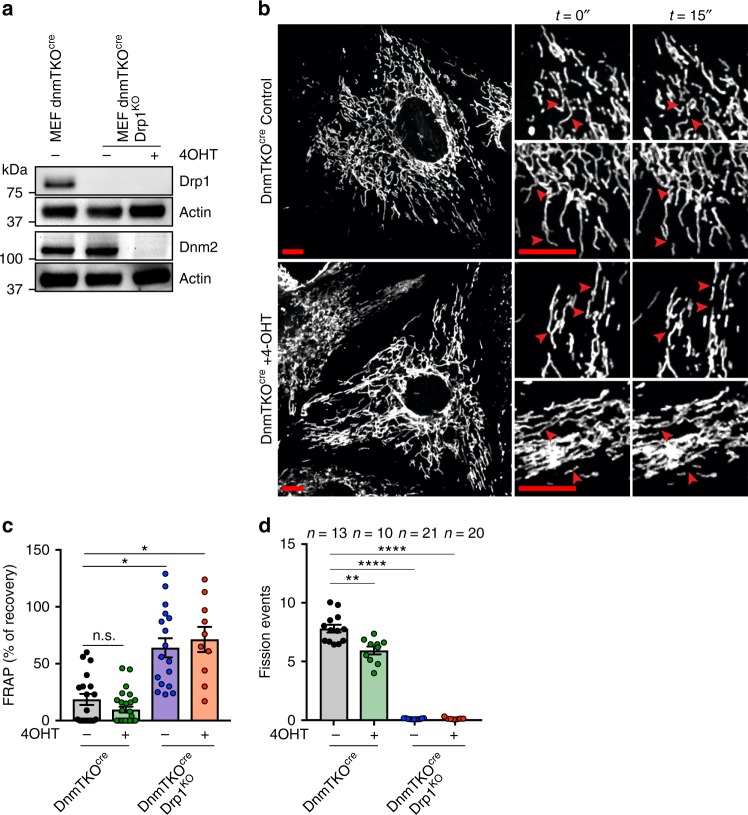
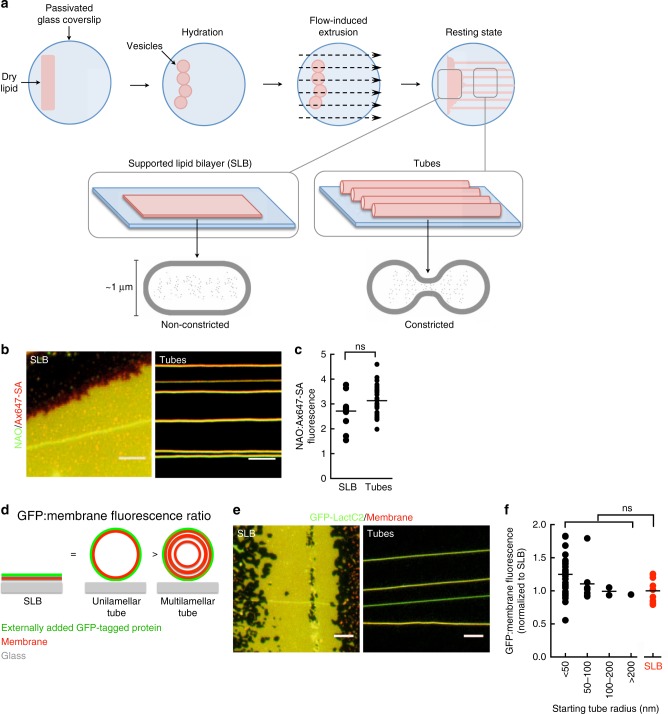
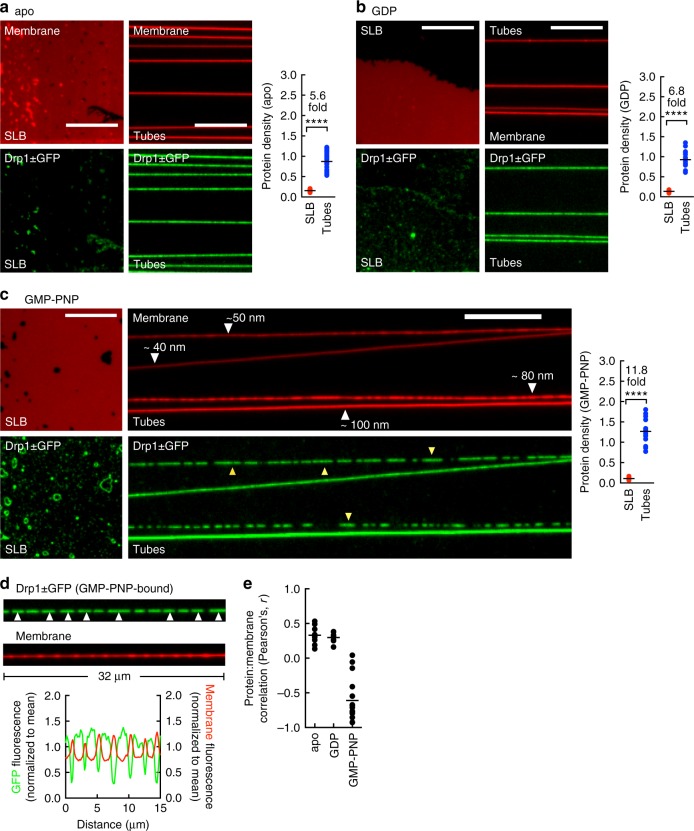
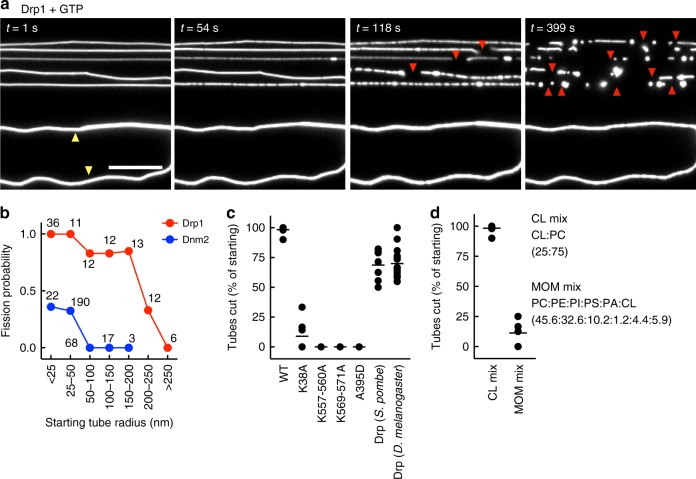
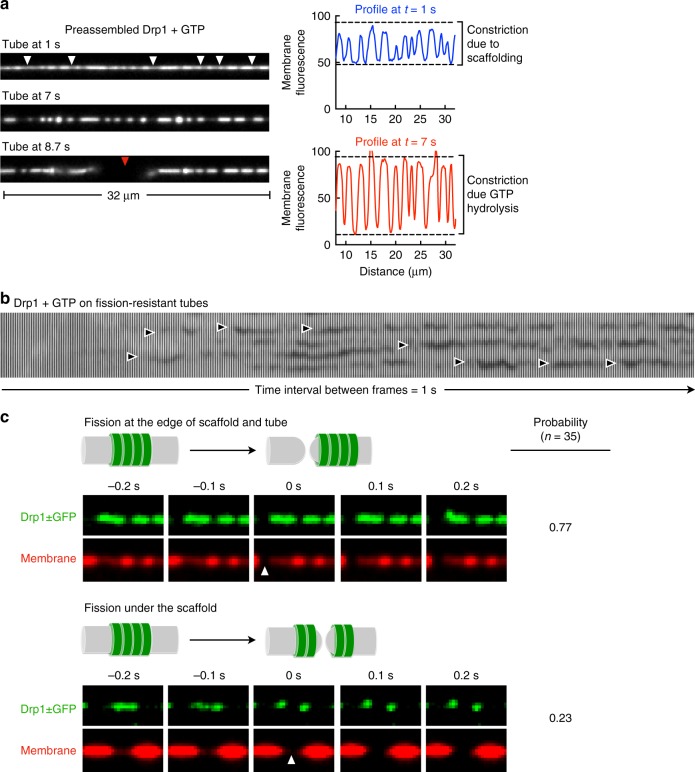
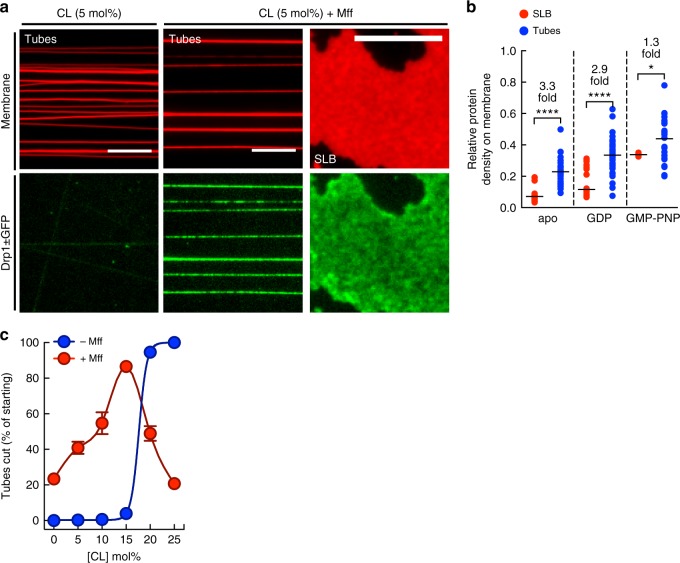
Dynamin-related protein 1 (Drp1) is essential for mitochondrial and peroxisomal fission. Recent studies propose that Drp1 does not sever but rather constricts mitochondrial membranes allowing dynamin 2 (Dnm2) to execute final scission. Here, we report that unlike Drp1, Dnm2 is dispensable for peroxisomal and mitochondrial fission, as these events occurred in Dnm2 knockout cells. Fission events were also observed in mouse embryonic fibroblasts lacking Dnm1, 2 and 3. Using reconstitution experiments on preformed membrane tubes, we show that Drp1 alone both constricts and severs membrane tubes. Scission required the membrane binding, self-assembling and GTPase activities of Drp1 and occurred on tubes up to 250 nm in radius. In contrast, Dnm2 exhibited severely restricted fission capacity with occasional severing of tubes below 50 nm in radius. We conclude that Drp1 has both membrane constricting and severing abilities and is the dominant dynamin performing mitochondrial and peroxisomal fission.


Conflict of interest statement

The authors declare no competing interests.

Figures

Fig. 1
Fig. 1
Loss of Dnm2 does not affect division of peroxisomes. a Western blot analysis of HeLa WT, Dnm2KO, Drp1KO, and Dnm2KO/Drp1KO whole cell lysates. Actin was used as a loading control. b Confocal images of HeLa WT, Drp1KO, Dnm2KO, and Dnm2KO/Drp1KO cells subjected to immunofluorescence and stained for peroxisomes (Pex14, white). Blue marks the nucleus. An enlargement of the hatched box is shown on the right of each panel. Scale bar = 10 µm. c Computational quantification of average peroxisome length in cell lines. n(WT) = 20 cells, n(Dnm2KO) = 20 cells, n(Drp1KO) = 20 cells, n(Dnm2KO/Drp1KO) = 18 cells. Data obtained from three independent experiments. Data represents the mean ± S.E.M.; n.s., not significant; ****p < 0.0001. One-way ANOVA with multiple comparisons. d Confocal live-cell image stills of HeLa Drp1KO and Dnm2KO/Drp1KO stably expressing Dendra2-SKL (green) and transfected with mCherry-Dnm2 (red) and/or doxycycline-inducible mScarlet-Drp1 (red) constructs. Enlargements of the hatched boxes depicting peroxisomal morphology in untransfected and transfected cells are shown on the right. Scale Bar = 10 µm and 5 µm (magnifications). e Confocal live-cell image stills of peroxisome fission events in HeLa Dnm2KO/Drp1KO cells stably expressing Dendra2-SKL and doxycycline-inducible mScarlet-Drp1. Scale bar = 5 µm
Fig. 2
Fig. 2
Drp1 is dominant in mitochondrial fission. a Confocal images of HeLa WT, Drp1KO, Dnm2KO, and Dnm2KO/Drp1KO cells subjected to immunofluorescence and stained for cytochrome c (white). Blue marks the nucleus. An enlargement of the hatched box is shown on the right of each panel. Scale bar = 10 µm. b Qualitative scoring of mitochondrial morphology. n(WT) = 41 cells; n(Dnm2KO) = 69 cells; n(Drp1KO) = 142 cells; n(Dnm2KO/Drp1KO) = 73 cells. c FRAP analysis of mtDendra2 in WT, Drp1KO, Dnm2KO, and Dnm2KO/Drp1KO HeLa cells. n(WT) = 12 cells; n(Dnm2KO) = 11 cells; n(Drp1KO) = 12 cells; n(Dnm2KO/Drp1KO) = 10 cells. Data obtained from three independent experiments. Data represents the mean ± S.E.M.; n.s., not significant; *p < 0.05, **p < 0.005, ***p < 0.001. One-way ANOVA with multiple comparisons. d Representative confocal image frames depicting fission events for each cell line from (e). An enlargement of the hatched box is shown on the right of each panel. Scale bar = 10 µm. n(WT) = 11 cells; n(Dnm2KO) = 10 cells; n(Drp1KO) = 23 cells; n(Dnm2KO/Drp1KO) = 19 cells. e Number of individual mitochondrial fission events in HeLa WT, Drp1KO, Dnm2KO, and Dnm2KO/Drp1KO cells counted over a 7.5 min period. n(WT) = 11 cells; n(Dnm2KO) = 10 cells; n(Drp1KO) = 24 cells; n(Dnm2KO/Drp1KO) = 20 cells. Data obtained from three independent experiments. Data represents the mean ± S.E.M.; *p < 0.01, ****p < 0.0001. One-way ANOVA with multiple comparisons. f Mitochondrial fission events in HeLa Dnm2KO cells expressing mCherry-Dnm2 and GFP-Drp1. Mitochondrial fission events showing both Drp1 and Dnm2 (top panel) and Drp1 alone (bottom panel) at the fission site. Scale bar = 5 µm. Analysis of mitochondrial fission events (n = 14 cells; 52 fission events). g Live-cell confocal stills of HeLa cells expressing GFP-Dnm2K44A and stained with MitoTracker Red. Intensities of a mitochondrial tubule and GFP-Dnm2K44A foci (red hash box) over times are plotted below. Scale bar = 5 µm. h As for panel g but for GFP-Dnm2 where a fission event is observed
Fig. 3
Fig. 3
Loss of Drp1 is dominant to loss of dynamins 1,2,3. a Western blot analysis of MEF DnmTKOcre, DnmTKOcre+Drp1KO control and 4-OHT induced cells on whole cell lysates. Actin was used as a loading control. b Representative confocal image frames depicting mitochondrial morphology and fission events of MEF DnmTKOcre control and knockout (4-OHT induced) cells. Two enlargements on the right of each panel show fission events over the course of 15 s (red arrowheads). Scale bar = 10 µm. c FRAP analysis of mtDendra2 in MEF DnmTKOcre, DnmTKOcre+Drp1KO control and 4-OHT induced cells. n(DnmTKOcre) = 23 cells; n(DnmTKOcre + 4OHT) = 31 cells; n(DnmTKOcre + Drp1KO) = 26 cells; n(DnmTKOcre+Drp1KO+4OHT) = 23 cells. Data obtained from three independent experiments. Data represents the mean ± S.E.M.; n.s., not significant; *p < 0.05. One-way ANOVA with multiple comparisons. d Number of mitochondrial fission events in MEF DnmTKOcre, DnmTKOcre+Drp1KO control and 4-OHT induced cells counted over a 7.5 min period. n(DnmTKOcre) = 13 cells; n(DnmTKOcre+4OHT) = 10 cells; n(DnmTKOcre + Drp1KO) = 21 cells; n(DnmTKOcre + Drp1KO + 4OHT) = 20 cells. Data obtained from three independent experiments. Data represents the mean ± S.E.M.; **p < 0.01, ****p < 0.0001. One-way ANOVA with multiple comparisons
Fig. 4
Fig. 4
Template characteristics. a Schematic of the membrane template. b Representative images of NAO and Alexa647-labeled streptavidin (SA) fluorescence on the SLB and tubes composed of CL:DOPC (25:75 mol%). Scale bar = 10 µm. c Ratios of NAO and Alexa647-labeled streptavidin (SA) fluorescence on the SLB and tubes composed of CL:DOPC (25:75 mol%); ns, not significant, Mann–Whitney test. n(SLB) = 19 and n(tube) = 25 samplings from a single template preparation. d Schematic showing the expected fluorescence ratios of an externally added GFP-tagged protein that binds the membrane on the SLB, unilamellar and multilamellar tubes. e Representative images showing GFP-LactC2 distribution on the SLB and tubes. Scale bar = 10 µm. f Ratios of GFP-LactC2 and membrane fluorescence on tubes of varying sizes compared to that seen on the SLB; ns, not significant, Mann–Whitney test. n(<50 nm) = 33, n(50–100 nm) = 8, n(100–200 nm) = 2, n(>200 nm) = 1, and n(SLB) = 10 samplings from a single template preparation
Fig. 5
Fig. 5
Self-assembly of Drp1. a Representative images of Drp1 ± GFP on the SLB and tubes in the apo (a), GDP-bound (b), and GMP-PNP-bound (c) states. Scale bar = 10 µm. Also shown are ratios of Drp1 ± GFP to membrane fluorescence on the SLB and tubes; ****p < 0.0001, Mann–Whitney test. n(SLB) = 28 and n(tube) = 25 from a single experiment for apo. n(SLB) = 21 and n(tube) = 16 from a single experiment for GDP. n(SLB) = 21 and n(tube) = 15 from a single experiment for GMP-PNP. Yellow arrowheads mark clusters of Drp1 ± GFP on tubes in the GMP-PNP-bound state. d Representative images and associated line profiles showing distribution of Drp1 ± GFP with GMP-PNP. White arrowheads mark clusters of Drp1 ± GFP. e Pearson’s coefficient of correlation between Drp1 ± GFP and membrane fluorescence. n(apo) = 10, n(GDP) = 10, and n(GMP-PNP) = 16 tubes from a single experiment
Fig. 6
Fig. 6
Drp1- and Dnm2-catalyzed membrane fission. a Frames from a time-lapse movie showing Drp1-catalyzed fission. Red arrowheads mark site of fission, yellow arrowheads mark tubes that remain uncut. Scale bar = 10 µm. b Fission probability with Drp1 and Dnm2 as a function of starting tube radius. n(tubes) for each size range is indicated in the plot. c Analysis of Drp1-catalyzed fission with the indicated mutants and orthologs. n(WT) = 10, n(K38A) = 11, n(K557–560A) = 5, n(K569–571A) = 3, n(A395D) = 6, n(Drp S. pombe) = 7, and n(Drp D. melanogaster) = 16 microscope fields of a single experiment where each field displayed 30–35 tubes. d Analysis of Drp1-catalyzed fission on templates of the indicated lipid composition. n(CL mix) = 8 and n(MOM mix) = 7 microscope fields from a single experiment where each field displayed 30–35 tubes
Fig. 7
Fig. 7
Mechanism of Drp1-catalyzed fission. a Frames from a representative time-lapse movie showing the effect of GTP addition to preassembled Drp1 scaffolds. Also shown are line profiles of tube fluorescence at the indicated time points. White arrowheads mark constrictions formed by Drp1 scaffolds, red arrowhead marks the site of fission. b Montage of tube images from a representative experiment shown decline and recovery of tube fluorescence at sites marked by black arrowheads. c Frames from a time-lapse movie showing the distribution of Drp1 ± GFP (green) on the tube (red) under conditions where the scaffold remains intact (top) and when it undergoes splitting (bottom) after fission. White arrowhead marks the site of tube fission. Also shown is the probability of these two types of fission events
Fig. 8
Fig. 8
Drp1-catalyzed fission on compositional mimics of the mitochondria and peroxisomes. a Representative images of Drp1 ± GFP on tubes and SLB with 5 mol% CL with and without Mff. Scale bar = 10 µm. b Ratios of Drp1 ± GFP and membrane fluorescence on the SLB and tubes; ****p < 0.0001, *p = 0.013, Mann–Whitney’s test. n(SLB) = 40 and n(tube) = 32 from a single experiment for apo. n(SLB) = 43 and n(tube) = 46 from a single experiment for GDP. n(SLB) = 27 and n(tube) = 23 from a single experiment for GMP-PNP. c Plot showing the percentage of tubes cut as a function of CL concentration on tubes with and without Mff. Data represents the mean ± S.E.M. of n(tubes) >50 for each condition

Similar articles

Cited by

References

    1. Youle RJ, van der Bliek AM. Mitochondrial fission, fusion, and stress. Science. 2012;337:1062–1065. doi: 10.1126/science.1219855. - DOI - PMC - PubMed
    1. Lee H, Yoon AY. Mitochondrial fission: regulation and ER connection. Mol. Cells. 2014;37:89–94. doi: 10.14348/molcells.2014.2329. - DOI - PMC - PubMed
    1. Prashant Mishra DCC. Metabolic regulation of mitochondrial dynamics. J. Cell Biol. 2016;212:379–387. doi: 10.1083/jcb.201511036. - DOI - PMC - PubMed
    1. Sugiura A, Mattie S, Prudent J, McBride HM. Newly born peroxisomes are a hybrid of mitochondrial and ER-derived pre-peroxisomes. Nature. 2017;542:251–254. doi: 10.1038/nature21375. - DOI - PubMed
    1. Smith JJ, Aitchison JD. Peroxisomes take shape. Nat. Rev. Mol. Cell Biol. 2013;14:803–817. doi: 10.1038/nrm3700. - DOI - PMC - PubMed

Publication types