. 2019 Jan;30(1):33-49.
doi: 10.1681/ASN.2018020209. Epub 2018 Dec 10.

The MEK Inhibitor Trametinib Ameliorates Kidney Fibrosis by Suppressing ERK1/2 and mTORC1 Signaling

Affiliations

The MEK Inhibitor Trametinib Ameliorates Kidney Fibrosis by Suppressing ERK1/2 and mTORC1 Signaling

Petros Andrikopoulos et al. J Am Soc Nephrol. 2019 Jan.

Abstract

Background: During kidney fibrosis, a hallmark and promoter of CKD (regardless of the underlying renal disorder leading to CKD), the extracellular-regulated kinase 1/2 (ERK1/2) pathway, is activated and has been implicated in the detrimental differentiation and expansion of kidney fibroblasts. An ERK1/2 pathway inhibitor, trametinib, is currently used in the treatment of melanoma, but its efficacy in the setting of CKD and renal fibrosis has not been explored.

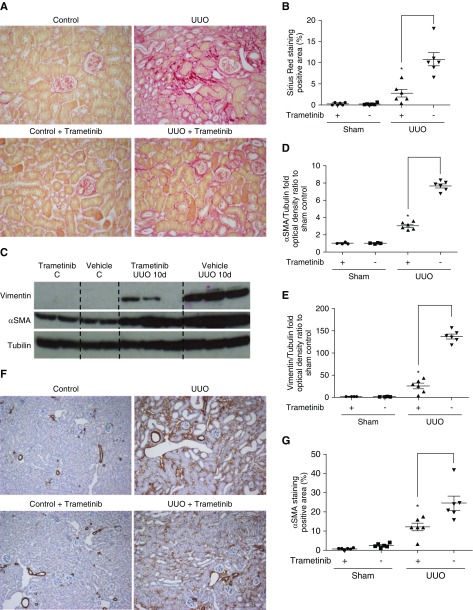
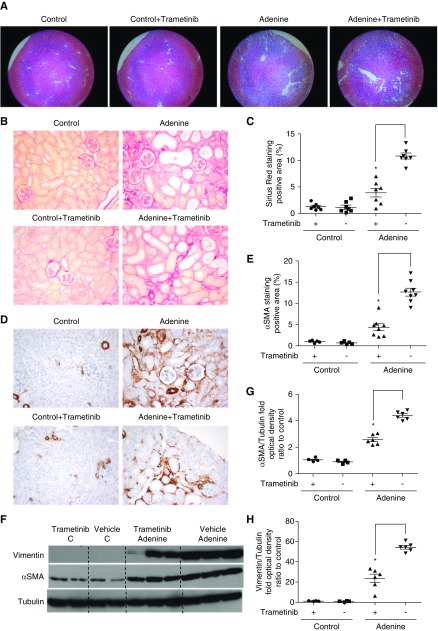
Methods: We investigated whether trametinib has antifibrotic effects in two mouse models of renal fibrosis-mice subjected to unilateral ureteral obstruction (UUO) or fed an adenine-rich diet-as well as in cultured primary human fibroblasts. We also used immunoblot analysis, immunohistochemical staining, and other tools to study underlying molecular mechanisms for antifibrotic effects.

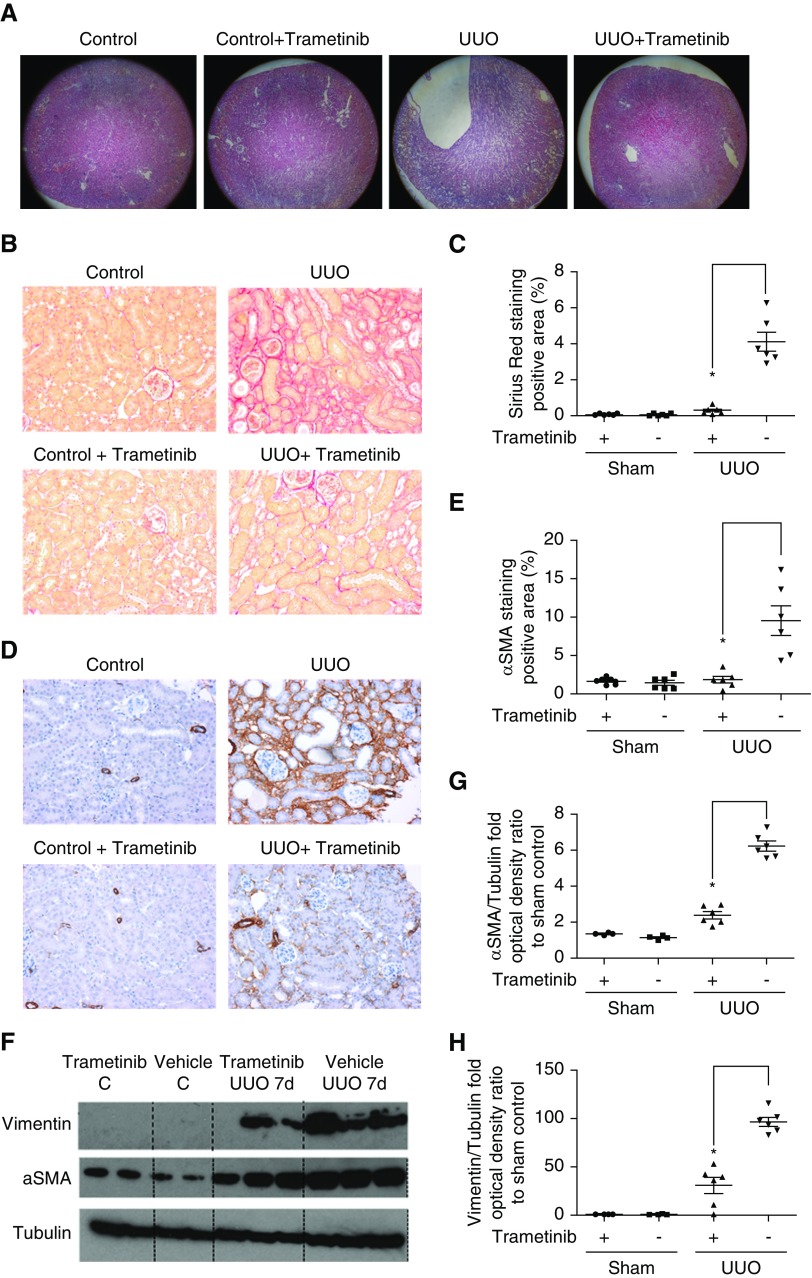
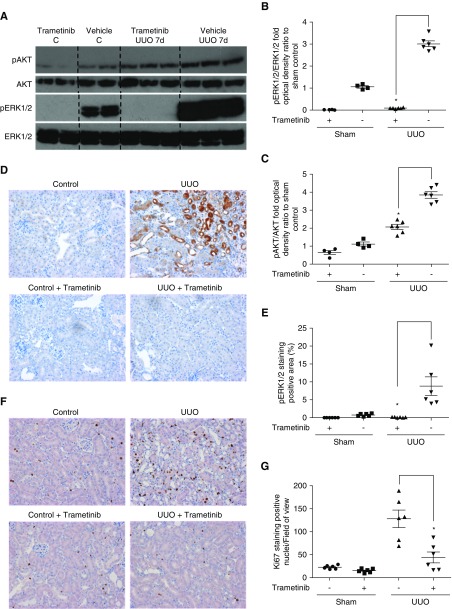
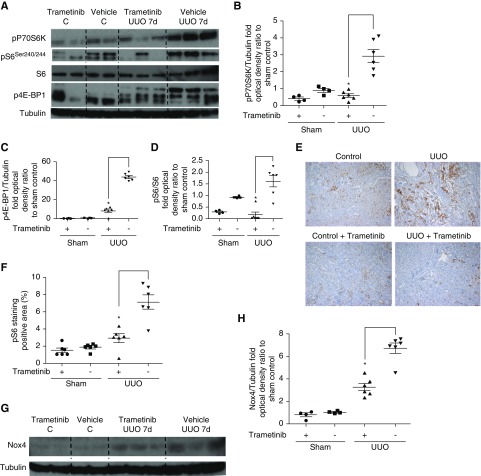
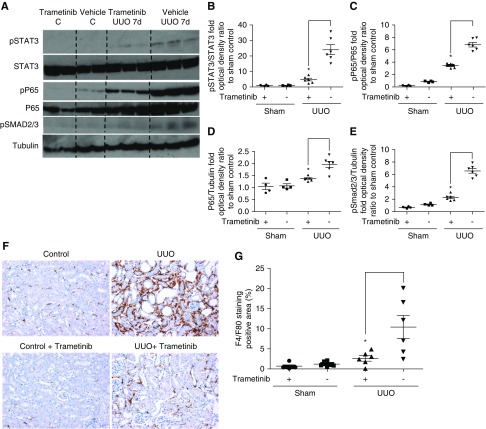
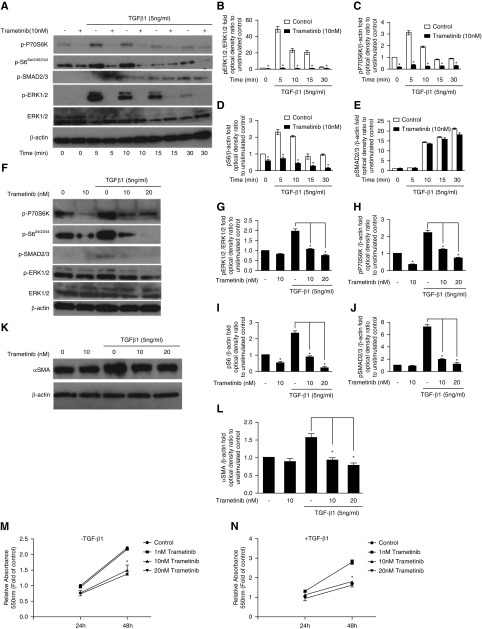
Results: Trametinib significantly attenuated collagen deposition and myofibroblast differentiation and expansion in UUO and adenine-fed mice. We also discovered that in injured kidneys, inhibition of the ERK1/2 pathway by trametinib ameliorated mammalian target of rapamycin complex 1 (mTORC1) activation, another key profibrotic signaling pathway. Trametinib also inhibited the ERK1/2 pathway in cultured primary human renal fibroblasts stimulated by application of TGF-β1, the major profibrotic cytokine, thereby suppressing downstream mTORC1 pathway activation. Additionally, trametinib reduced the expression of myofibroblast marker α-smooth muscle actin and the proliferation of renal fibroblasts, corroborating our in vivo data. Crucially, trametinib also significantly ameliorated renal fibrosis progression when administered to animals subsequent to myofibroblast activation.

Conclusions: Further study of trametinib as a potential candidate for the treatment of chronic renal fibrotic diseases of diverse etiologies is warranted.

Keywords: ERK1/2; Trametinib; UUO; chronic kidney disease; mTORC1; renal fibrosis.


Figures

Figure 1.
Figure 1.
Blockade of the ERK1/2 pathway ameliorated collagen deposition and αSMA expression in UUO kidneys. (A) Staining with hematoxylin and eosin of kidney sections from obstructed (UUO; 7 days after surgery) or contralateral sham-operated kidneys (control) at ×5 magnification. Animals received trametinib (3 mg/kg for 6 days) or vehicle as indicated. n=6 per group. (B) Sirius red staining of kidney sections from the animals in (A) at ×20 magnification, and (C) quantification of stained area as percentage of total area. (D) Immunostaining of kidney sections for αSMA at ×20 magnification and (E) quantification of positive αSMA staining. (F) Western blot of whole-kidney lysates for αSMA and vimentin expression. Membranes were subsequently stripped and reprobed for tubulin, as loading control. A representative photomicrograph from n=2 Western blots with n=4–6 animals in each group is shown. OD of the (G) αSMA and (H) vimentin bands in (F) were normalized against tubulin. The normalized density of the sham-vehicle treated samples was arbitrarily set to 1. For all graphs, error bars represent the means±SEM of data from n=4–6 animals per group. *P<0.05 versus the UUO control.
Figure 2.
Figure 2.
Trametinib suppressed UUO-induced ERK1/2 activation and myofibroblast proliferation. (A) Representative Western blot (n=2) from kidney lysates of animals subjected to UUO and treated with trametinib as indicated. Membranes were probed for phospho-AKT and phospho-ERK1/2. Protein loading was determined by probing for total ERK1/2 and total AKT. Densitometric analyses of blots from (A) for normalized (B) phospho-ERK1/2 and (C) phospho-AKT, as described in Figure 1. (D) Immunostaining of kidney sections for phospho-ERK1/2 at ×20 magnification and (E) quantification of positive pERK1/2 staining. (F) Immunostaining for positive Ki67 nuclei in kidney sections from our experimental groups at ×20 magnification. (G) Quantification of Ki67 positive nuclei per field of view from the experiment in (F). For all graphs, error bars represent the means±SEM of data from n=4–6 animals per group. *P<0.05 versus the UUO control.
Figure 3.
Figure 3.
Trametinib treatment ameliorated mTORC1 activation and Nox4 upregulation in UUO kidneys. (A) Western blot analysis of kidney lysates for the activation of the downstream mTORC1 effectors pP70S6K, p4E-BP1, and pS6. (B–D) Densitometric analysis of Western blots in (A). Protein loading was normalized with tubulin or total S6 as appropriate. (E) Kidney sections from our experimental groups were immunostained with a specific antibody recognizing phospho-S6. Representative images at ×10 magnification are shown. (F) Quantification of positive pS6 staining in (E). (G) Kidney lysates were subjected to Western blot and membranes were probed with a specific anti-Nox4 antibody. (H) Densitometric analysis of the normalized Nox4 protein bands in (G). For all graphs, error bars represent the means±SEM of data from n=4–6 animals per group. *P<0.05 versus the UUO control.
Figure 4.
Figure 4.
Trametinib inhibited STAT3, NF-κB, and Smad2/3 activation and macrophage infiltration in the UUO kidney. (A) Western blot analysis of kidney lysates for the activation of STAT3, P65 (the main subunit of NF-κB), and Smad2/3 in UUO kidneys. A representative photomicrograph of n=2 Western blots is shown. Membranes were stripped and protein loading was normalized against total STAT3, total P65, or tubulin as appropriate. (B–E) Densitometric analysis of the Western blot shown in (A). (F) Immunostaining of kidney sections for macrophage infiltration with F4/F80 at ×20 magnification. (G) Quantification of positively stained area as percentage of total area from the section in (F). For all graphs, error bars represent the means±SEM of data from n=4–6 animals per group. *P<0.05 versus the UUO control.
Figure 5.
Figure 5.
Delayed administration of trametinib suppressed collagen deposition and αSMA expression in the UUO kidney. (A) Representative images of Sirius red staining from UUO (10 days postsurgery) or contralateral sham-operated kidneys (control) at ×20 magnification. Animals received trametinib (3 mg/kg daily for six consecutive days, 4 days after surgery) or vehicle as indicated; n=6 in each group. (B) Quantification of positively Sirius red stained in (A), expressed as percentage of total area. (C) Representative image of Western blot analysis of whole kidney lysates probed for αSMA and vimentin. (D and E) Densitometric analysis of band intensities for αSMA and vimentin normalized for protein loading against tubulin. The normalized optical intensity of the sham control samples was arbitrarily set to 1. (F) Representative images of immunostaining of kidney sections at ×10 magnification from our experimental animals for αSMA. (G) Densitometric analysis of αSMA-positive staining from the sections in (F). For all graphs, error bars represent the means±SEM of data from n=4–6 animals per group. *P<0.05 versus the UUO control.
Figure 6.
Figure 6.
Blockade of the ERK1/2 pathway ameliorated collagen deposition and αSMA expression in the kidneys of adenine-fed animals. (A) Staining with hematoxylin and eosin of kidney sections from adenine-fed (Adenine) or control kidneys (Control) at ×5 magnification. Animals received trametinib (0.3 mg/kg once daily for the duration of the experiment) or vehicle as indicated; n=7–8 per group. (B) Sirius red staining of kidney sections from the animals in (A) at ×20 magnification, and (C) quantification of stained area as percentage of total area. (D) Immunostaining of kidney sections for αSMA at ×20 magnification and (E) quantification of positive αSMA staining. (F) Western blot of whole-kidney lysates for αSMA and vimentin expression. Membranes were subsequently stripped and reprobed for tubulin, as loading control. A representative photomicrograph from n=2 Western blots with n=4–6 animals in each group is shown. OD of the (G) αSMA and (H) vimentin bands in (F) were normalized against tubulin. The normalized density of the sham-vehicle treated samples was arbitrarily set to 1. For all graphs, error bars represent the means±SEM of data from n=4–6 animals per group for Western blots, and n=7–8 for immunostaining experiments. *P<0.05 versus the control.
Figure 7.
Figure 7.
Trametinib inhibits ERK1/2 and mTORC1 pathway activation, αSMA expression, and proliferation of primary human renal fibroblasts in response to TGF-β1. (A) Serum-starved human renal fibroblasts were preincubated with trametinib (10 nM) for 30 minutes before stimulation with TGF-β1 (5 ng/ml) for the indicated times. ERK1/2, P70S6K, S6, and Smad2/3 activation were probed with Western blotting. Membranes were subsequently stripped and reprobed for total ERK1/2 and β-actin to ensure equal protein loading. A representative image from n=3 independent experiments is shown. (B–E) Normalized optical densities of the phospho-P70S6K, phospho-S6, phospho-Smad2/3, and phospho-ERK1/2 bands against the appropriate loading controls. The value of the unstimulated control at time 0 was arbitrarily set to 1. Bars represent the means±SEM from n=3 experiments; *P<0.05. (F) Primary human renal fibroblasts in complete medium were preincubated for 30 minutes with trametinib (10 or 20 nM) or vehicle and then stimulated with TGF-β1 (5 ng/ml) for 24 hours. The activation of ERK1/2, Smad2/3, P70S6K, and S6 was determined by Western blotting as in (A). (G–J) Densitometric analysis of the Western blots in (F). Band intensity was normalized against total ERK1/2 or β-actin as appropriate, and expressed as folds of the unstimulated control. Bars represent the means±SEM from n=3 experiments; *P<0.05. (K) Human renal fibroblast were stimulated with TGF-β1 (5 ng/ml) for 24 hours in the presence or absence of trametinib as indicated and αSMA expression was determined by Western blotting. (L) Densitometric analysis of the experiments shown in (K). Bars represent the means±SEM from n=3 independent experiments; *P<0.05. (M and N) Human renal fibroblasts in complete medium were preincubated with vehicle or the indicated concentrations of trametinib for 30 minutes. Subsequently, some fibroblasts were stimulated with TGF-β1 (5 ng/ml) as appropriate and their proliferation was estimated by the MTT assay after 24 or 48 hours. Each condition was assayed in triplicate. The absorbance at 550 nm of the control unstimulated sample after 24 hours was arbitrarily set to 1. Bars represent the means±SEM from n=3 experiments; *P<0.05.

Similar articles

Cited by

References

    1. Hill NR, Fatoba ST, Oke JL, Hirst JA, O’Callaghan CA, Lasserson DS, et al. .: Global prevalence of chronic kidney disease - a systematic review and meta-analysis. PLoS One 11: e0158765, 2016 - PMC - PubMed
    1. Duffield JS: Cellular and molecular mechanisms in kidney fibrosis. J Clin Invest 124: 2299–2306, 2014 - PMC - PubMed
    1. Leaf IA, Duffield JS: What can target kidney fibrosis? Nephrol Dial Transplant 32[Suppl 1]: i89–i97, 2017 - PubMed
    1. Nicholson ML, McCulloch TA, Harper SJ, Wheatley TJ, Edwards CM, Feehally J, et al. .: Early measurement of interstitial fibrosis predicts long-term renal function and graft survival in renal transplantation. Br J Surg 83: 1082–1085, 1996 - PubMed
    1. Campanholle G, Ligresti G, Gharib SA, Duffield JS: Cellular mechanisms of tissue fibrosis. 3. Novel mechanisms of kidney fibrosis. Am J Physiol Cell Physiol 304: C591–C603, 2013 - PMC - PubMed

Publication types

MeSH terms

LinkOut - more resources