. 2018 Sep 6;7(12):e1500108.
doi: 10.1080/2162402X.2018.1500108. eCollection 2018.

Contrasting impact of corticosteroids on anti-PD-1 immunotherapy efficacy for tumor histologies located within or outside the central nervous system

Affiliations

Contrasting impact of corticosteroids on anti-PD-1 immunotherapy efficacy for tumor histologies located within or outside the central nervous system

Russell Maxwell et al. Oncoimmunology. .

Abstract

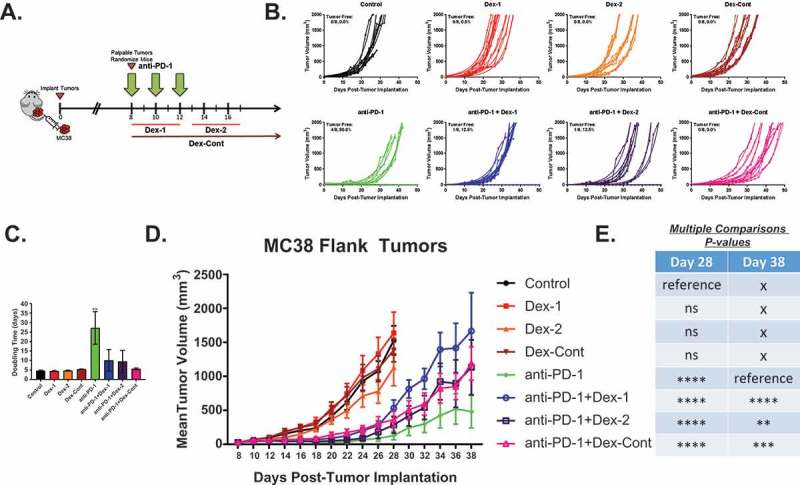
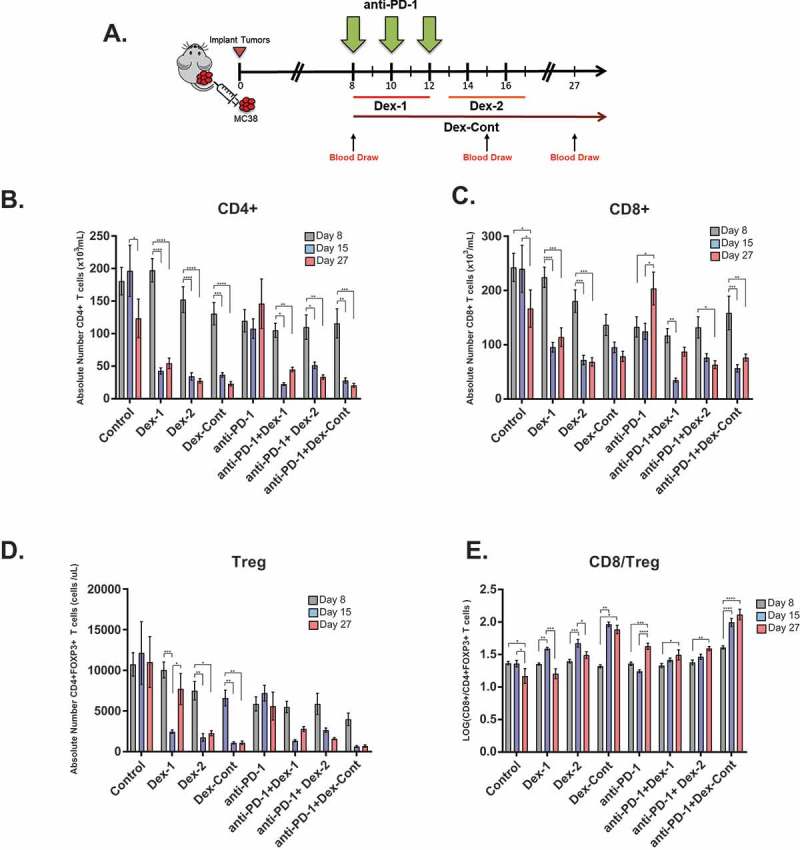
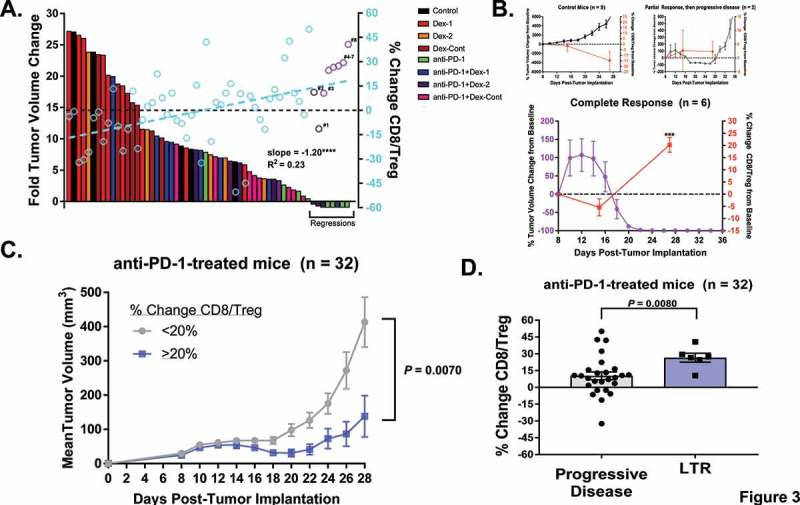
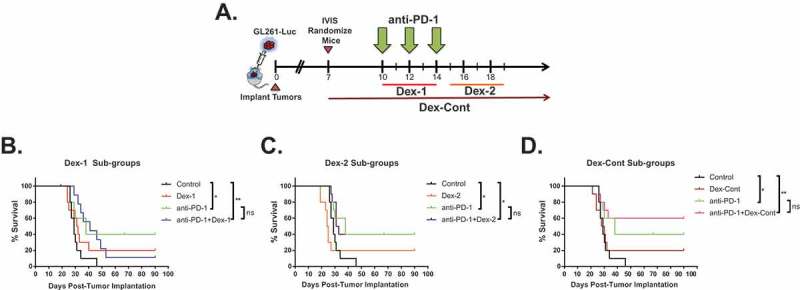
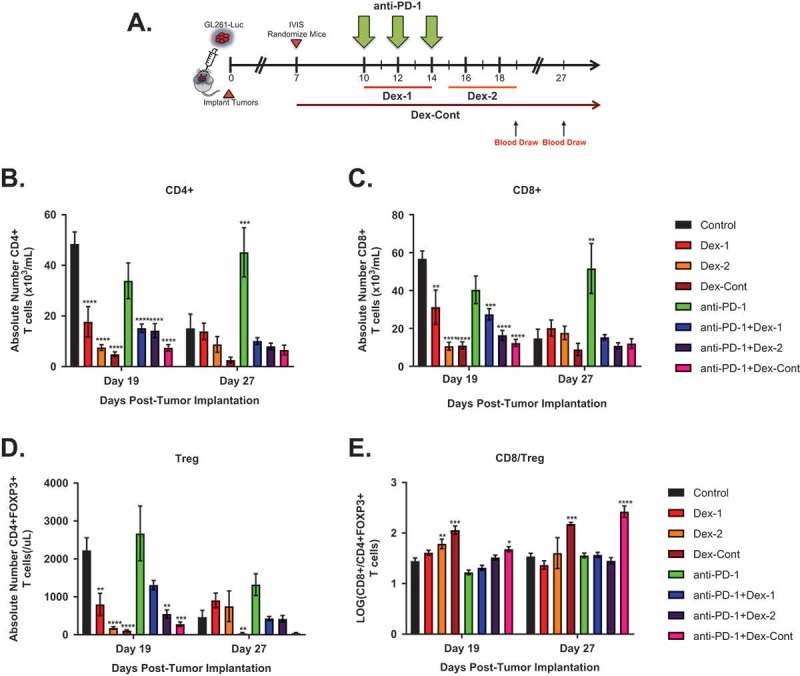
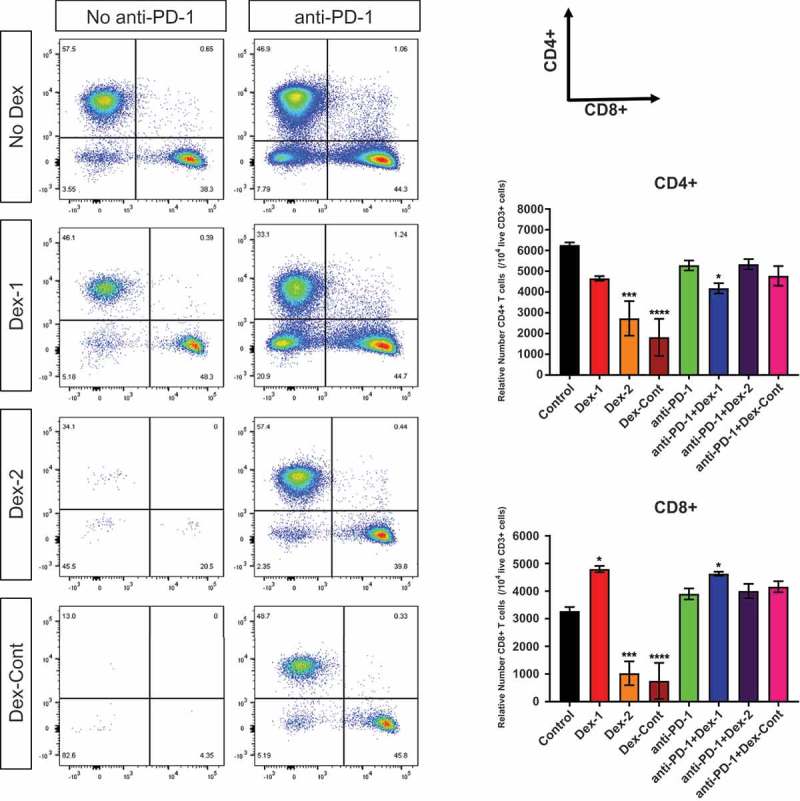
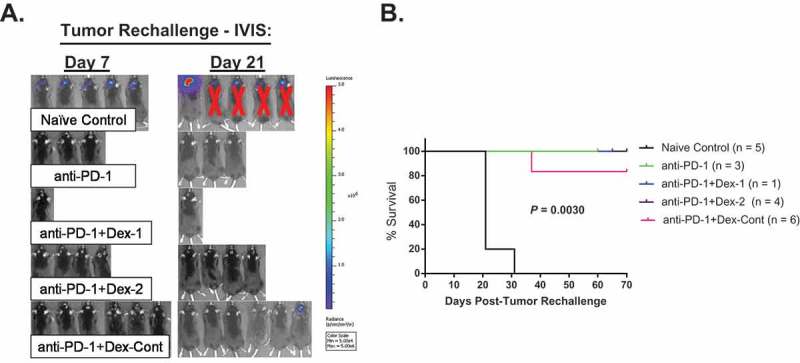
Immune checkpoint blockade targeting programmed cell death protein 1 (PD-1) is emerging as an important treatment strategy in a growing list of cancers, yet its clinical benefits are limited to a subset of patients. Further investigation of tumor-intrinsic predictors of response and how extrinsic factors, such as iatrogenic immunosuppression caused by conventional therapies, impact the efficacy of anti-PD-1 therapy are paramount. Given the widespread use of corticosteroids in cancer management and their immunosuppressive nature, this study sought to determine how corticosteroids influence anti-PD-1 responses and whether their effects were dependent on tumor location within the periphery versus central nervous system (CNS), which may have a more limiting immune environment. In well-established anti-PD-1-responsive murine tumor models, corticosteroid therapy resulted in systemic immune effects, including severe and persistent reductions in peripheral CD4+ and CD8 + T cells. Corticosteroid treatment was found to diminish the efficacy of anti-PD-1 therapy in mice bearing peripheral tumors with responses correlating with peripheral CD8/Treg ratio changes. In contrast, in mice bearing intracranial tumors, corticosteroids did not abrogate the benefits conferred by anti-PD-1 therapy. Despite systemic immune changes, anti-PD-1-mediated antitumor immune responses remained intact during corticosteroid treatment in mice bearing intracranial tumors. These findings suggest that anti-PD-1 responses may be differentially impacted by concomitant corticosteroid use depending on tumor location within or outside the CNS. As an immune-specialized site, the CNS may potentially play a protective role against the immunosuppressive effects of corticosteroids, thus sustaining antitumor immune responses mediated by PD-1 blockade.

Keywords: PD-1; brain tumor; central nervous system; colon adenocarcinoma; corticosteroid; dexamethasone; glioma; immunotherapy.


Figures

Figure 1.
Figure 1.
Dexamethasone impairs colon adenocarcinoma MC38 flank tumor growth patterns in mice administered anti-PD-1 therapy. (A) Schematic diagram of experimental design and treatment paradigm: Female C57BL/6J mice (N = 64) were subcutaneously inoculated with 500,000 colon adenocarcinoma MC38 cells in the right flank (day 0) and monitored for tumor growth. Once tumors were palpable, mice were randomized (8 mice/group) to ensure tumor burden was equal amongst the groups (day 8). Mice were administered anti-PD-1 antibody (200 ug/dose, 10 mg/kg, intraperitoneal injection) on days 8, 10, and 12; concurrent dexamethasone (200 ug/dose, 10 mg/kg, intraperitoneal injection) on days 8 through 12 (Dex-1); sequential dexamethasone on days 13 through 17 (Dex-2); and/or continuous dexamethasone from days 8 (randomization date) through 36 (4 weeks) with taper (Dex-Cont). (B) Individual tumor volume growth curves by treatment group: Mice that did not receive anti-PD-1 therapy had continued exponential tumor growth, resulting in no tumor-free mice (0.0%). Anti-PD-1 monotherapy resulted in 50.0% tumor-free mice. However, combination anti-PD-1 and dexamethasone therapy appeared to disrupt this trend (% tumor-free: anti-PD-1 + Dex-1, 12.5%; anti-PD-1 + Dex-2, 12.5%; anti-PD-1 + Dex-Cont, 0.0%). (C) Anti-PD-1 monotherapy resulted in a significantly prolonged tumor doubling time compared to untreated control mice. This effect was abrogated by dexamethasone therapy. (D) and (E) Tumor volume growth patterns between the groups: Anti-PD-1 therapy, regardless of dexamethasone treatment, delayed the early growth of tumors compared to untreated control mice on day 28. However, this effect was abrogated with dexamethasone treatment long-term on day 38. Means were compared using one-way ANOVA and Dunnett’s multiple comparisons test (untreated control and anti-PD-1 alone arms were the designated reference groups on days 28 and 38, respectively). ns, > 0.05; *, < 0.05; **, P < 0.01; ***, < 0.001; ****, P < 0.0001. If no asterisks are shown in (C), statistical analyzes yielded non-significant P-values.
Figure 2.
Figure 2.
Dexamethasone alone or combined with anti-PD-1 therapy significantly alters peripheral T cell compartments in mice bearing colon adenocarcinoma MC38 flank tumors. (A) Timeline of blood draws relative to treatment schedule in MC38 flank tumor experiment (N = 64, 8 mice/group): Blood was collected from the retro-orbital venous plexus of each mouse on days 8 (pre-treatment), 15 (shortly after anti-PD-1 therapy completion), and 27 (long time after anti-PD-1 therapy). Depicted are absolute numbers of (B) CD4+, (C) CD8+, (D) CD4+ FOXP3+ regulatory T cells (Treg), and (E) CD8/Treg ratios in peripheral blood by treatment group. Means were compared within each group using one-way ANOVA and Tukey’s multiple comparisons test. Dexamethasone treatment, either alone or in combination with anti-PD-1 therapy, resulted in persistent reductions within CD4+, CD8+, and Treg compartments. Anti-PD-1 therapy improved peripheral CD8/Treg ratios. *, < 0.05; **, P < 0.01; ***, < 0.001; ****, P < 0.0001. If no asterisks are shown, statistical analyzes yielded non-significant P-values.
Figure 3.
Figure 3.
Peripheral CD8/Treg ratio changes correlate with tumor regressions and long-term responses in mice bearing colon adenocarcinoma MC38 flank tumors given anti-PD-1 therapy with or without dexamethasone. (A) Waterfall plot (n = 58) of fold tumor volume changes from day 12 (immediately after last anti-PD-1 dose) to day 28 (approximately 2 weeks following anti-PD-1 treatment) overlaid with scatter plot of peripheral CD8/Treg ratio changes from day 15 to 27 (open circles): As visualized, mice treated with anti-PD-1 therapy alone represented the majority of mice with tumor regressions (n = 8). Two mice within the anti-PD-1 + Dex-2 group (gray open circles, labeled #1–2) were found to have partial responses, which were then followed by progressive disease. Six mice (purple open circles, labeled #3–8, anti-PD-1: n = 4, anti-PD-1 + Dex-1: n = 1, anti-PD-1 + Dex-2: n = 1) had complete responses, which were durable. Additionally, tumor volume changes were inversely related to CD8/Treg ratio changes (slope = −1.20, R2 = 0.23, P < 0.0001). (B) Dynamics between tumor volume and peripheral CD8/Treg ratio changes from baseline in untreated controls (top left panel), partial responders followed by progressive disease (top right panel), and complete responders (bottom panel): As visualized, tumor growth typically coincided with drops in CD8/Treg ratios in control mice. However, complete responders had a significant increase in their CD8/Treg ratios, which correlated with tumor regressions. The partial responders who ultimately had PD failed to display this trend. (C) In all mice administered anti-PD-1 therapy (n = 32), regardless of dexamethasone treatment, those with ≥ 20% change in peripheral CD8/Treg ratios had significantly slower tumor growths compared to those with < 20% changes. (D) Moreover, in all mice treated with anti-PD-1 therapy (n = 32), long-term responders (LTR) had higher peripheral CD8/Treg ratio changes compared to those with progressive disease (P = 0.0080). Means for (C) and (D) were compared using Welch’s t-test assuming unequal variances. *, < 0.05; **, P < 0.01; ***, < 0.001; ****, P < 0.0001. If no asterisks are shown, statistical analyzes yielded non-significant P-values.
Figure 4.
Figure 4.
Dexamethasone does not abrogate the survival benefit conferred by anti-PD-1 therapy in intracranial glioma-bearing mice. (A) Schematic diagram of experimental design and treatment paradigm: Female C57BL/6J mice (n = 80) were intracranially implanted with 130,000 luciferase-expressing glioma (GL261-Luc) cells within the left striatum and monitored for tumor growth by bioluminescence imaging using an In Vivo Imaging System (IVIS). On day 7, mice were randomized (10 mice/group) to ensure tumor burden was equal amongst the groups. Mice were administered anti-PD-1 antibody (200 ug/dose, 10 mg/kg intraperitoneal injection) on days 10, 12, and 14; concurrent dexamethasone (200 ug/dose, 10 mg/kg, intraperitoneal injection) on days 10 through 14 (Dex-1); sequential dexamethasone on days 15 through 19 (Dex-2); and/or continuous dexamethasone from days 7 (randomization date) through 35 (4 weeks) with taper (Dex-Cont). (B) Dex-1, (C) Dex-2, and (D) Dex-Cont sub-group analyzes demonstrate combination therapy with dexamethasone does not significantly impair the survival advantage conferred by PD-1 blockade in mice harboring intracranial GL261-Luc tumors. ns, > 0.05; *, < 0.05; **, P < 0.01; ***, < 0.001; ****, P < 0.0001.
Figure 5.
Figure 5.
Dexamethasone alone or combined with anti-PD-1 therapy significantly alters peripheral T cell compartments in mice bearing intracranial glioma tumors. (A) Timeline of blood draws relative to treatment schedule in the intracranial GL261-Luc experiment (N = 80, 10 mice/group): Blood was collected from the retro-orbital venous plexus of each mouse on days 19 and 27. Depicted are absolute numbers of (B) CD4+, (C) CD8+, (D) CD4+ FOXP3+ regulatory T cells (Treg), and (E) CD8/Treg ratios in peripheral blood by treatment group. Dexamethasone treatment, either alone or in combination with anti-PD-1 therapy, resulted in persistent reductions within CD4+, CD8+, and Treg compartments. *, < 0.05; **, P < 0.01; ***, < 0.001; ****, P < 0.0001. If no asterisks are shown, statistical analyzes yielded non-significant P-values.
Figure 6.
Figure 6.
Anti-PD-1-mediated antitumor immune responses are maintained during combination dexamethasone therapy, as witnessed in tumor-draining lymph nodes (TDLN) of glioma-bearing mice. Representative flow cytometry scatter plots of CD4+ vs. CD8+ surface markers (gated on live CD3+ T cells) and their aggregate analyzes derived from TDLN (harvested on day 19, 5 mice/group): Compared to untreated control mice, dexamethasone monotherapy substantially reduced CD4+ and CD8+ T cell numbers in TDLN. However, these levels were maintained in mice receiving combination anti-PD-1 and dexamethasone therapy. *, < 0.05; **, P < 0.01; ***, < 0.001; ****, P < 0.0001. If no asterisks are shown, statistical analyzes yielded non-significant P-values.
Figure 7.
Figure 7.
Tumor-specific immunologic memory is grossly preserved in long-term responders treated with combination anti-PD-1 and dexamethasone therapy. Briefly, long-term survivors along with naïve control mice (n = 5) underwent tumor rechallenge by implanting 260,000 GL261-Luc cells within the contralateral cerebral hemisphere (day 0). Tumor burden was monitored via bioluminescence using an In Vivo Imaging System (IVIS). (A) IVIS imaging results on days 7 and 21 following tumor rechallenge: On day 7, all naïve control mice established tumors, while none of the long-term survivors had tumors. However, 1 of 6 mice (17%) in the anti-PD-1 + Dex-Cont group was found to have a tumor on day 21. (C) Survival analyzes of tumor rechallenge experiment: Except for the naïve controls and the one anti-PD-1 + Dex-Cont mouse with tumor on day 21, all other mice had prolonged survival following tumor rechallenge, suggesting intact immunologic memory.

Similar articles

Cited by

References

    1. Robert C, Long GV, Brady B, Dutriaux C, Maio M, Mortier L, Hassel JC, Rutkowski P, McNeil C, Kalinka-Warzocha E, et al. Nivolumab in previously untreated melanoma without BRAF mutation. N Engl J Med. 2015;372(4):320–330. doi:10.1056/NEJMoa1412082. - DOI - PubMed
    1. Robert C, Schachter J, Long GV, Arance A, Grob JJ, Mortier L, Daud A, Carlino MS, McNeil C, Lotem M, et al. Pembrolizumab versus ipilimumab in advanced melanoma. N Engl J Med. 2015;372(26):2521–2532. doi:10.1056/NEJMoa1503093. - DOI - PubMed
    1. Brahmer J, Reckamp KL, Baas P, Crinò L, Eberhardt WEE, Poddubskaya E, Antonia S, Pluzanski A, Vokes EE, Holgado E, et al. Nivolumab versus docetaxel in advanced squamous-cell non-small-cell lung cancer. N Engl J Med. 2015;373(2):123–135. doi:10.1056/NEJMoa1504627. - DOI - PMC - PubMed
    1. Borghaei H, Paz-Ares L, Horn L, Spigel DR, Steins M, Ready NE, Chow LQ, Vokes EE, Felip E, Holgado E, et al. Nivolumab versus docetaxel in advanced nonsquamous non-small-cell lung cancer. N Engl J Med. 2015;373(17):1627–1639. doi:10.1056/NEJMoa1507643. - DOI - PMC - PubMed
    1. Motzer RJ, Escudier B, McDermott DF, George S, Hammers HJ, Srinivas S, Tykodi SS, Sosman JA, Procopio G, Plimack ER, et al. Nivolumab versus everolimus in advanced renal-cell carcinoma. N Engl J Med. 2015;373(19):1803–1813. doi:10.1056/NEJMoa1510665. - DOI - PMC - PubMed

Publication types