. 2018 Dec 6;9(1):5226.
doi: 10.1038/s41467-018-07425-1.

STING-dependent sensing of self-DNA drives silica-induced lung inflammation

Affiliations

STING-dependent sensing of self-DNA drives silica-induced lung inflammation

Sulayman Benmerzoug et al. Nat Commun. .

Abstract

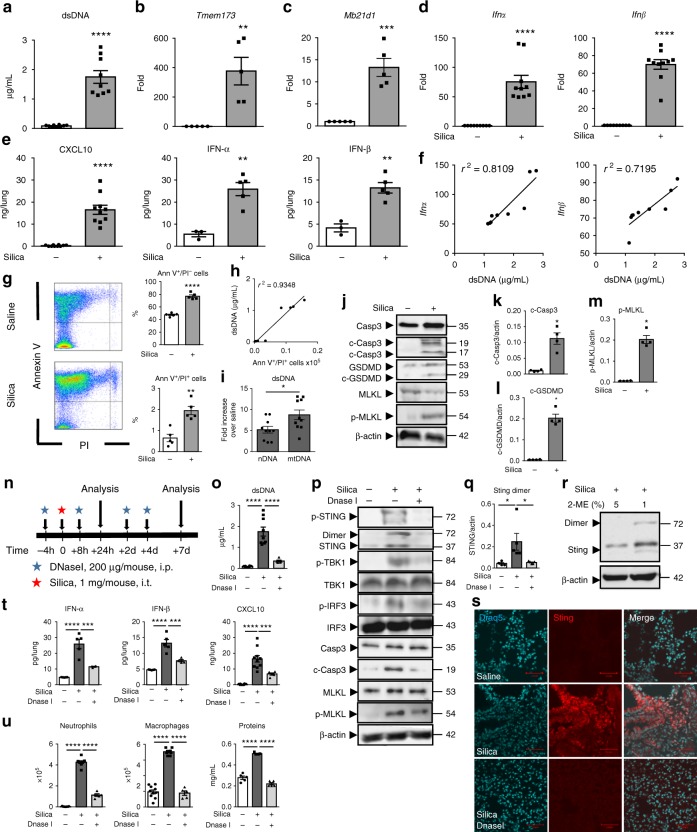
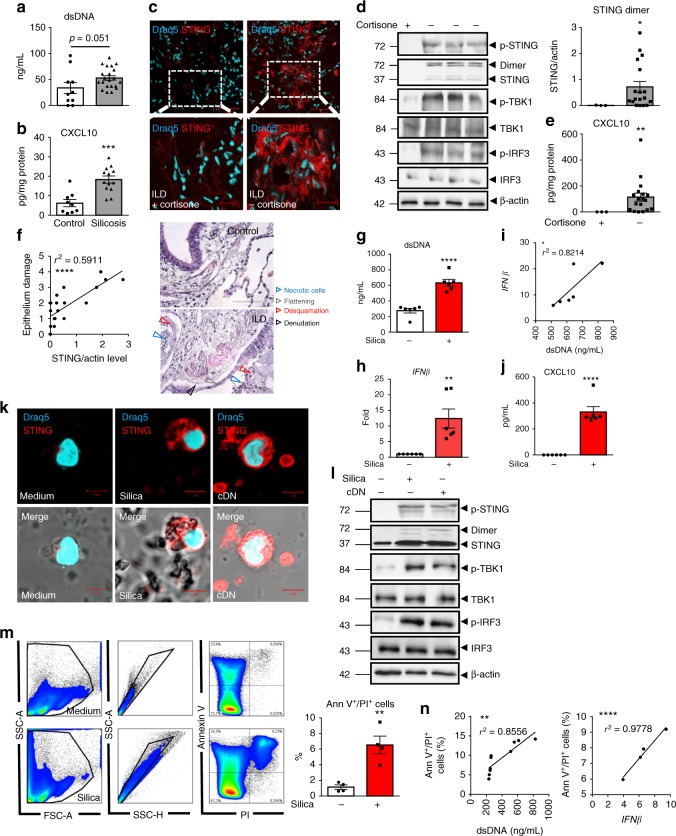
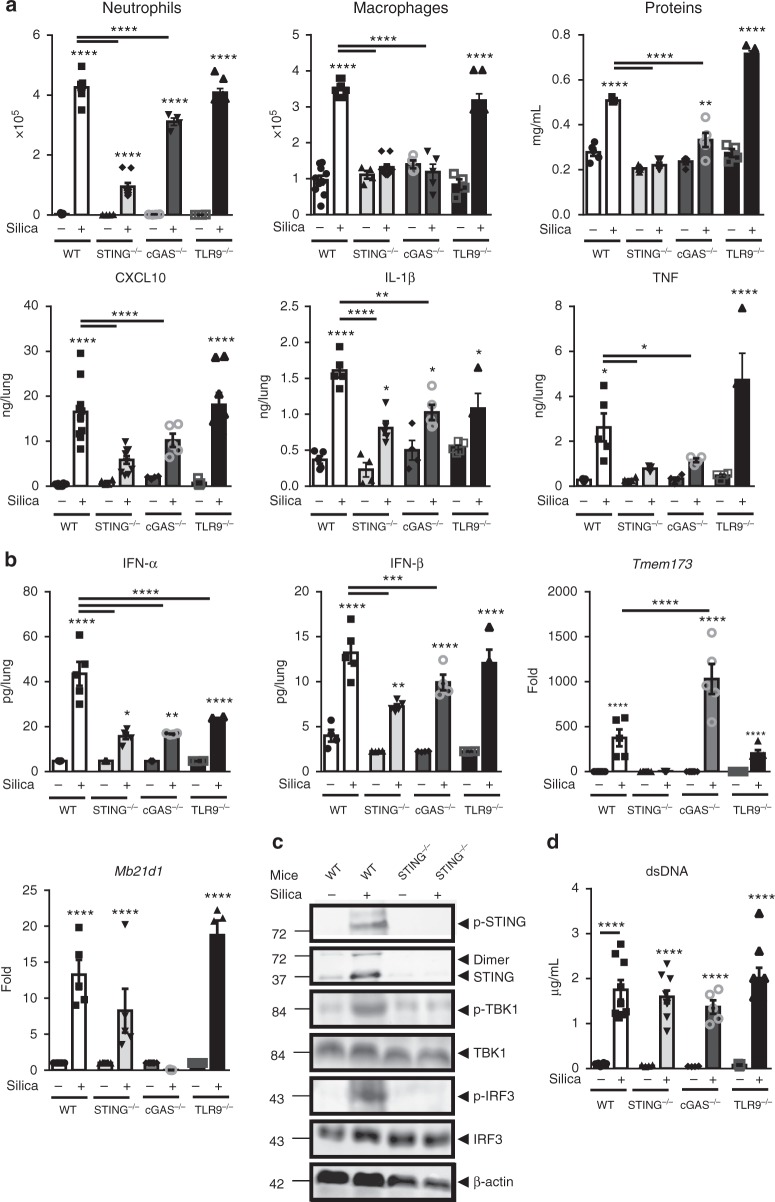
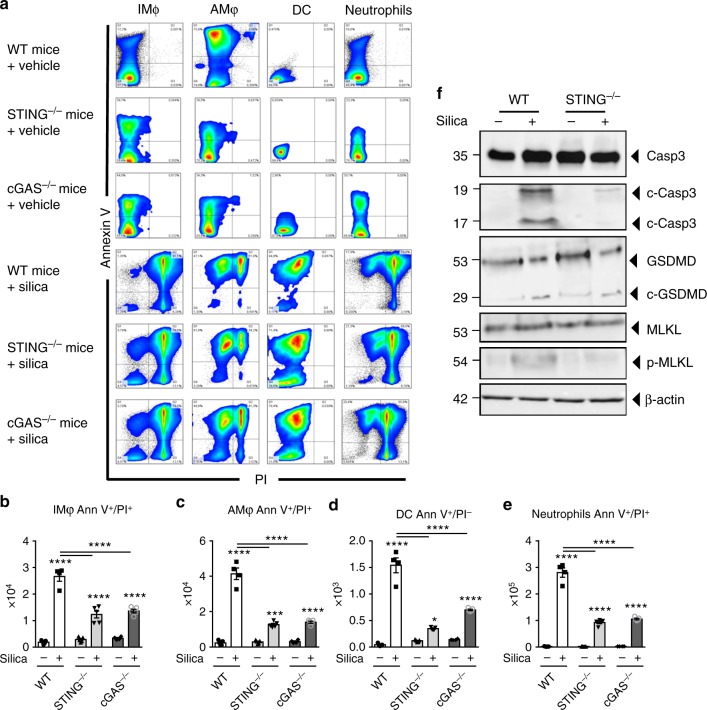
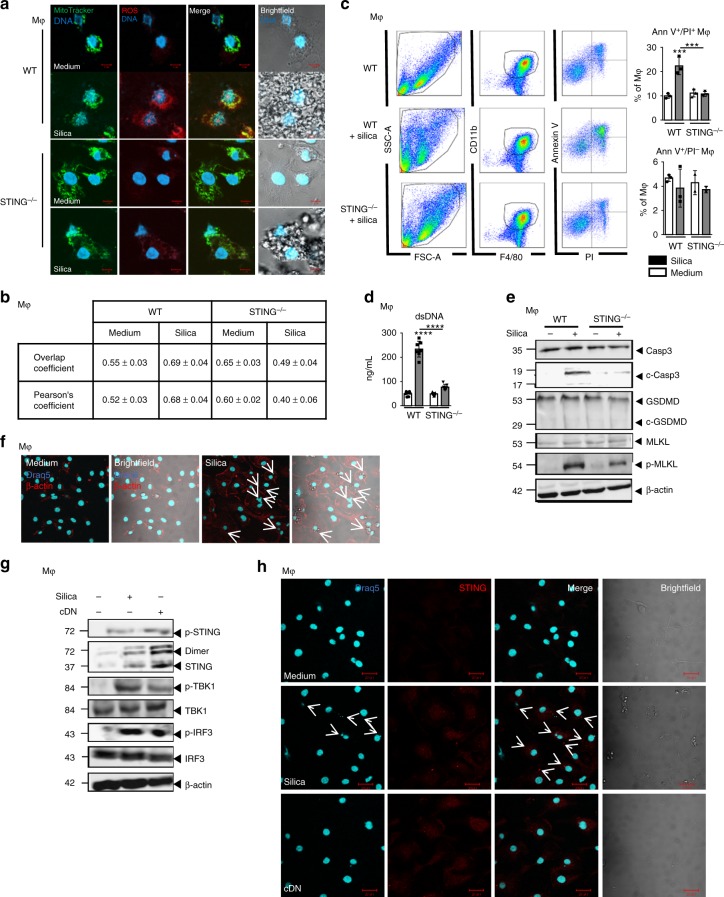
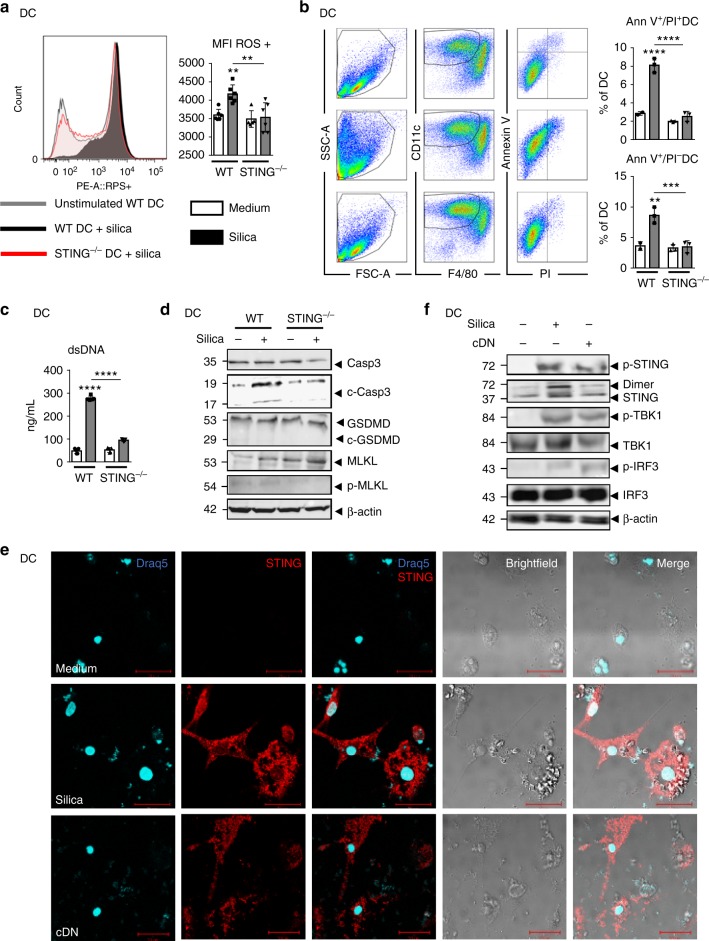
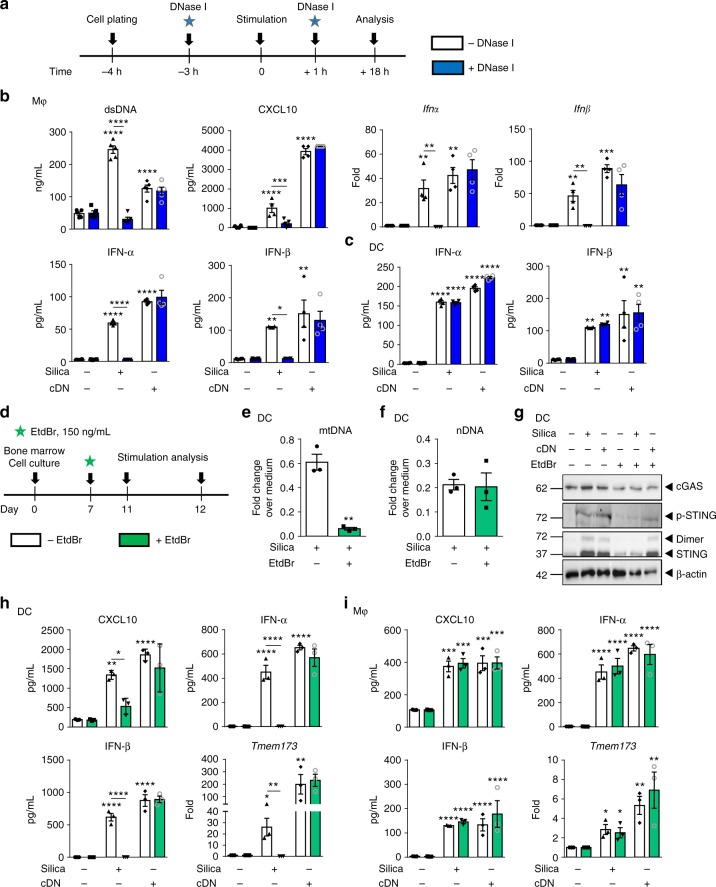
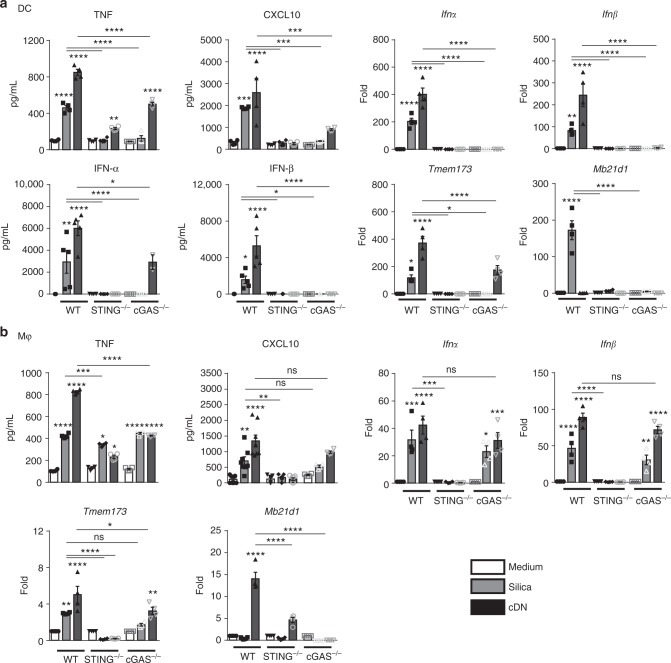
Silica particles induce lung inflammation and fibrosis. Here we show that stimulator of interferon genes (STING) is essential for silica-induced lung inflammation. In mice, silica induces lung cell death and self-dsDNA release in the bronchoalveolar space that activates STING pathway. Degradation of extracellular self-dsDNA by DNase I inhibits silica-induced STING activation and the downstream type I IFN response. Patients with silicosis have increased circulating dsDNA and CXCL10 in sputum, and patients with fibrotic interstitial lung disease display STING activation and CXCL10 in the lung. In vitro, while mitochondrial dsDNA is sensed by cGAS-STING in dendritic cells, in macrophages extracellular dsDNA activates STING independent of cGAS after silica exposure. These results reveal an essential function of STING-mediated self-dsDNA sensing after silica exposure, and identify DNase I as a potential therapy for silica-induced lung inflammation.


Conflict of interest statement

The authors declare no competing interests.

Figures

Fig. 1
Fig. 1
Self-dsDNA release is central to silica-induced lung inflammation and type I IFN response. am Silica microparticles (1 mg/mouse, i.t.) or saline were administered in WT mice and parameters were analyzed on day 7. a Concentration of extracellular dsDNA in the acellular fractions of bronchoalveolar lavage fluid (BALF). bd Tmem173, Mb21d1, Ifnα, and Ifnβ transcripts in the lungs and normalized to Gapdh expression. e Lung CXCL10 determined by ELISA and IFN-αβ proteins quantified by multiplex immunoassay. f Correlation between extracellular dsDNA concentrations and type I IFN gene expression. g Annexin V/PI flow cytometry analysis pre-gated on singlet cells. h Correlation between dead cells and extracellular dsDNA. i Increased nuclear DNA (nDNA) and mitochondrial DNA (mtDNA) in the BALF after silica exposure. j Immunoblots of caspase 3 (Casp3), cleaved caspase 3 (c-Casp3), gasdermin D (GSDMD), MLKL, and phosphorylated-MLKL (p-MLKL), normalized to β-actin. Immunoblot quantifications of (k) c-Casp3, (l) c-GSDMD, and (m) p-MLKL. nu Silica microparticles administered with DNase I (200 µg/mouse, i.p.) as indicated (n). o Extracellular dsDNA in BALF acellular fraction. p Lung immunoblots of phospho-STING, STING, phospho-TBK1, TBK1, phospho-IRF3, IRF3, caspase 3 (Casp3), cleaved caspase 3 (c-Casp3), MLKL, and phosphorylated-MLKL (p-MLKL), with β-actin as a reference. q Quantification of STING dimer, relative to β-actin. r STING immunoblots under 5% reducing (left) or 1% 2-mercaptoethanol seminative conditions (2-ME; right). s Lung confocal images of DNA dye Draq5 (cyan) and STING (red). Bars, 20 µm. t Pulmonary IFN-αβ and CXCL10. u Neutrophils, macrophages, and protein extravasation in the BALF. *p < 0.05, **p < 0.01, ***p < 0.001, ****p < 0.0001 (Kruskal–Wallis test followed by Dunn post test). The correlation analysis was nonparametric (Spearman correlation). Data are mean ± SEM representative of two independent experiments (af: mice per group: n = 5 or 10 (WT NaCl), n = 8 or 10 (WT silica); gh: mice per group: n = 5 (WT NaCl), n = 5 (WT silica); in: mice per group, n = 5 or 10 (WT NaCl), n = 5 or 10 (WT silica), and n = 5 (WT silica + DNase I)). Immunoblots representative of n = 6 samples from three independent experiments (j, p), or n = 8 samples from two independent experiments (r), quantified in bargraphs with n = 4. Each symbol represents an individual mouse. Source data are provided as a Source Data file
Fig. 2
Fig. 2
Circulating DNA and CXCL10 in the airways of silicosis patients, STING, and type I IFN pathway activation in ILD patient lungs. a, b Presence of (a) dsDNA in the plasma and (b) CXCL10 in the sputum of patients with silicosis (ILO 5–12, see Table 1), as compared with healthy individuals (ILO 0). cf Human lung tissue samples of ILD patients treated or not with cortisone (see Table 2). c Confocal images of DNA dye Draq5 (cyan) and STING (red). Bars, 50 µm. Bars, 20 µm for zoomed regions. d Immunoblots of phosphorylated-STING (p-STING), STING, TBK1, phospho-TBK1, IRF3, phospho-IRF3, and β-actin. STING dimers quantification. e CXCL10 levels. f Correlation between STING dimers and epithelial damage scored on human histological tissue sections for necrotic cells, desquamation or denudation, and flattening of the epithelial barrier (indicated by arrows). Control lung tissue (patient G) and fibrotic area (patient D). Bars, 100 µm. gn Human PBMCs were stimulated with silica microparticles (250 µg/mL) for 18 h, transfected with c-di-AMP (6 µg/mL) or unstimulated. g Extracellular dsDNA in cell supernatant, h IFNβ transcript, i correlation between IFNβ transcripts and released dsDNA. (j) CXCL10. (k) Confocal images of DNA dye Draq5 (cyan) and STING (red). Bars, 5 µm. l Immunoblots of phospho-STING, STING, phospho-TBK1, TBK1, phospho-IRF3, IRF3, and β-actin. m Flow cytometry annexin V/PI analysis gated on singlet cells. n Correlations between dead cells and extracellular dsDNA or IFNβ transcripts. *p < 0.05, **p < 0.01, ***p < 0.001, ****p < 0.0001 (Student's t test). The correlation analysis was nonparametric (Spearman correlation). Data are mean ± SEM representative of two independent experiments. a, b Plasma samples from n = 10 healthy controls and n = 21 silicosis patients; b sputum samples from n = 9 healthy controls and n = 13 silicosis patients. cf c: Confocal image representative of three patients; d: immunoblots shown from left to right for ILD patients H, G, C, A (see Table 2), representative of n = 3 cortisone-treated ILD patients and n = 18 untreated-ILD patients, from three independent experiments, shown in df. gk PBMC from n = 6 donors per group. l Immunoblots representative of n = 6 donors from two independent experiments. mn Four donors per group, and are representative of at least two independent experiments with similar results (gn). Each symbol represents an individual. Source data are provided as a Source Data file
Fig. 3
Fig. 3
DNA sensors STING and cGAS are essential, while TLR9 is dispensable, for silica-induced lung inflammation. Silica microparticles (1 mg/mouse, i.t.) or saline vehicle were administered in WT, STING−/−, cGAS−/−, and TLR9−/− mice and the different parameters were analyzed on day 7. a Neutrophils, macrophages, and protein extravasation were measured in the BALF and the lung levels of CXCL10, IL-1β, and TNF were determined by ELISA. b Pulmonary IFN-α and IFN-β protein concentrations determined by multiplex immunoassay, and Tmem173 and Mb21d1 transcripts measured by real-time PCR. c Immunoblots of STING/IRF3 axis in the lung of WT and STING−/− mice, including phospho-STING, STING, phospho-TBK1, TBK1, phospho-IRF3, and IRF3, with β-actin as a reference. d Concentration of extracellular dsDNA in the acellular BALF fraction. *p < 0.05, **p < 0.01, ****p < 0.0001 (Kruskal–Wallis test followed by Dunn post test). Data are presented as mean ± SEM and are representative of three (a, b, d) and two (c) independent experiments. (a, b, d): mice per group: n = 10 (WT NaCl), n = 8 (WT silica), n = 4 (STING−/− NaCl), n = 7 (STING−/− silica), n = 4 (cGAS−/− NaCl), n = 5 (cGAS−/− silica), n = 5 (TLR9−/− NaCl), n = 6 (TLR9−/− silica). Immunoblots are representative of n = 6 samples from two independent experiments (c). Each symbol represents an individual mouse. Source data are provided as a Source data file
Fig. 4
Fig. 4
Reduced silica-induced inflammatory cell death in the absence of cGAS/STING. Silica microparticles (1 mg/mouse, i.t.) or saline vehicle were administered in WT, STING−/−, and cGAS−/− mice and the different parameters were analyzed on day 7, as in Fig. 3. a Flow cytometry representative dot blots showing Annexin V/PI staining of F4/80+CD11c interstitial macrophages (IM), F4/80+CD11c+ alveolar macrophages (AM), CD11c+F4/80dendritic cells (DC), and Ly6G+F4/80 neutrophils among CD45+CD11b+ cells in WT, STING−/−, and cGAS−/− mice. Bargraphs of the Annexin V/PI-stained cells among b interstitial macrophages, c alveolar macrophages, d DCs, and e neutrophils, expressed as absolute cell number per lung. f Immunoblots of caspase 3, cleaved caspase 3, gasdermin D, MLKL, and phospho-MLKL in the lung of WT and STING−/− mice with β-actin as a reference. *p < 0.05, ***p < 0.001, ****p < 0.0001 (Kruskal–Wallis test followed by Dunn post test). Data are presented as mean ± SEM and are representative of two independent experiments (ae: mice per group: n = 5 (WT NaCl), n = 4 (WT silica), n = 5 (STING−/− NaCl), n = 5 (STING−/− silica), n = 4 (cGAS−/− NaCl), n = 5 (cGAS–/– silica)). Immunoblots are representative of n = 6 samples from two independent experiments (f). Each symbol represents an individual mouse. Source data are provided as a Source Data file
Fig. 5
Fig. 5
Silica induces macrophage mitochondrial stress and necrosis, dsDNA leakage, and STING pathway activation. a, b WT and STING−/− bone marrow-derived macrophages were unstimulated or stimulated with silica (250 µg/mL) for 18 h. a Brightfield confocal microscopy showing intracellular silica microparticles and MitoTracker (green) labeled mitochondria co-localizing with superoxide production detected by MitoSOX staining (red). Images are representative of five slides from n = 3 cell cultures. Bars, 5 µm. b Colocalization analysis of MitoTracker versus MitoSOX staining from the slides shown in a. Overlap coefficient and Pearson correlation coefficient were determined using ImageJ. c Flow cytometry Annexin V/PI staining of pre-gated singlets (SSC-A/SSC-H) and CD11b+F4/80+CD11c cells. d Concentration of extracellular dsDNA in the culture supernatant. e Immunoblots of caspase 3, cleaved caspase 3, gasdermin D, MLKL, and phospho-MLKL in WT and STING−/− macrophages, with β-actin as a reference. f Confocal images of DNA Draq5 (cyan) and β-actin (red) staining in WT macrophages unstimulated or stimulated with silica (250 µg/mL) for 18 h. g Immunoblots of STING/IRF3 axis, including phospho-STING, STING, phospho-TBK1, TBK1, phospho-IRF3, IRF3, and β-actin as a reference, in WT macrophages stimulated as in ab or transfected with c-di-AMP (6 µg/mL; cDN) for 18 h as a positive control. h Confocal images of DNA dye Draq5 (cyan) and STING-specific antibody (red) in WT BMDMs stimulated as in f. Bars, 20 µm. ***p < 0.001, ****p < 0.0001 (Kruskal–Wallis test followed by Dunn post test). Data are presented as mean ± SEM and are representative of three independent experiments with similar results (a, c, d, and e) or with n = 3 independent cultures (b). Immunoblots are representative of n = 9 samples from three independent experiments (e, g). Source data are provided as a Source Data file
Fig. 6
Fig. 6
Dendritic cells respond to silica by mitochondrial and cellular stress associated with dsDNA leakage and STING activation. a, b WT and STING−/− bone marrow-derived DCs were unstimulated or stimulated with silica (250 µg/mL) for 18 h. a Flow cytometry using MitoSOX staining of mitochondria-derived superoxide production on pre-gated singlet cells (SSC-A/SSC-H) and CD11b+CD11c+F4/80 DCs. Histograms and mean fluorescence intensity (MFI) quantification. b Flow cytometry Annexin V/PI staining showing early apoptotic (Ann V+/PI) versus late apoptotic/necrotic (Ann V+/PI+) DCs. c Concentration of extracellular dsDNA in culture supernatant. d Immunoblots of caspase 3, cleaved caspase 3, gasdermin D, MLKL, and phospho-MLKL in WT and STING−/− DCs with β-actin as a reference. e Confocal images of DNA dye Draq5 (cyan) and STING-specific antibody (red) in WT DCs stimulated as in a, b or transfected with c-di-AMP (6 µg/mL; cDN) for 18 h as a positive control. Bars, 20 µm. f WT DC immunoblots of STING/IRF3 axis including phospho-STING, STING, phospho-TBK1, TBK1, phospho-IRF3, and IRF3, with β-actin as a reference. *p < 0.05, **p < 0.01, ****p < 0.0001 (Mann–Whitney U analysis). Data are presented as mean ± SEM and are representative of two independent experiments with similar results (a, c, d) or with n = 3 independent cultures (a, b, e). Immunoblots are representative of n = 9 samples from three independent experiments (d, f). Source data are provided as a Source Data file
Fig. 7
Fig. 7
Extracellular self-dsDNA is key to silica-induced inflammatory response in macrophages, not in DCs. ac Extracellular DNase I treatment (1 µg/mL) was applied 3 h prior and 1 h after silica exposure (250 µg/mL) or transfection with c-di-AMP (6 µg/mL; cDN) for 18 h in bone marrow-derived macrophages (b) and dentritic cells (c). b Macrophage concentration of extracellular dsDNA and CXCL10 in culture supernatant. Ifnα and Ifnβ transcripts measured by real-time PCR on cell fractions and IFN-α and IFN-β protein concentrations determined in culture supernatants by multiplex immunoassay. c Dendritic cell IFN-α and IFN-β protein concentrations determined in culture supernatants by multiplex immunoassay. di Mitochondrial DNA replication was inhibited using a low concentration of EtdBr (150 ng/mL) on day 7 of bone marrow cell culture. On day 11, bone marrow-derived DCs (eh) and macrophages (i) were unstimulated, stimulated with silica (250 µg/mL), or transfected with c-di-AMP (6 µg/mL; cDN) for 18 h. Fold change of (e) mitochondrial DNA (mMitoF1 and mMitoR1) and (f) nuclear DNA (mB2MF1 and mB2MR1) in untreated versus EtdBr-treated DC exposed to silica, as compared to untreated unstimulated cells. g Immunoblot showing cGAS, phospho-STING, STING protein expression, and dimerization in DCs after EtdBr treatment, with β-actin as a reference. h CXCL10 level in DC supernatant quantified by ELISA and IFN-α and IFN-β concentrations determined by multiplex immunoassay. Tmem173 transcripts measured by real-time PCR. i CXCL10 level in macrophage supernatant quantified by ELISA and IFN-α and IFN-β concentrations determined by multiplex immunoassay. Tmem173 transcripts measured by real-time PCR. *p < 0.05, **p < 0.01, ***p < 0.001, ****p < 0.0001 (Mann–Whitney U analysis). Data are presented as mean ± SEM and are representative of two independent experiments with n = 4 independent cultures. Immunoblots are representative of n = 2 samples per condition (g). Source data are provided as a Source Data file
Fig. 8
Fig. 8
Different cGAS requirement for silica-induced STING-dependent activation in macrophages and DCs. Bone marrow-derived DCs (a) or macrophages (b) from WT, STING−/−, and cGAS−/− were unstimulated, stimulated with silica (250 µg/mL), or transfected with c-di-AMP (6 µg/mL; cDN) for 18 h. a Levels of TNF and CXCL10 quantified by ELISA in DC supernatant. Ifnα, Ifnβ, Tmem173, and Mb21d1 transcripts measured by real-time PCR on DC cell fractions. IFN-α and IFN-β protein concentrations determined in the DC supernatant by multiplex immunoassay. b Levels of TNF and CXCL10 quantified by ELISA in macrophage supernatant. Ifnα, Ifnβ, Tmem173, and Mb21d1 transcripts measured by real-time PCR on macrophage cell fractions. ns p > 0.05 not significant, *p < 0.05, **p < 0.01, ***p < 0.001, ****p < 0.0001 (Kruskal–Wallis test followed by Dunn post test). Data are presented as mean ± SEM (n = 6) and are representative of two independent experiments. Source data are provided as a Source Data file

Similar articles

Cited by

References

    1. Yoruk O, et al. The effects of silica exposure on upper airways and eyes in denim sandblasters. Rhinology. 2008;46:328–333. - PubMed
    1. Bakan ND, et al. Silicosis in denim sandblasters. Chest. 2011;140:1300–1304. doi: 10.1378/chest.10-1856. - DOI - PubMed
    1. Akgun M, et al. Silicosis appears inevitable among former denim sandblasters: a 4-year follow-up study. Chest. 2015;148:647–654. doi: 10.1378/chest.14-2848. - DOI - PMC - PubMed
    1. Akgun M. Denim production and silicosis. Curr. Opin. Pulm. Med. 2016;22:165–169. doi: 10.1097/MCP.0000000000000249. - DOI - PubMed
    1. Barmania S. Deadly denim: sandblasting-induced silicosis in the jeans industry. Lancet Respir. Med. 2016;4:543. doi: 10.1016/S2213-2600(16)30102-3. - DOI - PubMed

Publication types