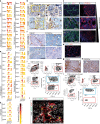
Spatially and functionally distinct subclasses of breast cancer-associated fibroblasts revealed by single cell RNA sequencing
- PMID: 30514914
- PMCID: PMC6279758
- DOI: 10.1038/s41467-018-07582-3
Spatially and functionally distinct subclasses of breast cancer-associated fibroblasts revealed by single cell RNA sequencing
Abstract
Cancer-associated fibroblasts (CAFs) are a major constituent of the tumor microenvironment, although their origin and roles in shaping disease initiation, progression and treatment response remain unclear due to significant heterogeneity. Here, following a negative selection strategy combined with single-cell RNA sequencing of 768 transcriptomes of mesenchymal cells from a genetically engineered mouse model of breast cancer, we define three distinct subpopulations of CAFs. Validation at the transcriptional and protein level in several experimental models of cancer and human tumors reveal spatial separation of the CAF subclasses attributable to different origins, including the peri-vascular niche, the mammary fat pad and the transformed epithelium. Gene profiles for each CAF subtype correlate to distinctive functional programs and hold independent prognostic capability in clinical cohorts by association to metastatic disease. In conclusion, the improved resolution of the widely defined CAF population opens the possibility for biomarker-driven development of drugs for precision targeting of CAFs.
Conflict of interest statement
The authors declare no competing interests.
Figures


Similar articles
-
Cancer-associated fibroblast-derived gene signature discriminates distinct prognoses by integrated single-cell and bulk RNA-seq analyses in breast cancer.Aging (Albany NY). 2024 May 9;16(9):8279-8305. doi: 10.18632/aging.205817. Epub 2024 May 9. Aging (Albany NY). 2024. PMID: 38728370 Free PMC article.
-
Gene expression profile of normal and cancer-associated fibroblasts according to intratumoral inflammatory cells phenotype from breast cancer tissue.Mol Carcinog. 2016 Nov;55(11):1489-1502. doi: 10.1002/mc.22403. Epub 2015 Sep 9. Mol Carcinog. 2016. PMID: 26349857
-
Functional heterogeneity of cancer-associated fibroblasts from human colon tumors shows specific prognostic gene expression signature.Clin Cancer Res. 2013 Nov 1;19(21):5914-26. doi: 10.1158/1078-0432.CCR-13-0694. Epub 2013 Sep 19. Clin Cancer Res. 2013. PMID: 24052018
-
Prognostic relevance of cancer-associated fibroblasts in human cancer.Semin Cancer Biol. 2014 Apr;25:61-8. doi: 10.1016/j.semcancer.2014.02.006. Epub 2014 Feb 19. Semin Cancer Biol. 2014. PMID: 24560651 Review.
-
Cellular plasticity in the breast cancer ecosystem.Ups J Med Sci. 2024 Apr 2;129. doi: 10.48101/ujms.v129.10629. eCollection 2024. Ups J Med Sci. 2024. PMID: 38571887 Free PMC article. Review.
Cited by
-
Integrated analysis of single-cell RNA-seq and bulk RNA-seq unravels the heterogeneity of cancer-associated fibroblasts in TNBC.Aging (Albany NY). 2023 Nov 13;15(21):12674-12697. doi: 10.18632/aging.205205. Epub 2023 Nov 13. Aging (Albany NY). 2023. PMID: 37963845 Free PMC article.
-
Cancer-Associated Fibroblast Heterogeneity in Malignancy with Focus on Oral Squamous Cell Carcinoma.Int J Mol Sci. 2024 Jan 21;25(2):1300. doi: 10.3390/ijms25021300. Int J Mol Sci. 2024. PMID: 38279300 Free PMC article. Review.
-
Identification of extracellular matrix proteins secreted by human dermal fibroblasts cultured in 3D electrospun scaffolds.Sci Rep. 2021 Mar 23;11(1):6655. doi: 10.1038/s41598-021-85742-0. Sci Rep. 2021. PMID: 33758206 Free PMC article.
-
Activated fibroblasts in cancer: Perspectives and challenges.Cancer Cell. 2023 Mar 13;41(3):434-449. doi: 10.1016/j.ccell.2023.02.015. Cancer Cell. 2023. PMID: 36917949 Free PMC article. Review.
-
Mapping Breast Cancer Microenvironment Through Single-Cell Omics.Front Immunol. 2022 Apr 20;13:868813. doi: 10.3389/fimmu.2022.868813. eCollection 2022. Front Immunol. 2022. PMID: 35514975 Free PMC article. Review.
References
Publication types
MeSH terms
Substances
LinkOut - more resources
Full Text Sources
Medical
Molecular Biology Databases

