. 2018 Dec 18;115(51):E11951-E11960.
doi: 10.1073/pnas.1809349115. Epub 2018 Dec 3.

Microbiome interactions shape host fitness

Affiliations

Microbiome interactions shape host fitness

Alison L Gould et al. Proc Natl Acad Sci U S A. .

Abstract

Gut bacteria can affect key aspects of host fitness, such as development, fecundity, and lifespan, while the host, in turn, shapes the gut microbiome. However, it is unclear to what extent individual species versus community interactions within the microbiome are linked to host fitness. Here, we combinatorially dissect the natural microbiome of Drosophila melanogaster and reveal that interactions between bacteria shape host fitness through life history tradeoffs. Empirically, we made germ-free flies colonized with each possible combination of the five core species of fly gut bacteria. We measured the resulting bacterial community abundances and fly fitness traits, including development, reproduction, and lifespan. The fly gut promoted bacterial diversity, which, in turn, accelerated development, reproduction, and aging: Flies that reproduced more died sooner. From these measurements, we calculated the impact of bacterial interactions on fly fitness by adapting the mathematics of genetic epistasis to the microbiome. Development and fecundity converged with higher diversity, suggesting minimal dependence on interactions. However, host lifespan and microbiome abundances were highly dependent on interactions between bacterial species. Higher-order interactions (involving three, four, and five species) occurred in 13-44% of possible cases depending on the trait, with the same interactions affecting multiple traits, a reflection of the life history tradeoff. Overall, we found these interactions were frequently context-dependent and often had the same magnitude as individual species themselves, indicating that the interactions can be as important as the individual species in gut microbiomes.

Keywords: Drosophila; fitness landscape; higher-order interactions; life history tradeoffs; microbiome.


Conflict of interest statement

Conflict of interest statement: W.B.L. cofounded uBiome, Inc. and owns stock in the company.

Figures

Fig. 1.
Fig. 1.
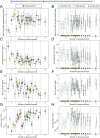
Microbiome induces a life history tradeoff between lifespan and reproduction. (A) Experimental design. The multicolor pies indicate which species are present in a given combination, along with the corresponding binary code. Each species abbreviation (Lp, Lb, Ap, At, and Ao) is indicated above its corresponding locus in the binary string. Both notations, colored pies and binary codes, are used consistently throughout the paper. The color code is included redundantly in the figures to aid the reader. (B) Single bacterial associations decrease the fly lifespan. (B, Inset) Microbiome diversity decreases the fly lifespan. Error bars show SEM. (C) In agreement with prior reports, higher total fecundity is associated with a shorter lifespan. This tradeoff is apparent for average daily fecundity, as well as for total fecundity per female. SEMs are provided in SI Appendix, Table S1. (D) Fitness calculations using a Leslie matrix reveal roughly constant fitness across different microbiomes. Error bars are SE of the estimate. (E) Lifespan/fecundity tradeoff can be broken by putting flies on antibiotics after their peak reproduction (red circles represent gnotobiotic flies treated with antibiotics; Materials and Methods) after 21 d, which encompasses the natural peak fecundity (SI Appendix, Fig. S5). Note the shifts in lifespan between the regular treatment, the antibiotic treatment, and the late-life bacterial inoculation treatment. The lifespan was significantly extended, whereas total fecundity stayed high. Shifting germ-free (GF) flies to gnotobiotic treatment after 21 d posteclosion decreased the lifespan without increasing reproduction (blue circles represent GF flies made gnotobiotic 21 d posteclosion) (n = 100 flies per treatment for the standard and antibiotic-treated experiments and n = 60 flies per treatment for the GF switched to gnotobiotic experiment). Error bars show SEM.
Fig. 2.
Fig. 2.
Microbiome interactions impact host lifespan and bacterial load. Mean fecundity per female per day was measured concomitantly with development time and adult survival over the flies’ lifespans. (A) Variation in fecundity decreases as gut diversity increases. Median (n = 65) vials measured per bacterial treatment. (B) As described in SI Appendix, Math Supplement, section 9, daily fecundity in multispecies bacterial combinations can be predicted by averaging either the corresponding phenotypes of the single-species associations or the corresponding phenotypes of the pairwise species associations. Error in the predictions (averaging prediction minus measured trait value) is displayed. Single-species averaging predictions are shown in gray, and species pair averaging predictions are shown in black. Error bars are 95% confidence intervals (SI Appendix, Math Supplement, section 9). (C) Number of days to adulthood was measured as the first pupa to emerge from an individual fly vial during the lifespan experiment. Median (n = 24) per bacterial treatment (SI Appendix, Fig. S2). (D) Averaging models as in B applied to development data. (E) Lifespan decreases as gut diversity increases. Median (n = 100) flies per bacterial treatment. (F) Averaging models as in B applied to lifespan data. (G) Mean bacterial load averaged over 48 replicates per combination. (H) Averaging models as in B applied to bacterial load. Error bars for all plots are 95% confidence intervals. Colored pies on the x axis of B, D, F, and H indicate bacteria combinations and are consistently ordered with A, C, E, and G.
Fig. 3.
Fig. 3.
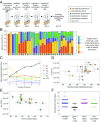
Microbiome abundances correlate with some host physiology traits. (A) Gnotobiotic flies were associated with defined bacterial flora for 10 d before washing, crushing, and CFU enumeration. (B) Mean microbiome load (log10 scale) and relative abundances of the different species (linear scale) for all 32 possible combinations of the five species (n = 24 replicate flies from two independent biological replicates were measured per combination). (C) Total bacterial load increases as the number of species increases, but Lb abundance drops. Mean abundances were calculated from B as a function of the number of species present (complete data are provided in SI Appendix, Fig. S6). The black line indicates mean total bacterial load per fly computed over all combinations with the given number of species. (D) Lp abundance (from B) correlates with increased female fly fecundity (from Fig. 1C). (E) Ao abundance (from B) correlates with decreased fly lifespan (from Fig. 1C). (F) Development time from embryo to adult is accelerated by live bacteria. The development assay from Fig. 2B was repeated with variation in food preparation and source of embryos. The term “standard” indicates data from the fitness experiment in Fig. 2B; “germ-free” indicates embryos from germ-free females placed directly on fresh food inoculated with defined bacteria; and “heat-killed” and “non–heat-killed” indicate vials from the fitness experiment cleared of flies and either seeded directly with germ-free embryos (non–heat-killed) or placed at 60 °C for 1 h and checked for sterility (heat-killed) before being seeded with germ-free embryos. The number below the x axis indicates the number of replicate vials assessed. Complete bacterial combinations and individual replicates of F are provided in SI Appendix, Fig. S10. All error bars show SEM.
Fig. 4.
Fig. 4.
Microbiome interactions change host physiology. (A) Coded bacterial combinations correspond to the vertices the 5D cube. For daily fecundity (B), development (C), lifespan (D), and bacterial load (E), we calculated interactions for standard tests (pink dots) and contextual tests (blue dots) using means and propagated SEs for all phenotype traits (SI Appendix, Table S1). The P values of all standard and contextual tests were pooled and adjusted for multiple comparisons using the Benjamini–Hochberg method (dark fill color, significant; open circles, nonsignificant). Standard tests with species identities are provided in SI Appendix, Fig. S12.
Fig. 5.
Fig. 5.
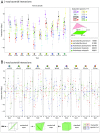
Interactions between bacteria that impact the fly lifespan depend on the context of bystander species. (A) For the fly lifespan trait, the pairwise interaction was calculated between each pair of species for each set of possible bystander species. For each test (e.g., 11***), the 1’s indicate the species for which the interaction test is calculated and the asterisks indicate the possible bystander species. The binary code (e.g., 101) in the legend indicates which of the three possible bystanders is present. For instance, 000 indicates no bystanders and is shown by a black square. Note that the interactions change depending on the bystanders present. (B) For the fly lifespan trait, the four different three-way interactions were calculated with each possible set of bystander species. Interactions between sets of three species [equations: g = square, i = circle, k = triangle, m = ex (x), n = *, u111 = diamond; SI Appendix, Math Supplement, sections 5 and 6] are compared to determine (i) whether the context of other species changes interactions and (ii) whether additive contextual tests can describe cases of nonadditive standard tests. Each of the 10 combinations of three species (denoted in panel titles as k, l, and m) is compared, along with the four variants of bystander species (denoted in the panel titles as * and shown by the different colored symbols). The differences between the colors for a given interaction test indicate that bystanders change interactions. Error bars indicate propagated SEM.
Fig. 6.
Fig. 6.
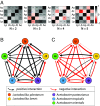
Microbiome interactions stabilize diversity in the fly gut. (A) Pairwise correlations in abundance for the five species of bacteria in fly guts with totals of two, three, four, and five species present. More positive correlations are apparent at low diversity, whereas more negative correlations occur as diversity increases (P = 0.03; SI Appendix, Math Supplement, section 10.4). Direct calculation of interaction strength (34) at low (B, one to two species) and high (C, four to five species) diversity based on CFU abundance data (Fig. 3B and SI Appendix, Fig. S6) revealed asymmetrical interactions that decrease in strength at higher diversity (SI Appendix, Math Supplement, section 10.1 and Fig. S15). Consistent with the correlations in A, more negative interactions occur in more diverse guts.

Similar articles

Cited by

References

    1. Steinfeld HM. 1927. Length of life of Drosophila melanogaster under aseptic conditions. PhD dissertation, pp 1–47.
    1. Clark RI, et al. Distinct shifts in microbiota composition during Drosophila aging impair intestinal function and drive mortality. Cell Rep. 2015;12:1656–1667. - PMC - PubMed
    1. Smith P, et al. Regulation of life span by the gut microbiota in the short-lived African turquoise killifish. eLife. 2017;6:e27014. - PMC - PubMed
    1. Travers LM, Garcia-Gonzalez F, Simmons LW. Live fast die young life history in females: Evolutionary trade-off between early life mating and lifespan in female Drosophila melanogaster. Sci Rep. 2015;5:15469. - PMC - PubMed
    1. Roff DA, Fairbairn DJ. The evolution of trade-offs: Where are we? J Evol Biol. 2007;20:433–447. - PubMed

Publication types

MeSH terms

LinkOut - more resources