. 2018 Nov 30;9(1):5083.
doi: 10.1038/s41467-018-07497-z.

ROBO2 is a stroma suppressor gene in the pancreas and acts via TGF-β signalling

Affiliations

ROBO2 is a stroma suppressor gene in the pancreas and acts via TGF-β signalling

Andreia V Pinho et al. Nat Commun. .

Abstract

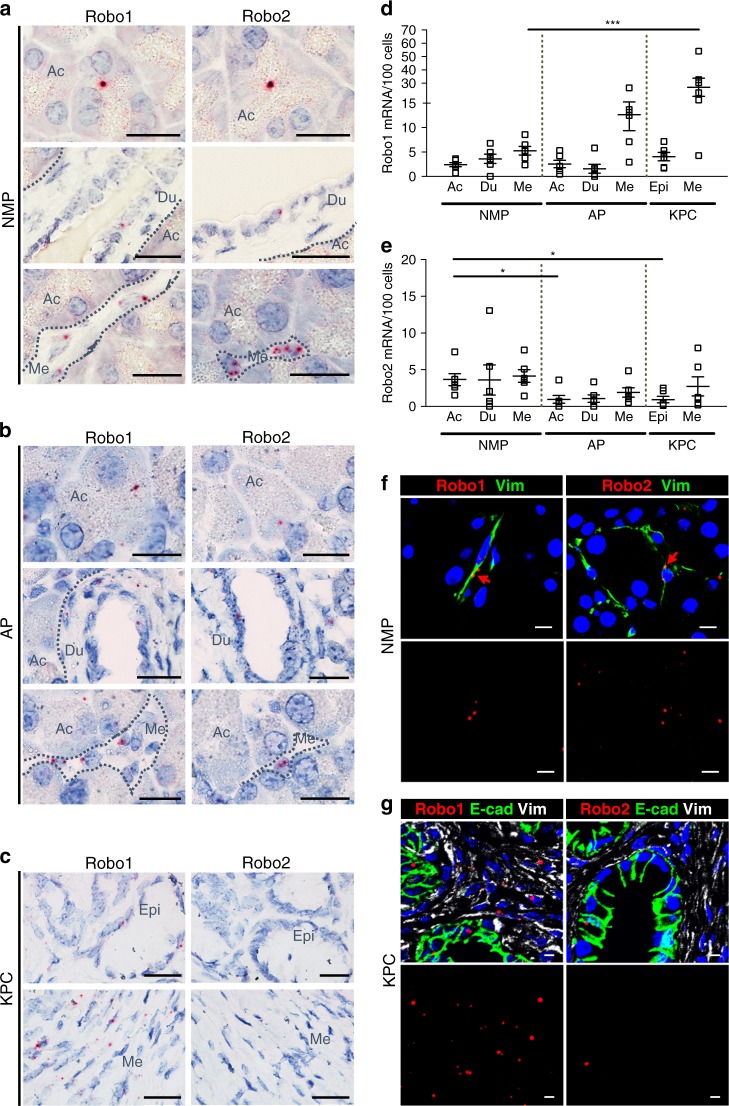
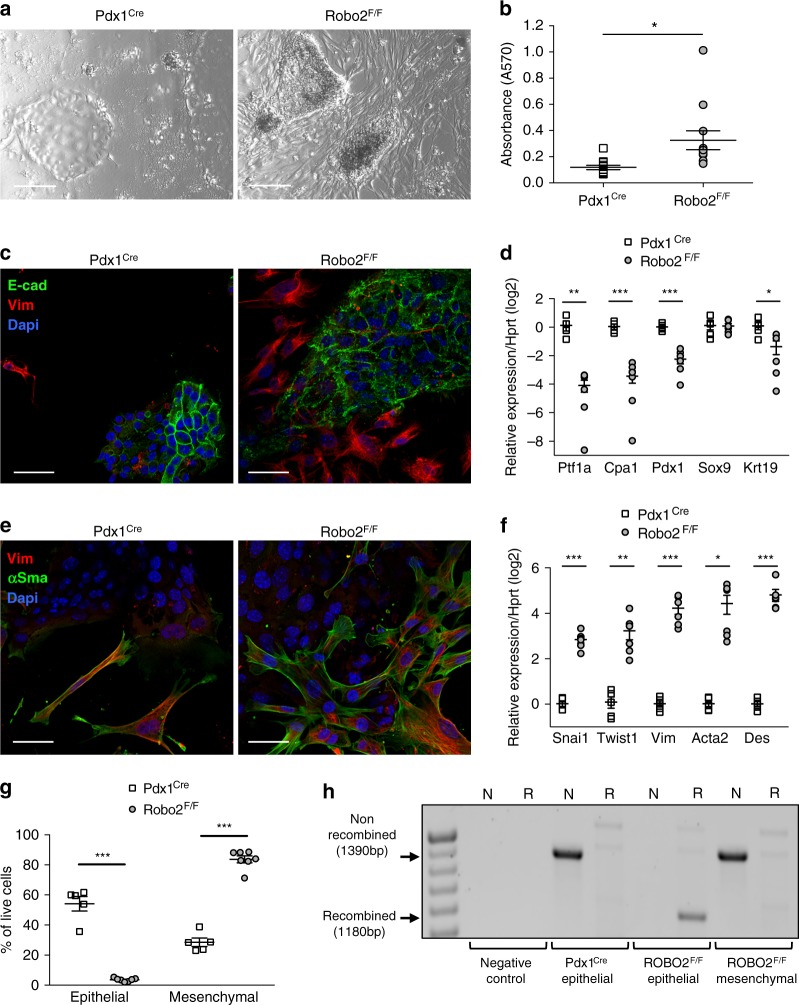
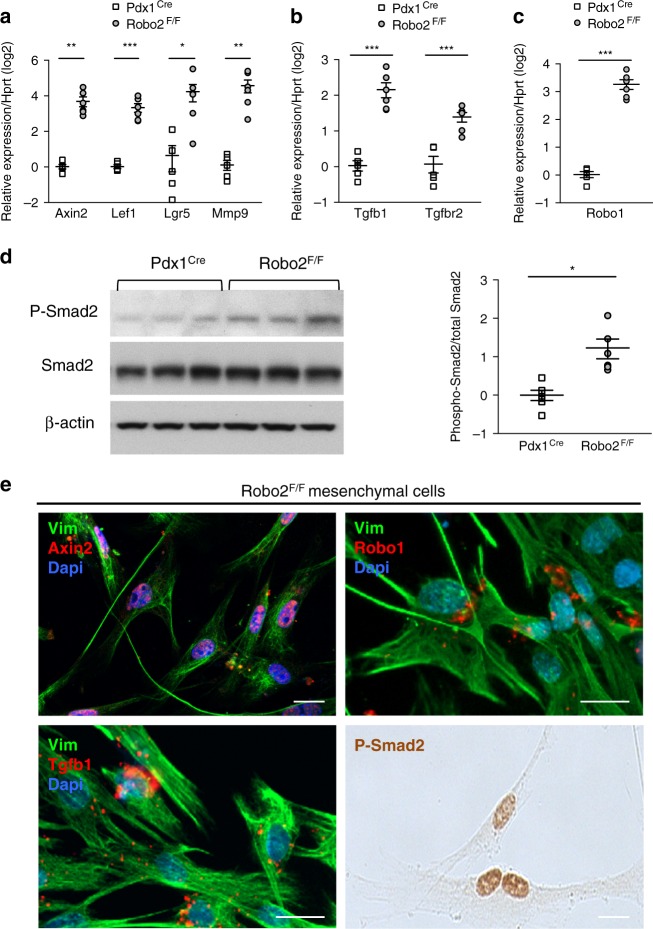
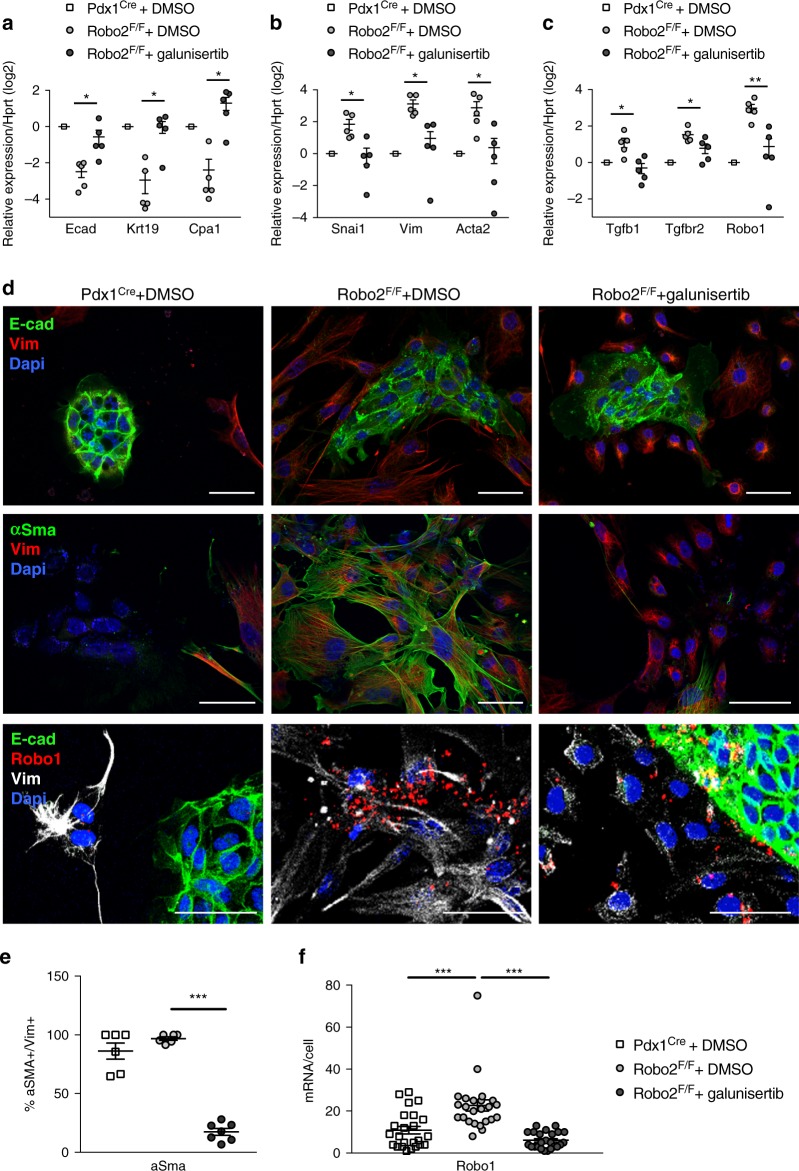
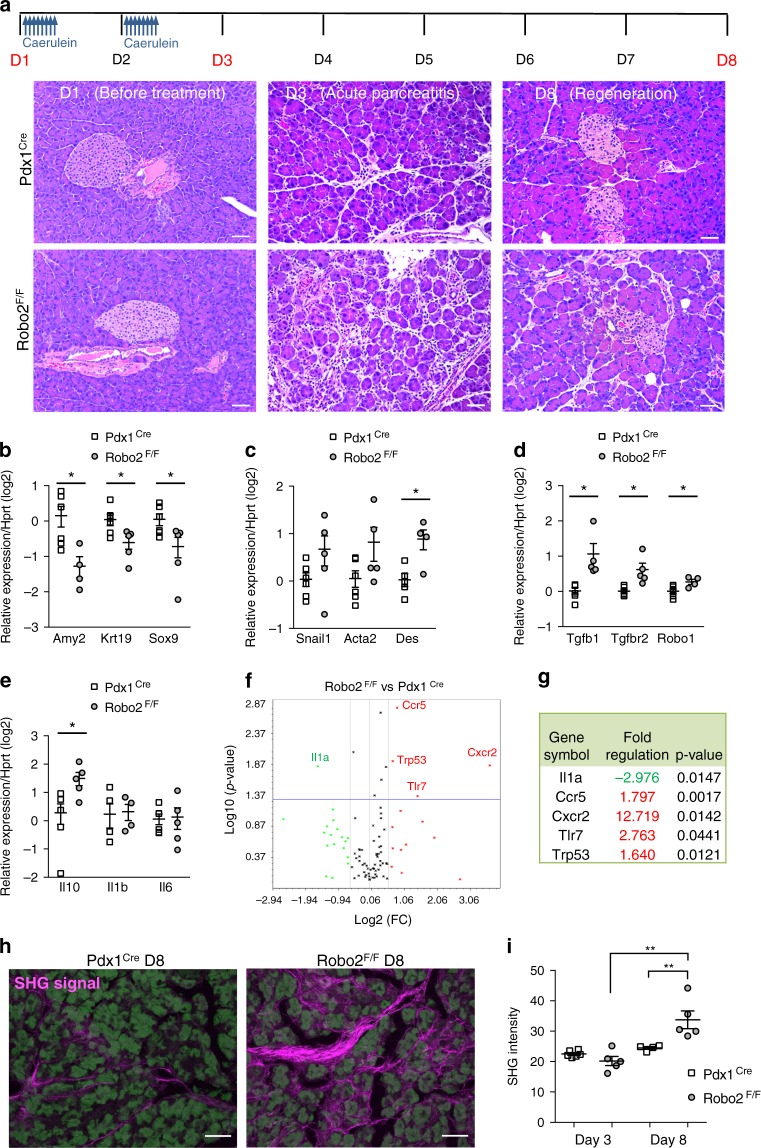
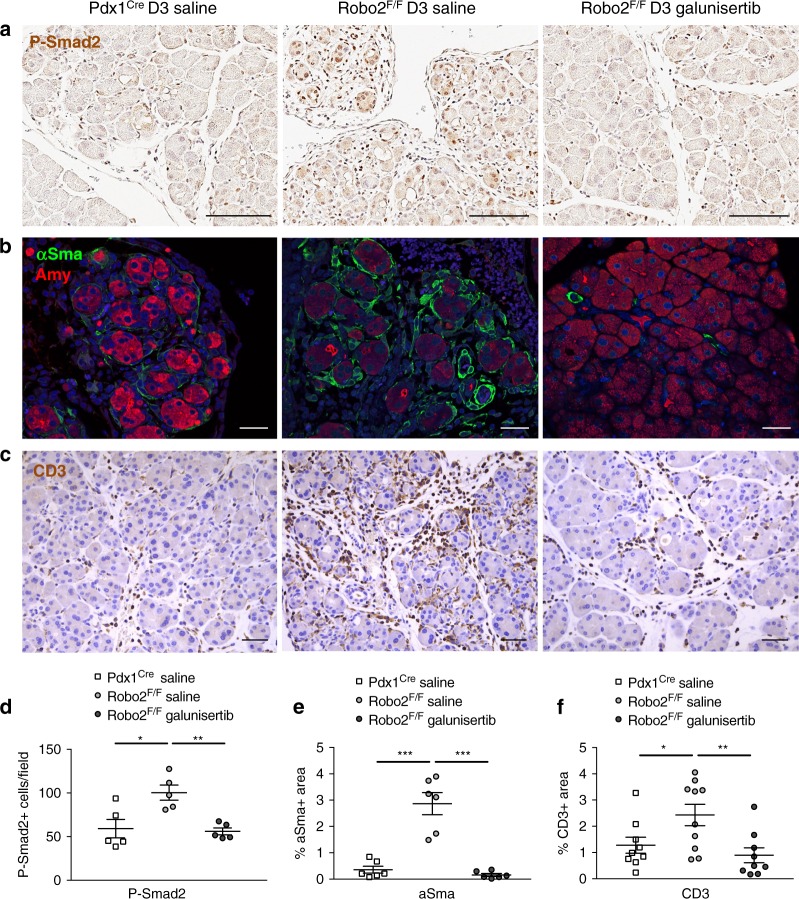
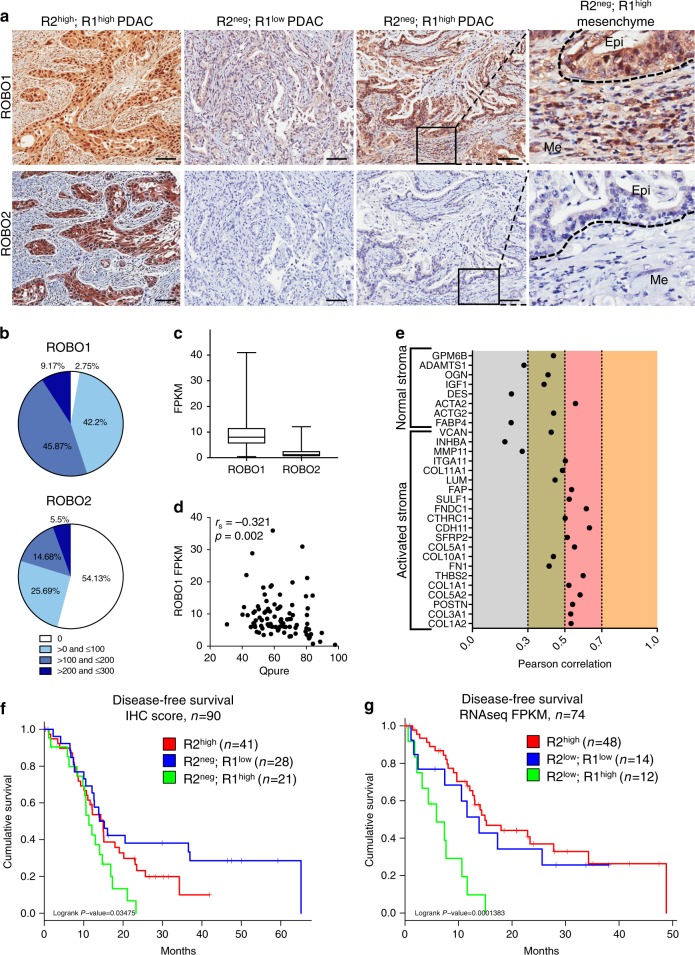
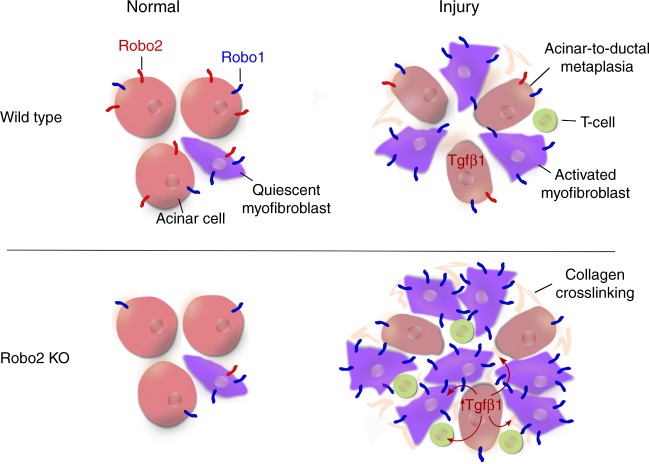
Whereas genomic aberrations in the SLIT-ROBO pathway are frequent in pancreatic ductal adenocarcinoma (PDAC), their function in the pancreas is unclear. Here we report that in pancreatitis and PDAC mouse models, epithelial Robo2 expression is lost while Robo1 expression becomes most prominent in the stroma. Cell cultures of mice with loss of epithelial Robo2 (Pdx1Cre;Robo2F/F) show increased activation of Robo1+ myofibroblasts and induction of TGF-β and Wnt pathways. During pancreatitis, Pdx1Cre;Robo2F/F mice present enhanced myofibroblast activation, collagen crosslinking, T-cell infiltration and tumorigenic immune markers. The TGF-β inhibitor galunisertib suppresses these effects. In PDAC patients, ROBO2 expression is overall low while ROBO1 is variably expressed in epithelium and high in stroma. ROBO2low;ROBO1high patients present the poorest survival. In conclusion, Robo2 acts non-autonomously as a stroma suppressor gene by restraining myofibroblast activation and T-cell infiltration. ROBO1/2 expression in PDAC patients may guide therapy with TGF-β inhibitors or other stroma /immune modulating agents.


Conflict of interest statement

The authors declare no competing interests.

Figures

Fig. 1
Fig. 1
Cell-type-specific changes in Robo1/2 expression in pancreatitis and PDAC. ac Robo1 and Robo2 mRNA expression analysed by RNA in situ hybridization (RISH) in a normal mouse pancreas (NMP), b acute pancreatitis (AP) and c PDAC samples from KrasG12D; Trp53R172H; Pdx1Cre (KPC) animals. Note that dot intensity is not related to the amount of mRNA copies. Dotted lines delineate histological compartments (acini, Ac; ducts, Du; tumour epithelium, Epi; mesenchymal cells, Me). Images are representative of six independent experiments. Scale bars correspond to 20 µm. d Quantification of Robo1 RISH in tissue sections of NMP, AP and PDAC. Data presented as mean + /− SEM; N = 6. Statistical analysis was performed using an unpaired t test with Welsh’s correction; ***P < 0.001. e Quantification of Robo2 RISH in tissue sections of NMP, AP and PDAC. Data presented as mean + /− SEM; N = 6. Statistical analysis was performed using an unpaired t test with Welsh’s correction; *P < 0.05. f RISH— immunofluorescence multiplexing of Robo1 and Robo2 with the epithelial marker E-cad and the mesenchymal marker Vim in NMP. Red arrows indicate Robo1+ and Robo2+ signal. Nuclei are stained with DAPI. Images are representative of six independent experiments. Scale bars correspond to 20 µm. Confocal pictures were acquired using 20x magnification with zoom 3.5. g RISH—immunofluorescence multiplexing of Robo1 or Robo2 with the epithelial marker E-cadherin (E-cad) and the mesenchymal marker vimentin (Vim) in PDAC (KPC model). Nuclei are stained with DAPI. Images are representative of three independent experiments. Scale bars correspond to 20 µm. Confocal pictures were acquired using 20x magnification with zoom 2.0
Fig. 2
Fig. 2
Increased myofibroblasts in cell cultures from Robo2F/F pancreas. a Representative images of Pdx1Cre and Robo2F/F primary pancreatic exocrine cultures at day 8 (D8) of culture. Scale bars correspond to 200 µm. b Quantification of sulphorhodamine B staining as a measurement of cell attachment at 48 h of culture. c Immunofluorescence staining of the mesenchymal marker Vim and the epithelial marker E-cad in D8 primary pancreatic cultures of Pdx1Cre and Robo2F/F animals. Images are representative of five independent experiments. Nuclei are stained with DAPI. Confocal images were acquired using 40x magnification. Scale bars correspond to 50 µm. d mRNA expression of pancreatic epithelial markers analysed by RT-qPCR in D8 primary pancreatic cultures of Pdx1Cre and Robo2F/F animals. e Immunofluorescence staining of the mesenchymal markers Vim and αSma in D8 primary pancreatic cultures of Pdx1Cre and Robo2F/F animals. Images are representative of five independent experiments. Nuclei are stained with DAPI. Confocal images were acquired using 40x magnification. Scale bars correspond to 50 µm. f mRNA expression of mesenchymal and stellate cell markers analysed by RT-qPCR in D8 primary pancreatic cultures of Pdx1Cre and Robo2F/F animals. All qPCR data are referred to housekeeping gene Hprt. g Quantification of FACS-sorted epithelial (EpCAM+, Cd31 and Cd140a) and mesenchymal (Cd140a+, Cd31 and EpCAM) cell populations in D8 primary pancreatic cultures of Pdx1Cre and Robo2F/F animals. h Analysis of Cre-mediated recombination of the Robo2 allele by PCR using 10 ng of genomic DNA from FACS-sorted D8 primary pancreatic cultures of Pdx1Cre and Robo2F/F animals. Arrows indicate the non-recombined (1390 bp) and recombined (1180 bp) amplicons. N or R indicates which primer pair was used. N for Robo2 wild-type allele primer pair, R for Robo2 knockout allele primer pair. All data presented as mean + /− SEM; N ≥ 5. Statistical analysis was performed using unpaired t test with Welch’s correction; *P < 0.05, **P < 0.01, ***P < 0.001
Fig. 3
Fig. 3
Activation of Wnt and TGF-β pathway in cell cultures from Robo2F/F pancreas. a, b, c mRNA expression of Wnt targets (a), Tgfb1, Tgfbr2 (b) and Robo1 (c) analysed by RT-qPCR in D8 primary pancreatic cultures of Pdx1Cre and Robo2F/F animals. All qPCR data are referred to housekeeping gene Hprt. d Western blot (WB) analysis of phospho-Smad2 in D8 cultures and quantification of WB band density using ImageJ. e Representative images of mesenchymal cells, identified by Vim, in D8 Robo2F/F cultures stained with immunofluorescence/RISH for Axin2, Tgfb1, Robo1 or phospho-Smad2. Nuclei in immunofluorescence images are stained with DAPI. Images are representative of three to four independent experiments. Scale bars correspond to 20 µm. All data presented as mean + /− SEM; N = 4–6. Statistical analysis was performed using unpaired t test with Welch’s correction; *P < 0.05, **P < 0.01, ***P < 0.001
Fig. 4
Fig. 4
Myofibroblasts activation in Robo2F/F cell cultures depends on TGF-β. ac mRNA expression of epithelial (a) and mesenchymal (b) markers and TGF-β pathway genes (c) in D8 primary pancreatic cultures, treated with galunisertib or DMSO vehicle. All data referred to Hprt and presented as mean + /− SEM, N = 5. Statistical analysis was performed using unpaired t test with Welch’s correction; *P < 0.05, **P < 0.01. d Immunofluorescence staining and RISH for Robo1 with epithelial marker E-cad and the mesenchymal markers Vim and/or αSma in D8 pancreatic cultures treated with galunisertib or DMSO vehicle. Nuclei are stained with DAPI and confocal images were acquired using 40x magnification. Images are representative of three to five independent experiments. Scale bars correspond to 50 µm. e Quantification of the percentage of activated myofibroblasts (αSma+; Vim+) in total Vim+ mesenchymal cells in D8 primary pancreatic cultures, treated with galunisertib or DMSO vehicle. f Quantification of Robo1 mRNA by RISH per mesenchymal cell in D8 primary pancreatic cultures, treated with galunisertib or DMSO vehicle. Data presented as mean + /− SEM; data from N ≥ 3 mice per group. Statistical analysis was performed using unpaired t test with Welsh’s correction; ***P < 0.001
Fig. 5
Fig. 5
Activation of stromal and immune cells during pancreatitis in Robo2F/F mice. a Acute pancreatitis (AP) was induced in Pdx1Cre and Robo2F/F animals by intraperitoneal administration of caerulein during 2 consecutive days and pancreata were analysed 3 days (D3) and 8 days (D8) after initiation of treatment. Haematoxylin and eosin (H&E) staining of pancreas sections at D3 and D8 of AP. Scale bars correspond to 50 µm. Images are representative of five to six independent experiments. be mRNA expression of epithelial (b), mesenchymal (c), TGF-β pathway genes (d) and immune (e) markers at D3 AP in Pdx1Cre and Robo2F/F animals. All qPCR data are referred to housekeeping gene Hprt. Data presented as mean + /− SEM; N = 4–6. Statistical analysis was performed using unpaired t test with Welch’s correction, *P < 0.05. f Volcano plot representing gene expression of immune markers in total pancreas of Pdx1Cre and Robo2F/F animals at D3 AP, analysed using the RT2 Profiler PCR array Mouse Cancer Inflammation & Immunity Crosstalk (Qiagen). g List of genes with differential expression between Pdx1Cre and Robo2F/F animals at D3 AP (fold change > 1.5 and p < 0.05). h Representative maximum projections of second-harmonic generation (SHG) signal (purple) derived from pancreata sections at D8 of AP. Autofluorescence of pancreatic tissue is represented in green. Scale bars correspond to 50 µm. i Quantification of second-harmonic generation (SHG) signal intensity to determine collagen crosslinking. Data presented as mean + /− SEM; N = 4–6. Statistical analysis was performed using one-way ANOVA with Turkey’s multiple comparisons test, **P < 0.01
Fig. 6
Fig. 6
TGF-β inhibition suppresses myofibroblast activation and T-cell infiltration. Caerulein-treated animals were simultaneously treated with TGF-β inhibitor galunisertib or saline control by oral gavage. a Immunohistochemistry staining of phospho-Smad2 in D3 AP pancreas sections. Nuclei are counterstained with haematoxylin. Images are representative of five independent experiments. Scale bars correspond to 100 µm. b Immunofluorescence for the myofibroblast marker αSma and the exocrine marker amylase in D3 AP pancreas sections. Images are representative of five independent experiments. Nuclei are stained with DAPI. Scale bars correspond to 50 µm. c Immunohistochemistry staining of the T-cell marker CD3 in D3 AP pancreas sections. Images are representative of five independent experiments. Nuclei are counterstained with haematoxylin. Scale bars correspond to 50 µm. d Manual quantification of phospho-Smad2+ cells/field. e Quantification of αSma+ area/field, using ImageJ. f Quantification of CD3+ area/field, using ImageJ. All images were acquired using 20x magnification. Data presented as mean + /− SEM; N ≥ 5; statistical analysis was performed using an unpaired t test with Welch’s correction, *P < 0.05, **P < 0.01, ***P < 0.001
Fig. 7
Fig. 7
ROBO1 determines the prognosis of ROBO2-negative PDAC patients. a Representative images of ROBO1 and ROBO2 immunohistochemistry (IHC) in PDAC samples from the APGI cohort. Images were acquired using Aperio ImageScope software at a magnification of 20 × . Scale bars correspond to 50 µm. Dotted lines delineate histological compartments (tumour epithelium, Epi, mesenchymal cells, Me). b Graphical representation of ROBO1 and ROBO2 IHC scores in the APGI patient cohort (n = 109). c Variation in RNA expression for ROBO1 and 2 within the APGI cohort, analysed by RNAseq and represented as FPKM (RNAseq data previously published by Bailey et al.) (centre line of the box corresponds to mean value, whiskers are the upper and lower limit). d Inverse correlation between ROBO1 RNA expression (FPKM) and tumour cellularity analysed using QPure. e Correlation between ROBO1 RNA expression (microarray gene expression analysis previously published by Biankin et al.) and markers of normal and activated stroma, as described by Moffitt et al. f Kaplan–Meier survival curve with a log-rank statistical test for combined protein expression of ROBO1 and ROBO2, analysed by immunohistochemistry (n = 90). g Kaplan–Meier survival curve with a log-rank statistical test for combined RNA expression of ROBO1 and ROBO2, analysed by RNAseq (n = 74)
Fig. 8
Fig. 8
ROBO2 is a stroma suppressor gene in the pancreas and acts via TGF-β. A schematic representation of the key findings in this study. After injury, either by cell culture or acute pancreatitis induction, loss of Robo2 in pancreatic epithelial cells leads to non-autonomous activation of pancreatic myofibroblasts and increased T-cell infiltration, dependent on activation of the TGF-β signalling pathway

Comment in

Similar articles

Cited by

References

    1. Rahib L, et al. Projecting cancer incidence and deaths to 2030: the unexpected burden of thyroid, liver, and pancreas cancers in the United States. Cancer Res. 2014;74:2913–2921. doi: 10.1158/0008-5472.CAN-14-0155. - DOI - PubMed
    1. Pinho AV, Chantrill L, Rooman I. Chronic pancreatitis: a path to pancreatic cancer. Cancer Lett. 2014;345:203–209. doi: 10.1016/j.canlet.2013.08.015. - DOI - PubMed
    1. Storz P. Acinar cell plasticity and development of pancreatic ductal adenocarcinoma. Nat. Rev. Gastroenterol. Hepatol. 2017;14:296–304. doi: 10.1038/nrgastro.2017.12. - DOI - PMC - PubMed
    1. Blockus H, Chedotal A. Slit-Robo signalling. Development. 2016;143:3037–3044. doi: 10.1242/dev.132829. - DOI - PubMed
    1. Biankin AV, et al. Pancreatic cancer genomes reveal aberrations in axon guidance pathway genes. Nature. 2012;491:399–405. doi: 10.1038/nature11547. - DOI - PMC - PubMed

Publication types

MeSH terms