. 2018 Dec;24(12):1887-1898.
doi: 10.1038/s41591-018-0241-1. Epub 2018 Nov 26.

ONECUT2 is a targetable master regulator of lethal prostate cancer that suppresses the androgen axis

Affiliations

ONECUT2 is a targetable master regulator of lethal prostate cancer that suppresses the androgen axis

Mirja Rotinen et al. Nat Med. 2018 Dec.

Abstract

Treatment of prostate cancer (PC) by androgen suppression promotes the emergence of aggressive variants that are androgen receptor (AR) independent. Here we identify the transcription factor ONECUT2 (OC2) as a master regulator of AR networks in metastatic castration-resistant prostate cancer (mCRPC). OC2 acts as a survival factor in mCRPC models, suppresses the AR transcriptional program by direct regulation of AR target genes and the AR licensing factor FOXA1, and activates genes associated with neural differentiation and progression to lethal disease. OC2 appears active in a substantial subset of human prostate adenocarcinoma and neuroendocrine tumors. Inhibition of OC2 by a newly identified small molecule suppresses metastasis in mice. These findings suggest that OC2 displaces AR-dependent growth and survival mechanisms in many cases where AR remains expressed, but where its activity is bypassed. OC2 is also a potential drug target in the metastatic phase of aggressive PC.


Conflict of interest statement

COMPETING FINANCIAL INTERESTS

CSMC has pending patent applications PCT/US2017/034768 (Freeman/Rotinen/Murali/You) and US62/548,879 (Freeman/Rotinen/Murali/You) relevant to this study.

Figures
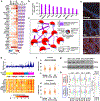
Figure 1.
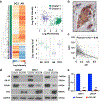
Figure 1.. OC2 is predicted to be active in mCRPC
(a) Up-regulated TFs in mCRPC in the DISC cohort. The heatmap displays TF expression level in 5 disease categories. GS = Gleason sum score. Purple bars represent normalized enrichment score (NES), a statistical measure of TF activity. (Benign N=794, GS<7 N=328, GS=7 N=530, GS>7 N=203, mCRPC N=260). (b) Ranking of the 10 most active TFs (from Fig. 1a) in mCRPC from the DISC cohort. (c) A network model describing activity and association of highly active TFs in mCRPC. TFs are identified as nodes. Node size = activity. Node color = proportion of patients where the TF is up- or down-regulated, or unchanged. Edges = degree of interaction. Edge thickness = concordance in RNA expression. (d) The bar plot (top) displays summary of TF activation across disease categories. The heatmap (bottom) shows activation of individual TFs across disease categories. (e and f) Representative images and quantitation of OC2 expression (red) in benign (N=79), Gleason Grade 3 (G3, N=82) and Gleason Grade 4 (G4, N=66) PC tissues. Tissue sections are stained using a fluorescent antibody detection system and nuclei visualized with DAPI (blue). Scale bar 40μm. The boxes show the 25th-75th percentile range and the center line is the median. Whiskers show 1.5 times the inter-quartile range (IQR) from the 25th or 75th percentile values. P values obtained from Wilcoxon two-tailed rank-sum test. (g) Immunoblot showing endogenous OC2 levels in prostate cell lines. Representative blots from two independent experiments. Full-length blots are presented in Supplementary Fig. 8. (h) Inferred activity of OC2 in PCS1–3 subtypes plotted by disease category. Upper and lower panels show inducible and repressive activity of OC2, respectively. Right panel shows overall OC2 activity in GS>7 and mCRPC tumors. Red= PCS1, green=PCS2, blue=PCS3. The boxes show the 25th-75th percentile range and the center mark is the median. Whiskers show 1.5 times IQR from the 25th or 75th percentile values. Data points beyond the whiskers are displayed using dots. (GS<7 & PCS1, N=28; GS<7 & PCS2, N=158; GS<7 & PCS3, N=142; GS=7 & PCS1, N=98; GS=7 & PCS2, N=201; GS=7 & PCS3, N=231; GS>7 & PCS1, N=79; GS>7 & PCS2, N=52; GS>7 & PCS3, N=72; mCRPC & PCS1, N=172; mCRPC & PCS2, N=17; mCRPC & PCS3, N=71; GS>7 or mCRPC & PCS1, N=251; GS>7 or mCRPC & PCS2, N=69; GS>7 or mCRPC & PCS3, N=143).
Figure 2.
Figure 2.. Inverse relationship between OC2 and AR nuclear localization in radical prostatectomy specimens
(a) Multiplex IF staining with anti-OC2 and anti-AR antibodies in 6 cases of high-grade PC. Heatmap and dendrogram of nuclear staining intensities of AR and OC2, using the Euclidean distance and complete linkage method in an unsupervised cluster analysis, identifies two cell populations: AR high/OC2 low and AR low/OC2 high. Scatter plot of individual nuclei separated by intensity levels of AR and OC2. Cluster 1 (C1, green) represents high AR/low OC2 cells (N=1,109) and cluster 2 (C2, purple) represents low AR/high OC2 cells (N=199). Boxplots of intensity levels of nuclear AR and OC2 in C1 (left) or C2 (right). The boxes show the 25th-75th percentile range and the center line is the median. Whiskers show 1.5 times the IQR from the 25th or 75th percentile values. Left boxplot: P=2.1×10−191, right boxplot: P=2.3×10−66, Wilcoxon two-tailed rank-sum test. (b) Representative IHC image of OC2 and AR in high-grade PC. OC2=red, AR=brown. Scale bar 20μm. (c) Scatter plot of AR and OC2 nuclear intensity from 35 TMA cores of high-grade PC. Each dot represents one nucleus (N=1,373). Pearson’s method, P=4.8×10−64. (d) AR and FOXA1 protein in PC cell lines after enforced expression of OC2. Representative blots from two independent experiments. Full-length blots are presented in Supplementary Fig. 8. (e) PSA mRNA expression after enforced expression of OC2. The mean + S.E.M. from three to four independent experiments is shown. Unpaired two-tailed Student´s t-test, for 22Rv1 ★★P=8.73×10⁻⁸; for LNCaP ★★P=1.11×10⁻⁹.
Figure 3.
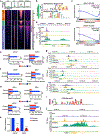
Figure 3.. OC2 suppresses the AR transcriptional program
(a) The normalized ChIP-seq signal across merged OC2 replicates (N=2 biologically independent experiments), and individual samples of AR, H3K27ac and H3K4me1 in the peak set representing AR-enriched regions, OC2-enriched regions, and co-bound regions is shown. The number of peaks represented in each heatmap are: OC2-enriched regions (4,927 peaks), co-bound regions (2,151 peaks), and AR-enriched regions (10,726 peaks). The upper panel represents the average ChIP signal across each peak set. (b) Top binding motifs in OC2-specific peaks. (c) GSEA plot of an androgen response hallmark signature showing negative enrichment of AR target genes in 22Rv1 (upper panel) and LNCaP (lower panel) cells with enforced OC2 expression. Three independent microarray experiments were performed per condition. (d) OC2 and AR binding to the PSA/KLK3 core enhancer (AREIII). (e and f) PSA mRNA levels (e) and PSA enhancer luciferase reporter activity (f) in LNCaP and 22Rv1 cells with enforced OC2 expression, treated for 24h with 10nM DHT or vehicle. (g) OC2 and AR binding at the promoters of BASP1, EGFR and NAT1. (h) BASP1, EGFR and NAT1 mRNA levels in 22Rv1 and/or LNCaP cells with enforced OC2 expression, treated for 24h with 10nM DHT or vehicle. (i) FOX-like motif recognized uniquely in OC2-AR shared regions. (j) OC2 binding to FOXA1. (k) FOXA1 mRNA levels after enforced expression of OC2. For (d), (g) and (j) the browser views are representative of the results obtained in two biologically independent ChIP-seq experiments. For (e), (f), (h) and (k) the mean + S.E.M. from three to four independent experiments is shown. Unpaired two-tailed Student´s t-test. In (e) for LNCaP ★★P=0.003 and for 22Rv1 ★★P=0.002; in (f) for LNCaP ★★P= 1.32×10⁻⁵ and for 22Rv1 ★★P= 7.93×10⁻⁵; in (h) for BASP ★★P= 2.23×10⁻⁵, for NAT1 ★★P=1.40×10⁻⁵, for EGFR in LNCaP P=0.02 and for EGFR in 22Rv1 ★★P=0.0006; in (k), for LNCaP ★★P=6.65×10⁻⁵ and for 22Rv1 ★★P= 4.37×10⁻⁶.
Figure 4.
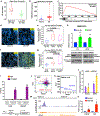
Figure 4.. OC2 activates a lethal transcriptional program
(a) NE activation score in mCRPC tumors with high (N=65) and low (N=65) OC2 expression (top and bottom quartiles) from the DISC cohort. The boxes show the 25th-75th percentile range and the center line is the median. Whiskers show 1.5 times the IQR from the 25th or 75th percentile values. Data points beyond the whiskers are displayed using dots. Wilcoxon two-tailed rank-sum test, P=4.6×10⁻⁵. (b) Violin plot of OC2 gene expression in a CRPC cohort from Beltran et al.. Wilcoxon two-tailed rank-sum test was performed to compare NE tumors (N=15) and adenocarcinoma (Adeno, N=34). Distribution of OC2 expression shown by kernel density. The horizontal line within the violin represents the median. Wilcoxon two-tailed rank-sum test, P=2.6×10⁻⁶. (c) The enrichment plot depicts sample-wise enrichment of the set of cancer cell lines (N=1,063) in the CCLE with NE or neural properties, sorted by OC2 expression. (d and e) Representative images and quantitation of OC2 expression in mCRPC specimens annotated for AR and synaptophysin (SYP) expression status. IF detection of OC2 (gold) and cytokeratin (blue). AR-positive/SYP-negative (AR+/SYP-) N=15, AR/SYP-N=6 and AR-/SYP+ N=13. Scale bar 20μm. (f and g) Representative images and quantitation of OC2 expression in LuCaP human PC xenografts annotated for SYP expression and castration resistance (CR): SYP-N=20, SYP+ N=13 and SYP+/CR+ N=5. Scale bar 20μm. For (e) and (g) the ratio of nuclear OC2 to cytoplasmic OC2 is shown on the Y-axis and cytoplasm was defined by a cytokeratin mask. The boxes show the 25th-75th percentile range and the center line is the median. Whiskers show 1.5 times the IQR from the 25th or 75th percentile values. (h) OC2 mRNA levels in C4–2 and LNCaP cell lines after depletion of REST. The mean + S.E.M. from three to four independent experiments is shown. Unpaired two-tailed Student´s t-test, for C4–2★★P=0.002; for LNCaP ★★P=0.001. (i) REST binding to the OC2 promoter. Data show mean + S.D. from triplicates. Results are representative of two independent experiments. (j) Correlation of OC2 and REST expression levels in the DISC cohort. No significant correlation was observed in benign (green, N=673) and primary (blue, N=1,061) tumors, while mCRPC tumors (red, N=260) show significant inverse correlation between OC2 and REST. Colored lines represent regression lines of the respective data points. Pearson’s method, P=0.001. (k) Inverse relationship of OC2 and REST expression, from Beltran et al.. Regression line in blue. Pearson’s method, P=2.9×10−36. (l) OC2 and PEG10 mRNA expression with NE transdifferentiation in the LTL331 model. (Adeno N=4, NEPC N=2). Unpaired two-tailed Student´s t-test followed by Storey’s FDR correction method, FDR=0.031, ★★ FDR=0.005. (m) Genome browser view of endogenous OC2 binding to the PEG10 promoter in 22Rv1 cells. The result shown is representative of the two biologically independent ChIP-seq experiments performed. (n) PEG10 mRNA expression after enforced expression of OC2. The mean + S.E.M. from three to four independent experiments is shown. Unpaired two-tailed Student´s t-test, LNCaPP=0.012, C4–2 P=0.029.
Figure 5.
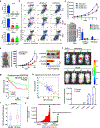
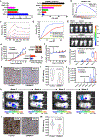
Figure 5.. OC2 promotes mCRPC tumor growth and metastasis
(a) Cell survival 4 days after start of OC2 depletion. The mean + S.D. from three independent experiments is shown. Unpaired two-tailed Student´s t-test, C4–2: sh1★★P= 7.58×10⁻⁵, sh2★★P= 7.48×10⁻⁵; LNCaP: sh1★★P=1.57×10⁻⁶, sh2★★P=2.03×10⁻⁶, 22Rv1: sh1★★P=5.42×10⁻⁶, sh2★★P= 0.0002. (b) OC2 depletion results in cell death 4 days after infection, measured by flow cytometry and double staining with Annexin V-FITC and propidium iodide (PI). These experiments were repeated independently three times with similar results. (c) Growth in cell culture of 22Rv1 cells after OC2 depletion. The mean +/− S.D. from three independent experiments is shown. Unpaired two-tailed Student´s t-test, sh1★★ P=0.0006, sh2★★P=0.0009. (d) Growth in soft agar of 22Rv1 cells after OC2 depletion. The mean + S.D. from triplicates is shown. The result shown is representative of two independent experiments. (e) Subcutaneous 22Rv1 tumor growth after OC2 depletion (left). Appearance of tumors after 31 d (top right). Tumor volume (middle) and weight (bottom right) are shown as mean + S.D. (N=10 per mice group). Unpaired two-tailed Student´s t-test, tumor volume ★★P=0.005, tumor weight ★★P=0.0002. (f) Effect of OC2 silencing on 22Rv1 metastasis following intracardiac injection. Bioluminescence images of mice bearing metastatic tumors 5 weeks after injection (top) and graphical representation of normalized bioluminescence signals of tumor development (bottom). N=9 mice per group. The boxes show the 25th-75th percentile range and the center line is the median. Whiskers include the smallest and largest values. Wilcoxon two-tailed rank-sum test, in week 3 ★★P= 0.023, in week 4 ★★P= 0.009, in week 5 ★★P=0.0017. (g) Association of BCR-free survival with OC2 expression. High (N=46) and low (N=45). Cox proportional hazard regression, two-sided test, P=0.002. (h) Inverse correlation between OC2 activation and AR activation based upon mRNA expression in tumor foci of diagnostic prostate needle biopsies (N=99). Spearman’s rank correlation test, P=3.7×10−57. (i) Ratio of OC2 activation to AR activation in diagnostic prostate needle biopsies (M0-MN (N=23) and M1-Poly (N=52)). M1-Poly = patients with concurrent polymetastases (>5 bone or extrapelvic lymph node metastases and/or visceral metastases) at the time of diagnostic biopsy. M0-NM = high-grade prostate tumor biopsies from patients that remained locally confined (no metastatic progression) with average follow-up of 56 months. The boxes show the 25th-75th percentile range and the center line is the median. Whiskers show 1.5 times the IQR from the 25th or 75th percentile values. Data points beyond the whiskers are displayed using dots. Wilcoxon two-tailed rank-sum test, P=0.043. (j) Expression of OC2 mRNA in benign and high risk primary prostate tumors from Wyatt et al.. NHT= neo-adjuvant hormone therapy.
Figure 6.
Figure 6.. Inhibition of OC2 with a small molecule
(a) Relative OC2 mRNA levels in 6 prostate cell lines determined by RT-qPCR (left). ACTB and GAPDH expression levels were used for normalization. Data show mean + S.D. from triplicates. Results are representative of two independent experiments. The IC50 values for compound CSRM617 shown are the mean from two independent experiments (right). (b) Enrichment plot of OC2 target genes perturbed by 10μM CSRM617 at 16 h in 22Rv1 cells. ADE = Absolute differential expression (N=3 independent microarray experiments). (c) Dose-dependent binding of CSRM617 (1.56μM to 100μM) to OC2-HOX is shown in blue. 2:2 Langmuir model simulation used to derive kinetic parameters of the bimolecular interactions shown in orange. (d) SPR competition assay showing compound CSRM617 (100μM) inhibiting OC2-HOX binding to DNA at two different concentrations protein 250nM (blue) and 125nM (red). For (c) and (d) these experiments were repeated independently three times with similar results. (e) 22Rv1 cells were implanted subcutaneously. When tumors reached 200mm3, mice were randomized and received vehicle or 50 mg/Kg CSRM617 daily (Control N=11 tumors, CSRM617 N=14). Appearance of tumors after 20 d (top right). Tumor volume (left) and tumor weight (bottom right) are shown as mean + S.E.M. (Unpaired two-tailed Student´s t-test, tumor volume 1stP=0.02, 2ndP=0.037, tumor weight P=0.011). (f) CSRM617 treatment did not affect animal weight (mice from (Fig. 6e)). Mean ± S.D. is shown (N=8 mice per group). (g) 22Rv1-luciferase labeled cells were injected intracardially; two days after injection mice were randomized (N=7 per group) to receive vehicle or 50 mg/Kg CSRM617 daily. Bioluminescence images (BLI) of mice bearing metastatic tumors 3 w after the injection (top) and graphical representation of normalized BLI signals, weeks 1–4 (bottom). The boxes show the 25th-75th percentile range and the center line is the median. Whiskers include the smallest and largest values. Friedman’s two-tailed test, P=0.0003. (h and i) Representative PEG10 IHC staining and quantification in adrenal metastases from the experiment in Fig. 6g. Scale bar 50μm. Control (N=10 microscope fields) and CSRM617 (N=9). Kernel density estimation shows the distribution of PEG10 staining. The open circle indicates the median. The thick and thin vertical grey lines represent the IQR and 95% confidence interval, respectively. Wilcoxon two-tailed rank-sum test, P=0.004. (j) 22Rv1-luciferase labeled cells were injected intracardially. Once metastases were established, mice were randomized (N=11 per group) to receive vehicle or 50 mg/Kg CSRM617 daily. Graphical representation of normalized BLI signals of mice bearing metastatic tumors 6 weeks after the injection. The boxes show the 25th-75th percentile range and the center line is the median. Whiskers include the smallest and largest values. Two-way ANOVA (P=0.0038), followed by post-hoc Dunnett’s test at week 6 (P=0.0158). (k) Representative result from (Fig. 6j) showing one control and one treated subject with CSRM617 in weeks 3 to 6. (l and m) Representative PEG10 IHC staining and quantification in adrenal metastases from the experiment in Fig. 6j. Scale bar 50μm. Control (N=10 microscope fields) and CSRM617 (N=15). Kernel density estimation shows the distribution of PEG10 staining. The open circle indicates the median. The thick and thin vertical grey lines represent the IQR and 95% confidence interval, respectively. Wilcoxon two-tailed rank-sum test, P=9×10⁻⁵.

Comment in

Similar articles

Cited by

References

    1. Beltran H, et al. Aggressive variants of castration-resistant prostate cancer. Clin Cancer Res 20, 2846–2850 (2014). - PMC - PubMed
    1. Gundem G, et al. The evolutionary history of lethal metastatic prostate cancer. Nature 520, 353–357 (2015). - PMC - PubMed
    1. Chang KH, et al. Dihydrotestosterone synthesis bypasses testosterone to drive castration-resistant prostate cancer. Proc Natl Acad Sci U S A 108, 13728–13733 (2011). - PMC - PubMed
    1. Sharma NL, et al. The androgen receptor induces a distinct transcriptional program in castration-resistant prostate cancer in man. Cancer Cell 23, 35–47 (2013). - PubMed
    1. Kumar A, et al. Substantial interindividual and limited intraindividual genomic diversity among tumors from men with metastatic prostate cancer. Nat Med 22, 369–378 (2016). - PMC - PubMed

METHODS-ONLY REFERENCES

    1. Bolstad BM, Irizarry RA, Astrand M & Speed TP A comparison of normalization methods for high density oligonucleotide array data based on variance and bias. Bioinformatics 19, 185–193 (2003). - PubMed
    1. Hwang D, et al. A data integration methodology for systems biology. Proc Natl Acad Sci U S A 102, 17296–17301 (2005). - PMC - PubMed
    1. Storey JD & Tibshirani R Statistical significance for genomewide studies. Proc Natl Acad Sci U S A 100, 9440–9445 (2003). - PMC - PubMed
    1. Kharchenko PV, Tolstorukov MY & Park PJ Design and analysis of ChIP-seq experiments for DNA-binding proteins. Nat Biotechnol 26, 1351–1359 (2008). - PMC - PubMed
    1. Li H & Durbin R Fast and accurate short read alignment with Burrows-Wheeler transform. Bioinformatics 25, 1754–1760 (2009). - PMC - PubMed

Publication types

MeSH terms