. 2018 Dec 13;175(7):1842-1855.e16.
doi: 10.1016/j.cell.2018.10.042. Epub 2018 Nov 15.

Transcription Factors Activate Genes through the Phase-Separation Capacity of Their Activation Domains

Affiliations

Transcription Factors Activate Genes through the Phase-Separation Capacity of Their Activation Domains

Ann Boija et al. Cell. .

Abstract

Gene expression is controlled by transcription factors (TFs) that consist of DNA-binding domains (DBDs) and activation domains (ADs). The DBDs have been well characterized, but little is known about the mechanisms by which ADs effect gene activation. Here, we report that diverse ADs form phase-separated condensates with the Mediator coactivator. For the OCT4 and GCN4 TFs, we show that the ability to form phase-separated droplets with Mediator in vitro and the ability to activate genes in vivo are dependent on the same amino acid residues. For the estrogen receptor (ER), a ligand-dependent activator, we show that estrogen enhances phase separation with Mediator, again linking phase separation with gene activation. These results suggest that diverse TFs can interact with Mediator through the phase-separating capacity of their ADs and that formation of condensates with Mediator is involved in gene activation.

Keywords: activation domain; gene activation; mediator; phase separation; transcription; transcription factor.


Figures

Figure 1.
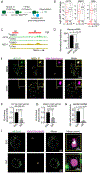
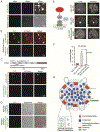
Figure 1.. OCT4 and Mediator occupy super-enhancers in vivo.
ChIP-seq tracks of OCT4 and MED1 in ESCs at SEs (left column) and OCT4 IF with concurrent RNA-FISH demonstrating occupancy of OCT4 at Esrrb, Nanog, Trim28 and Mir290. Hoechst staining was used to determine the nuclear periphery, highlighted with a blue line. The two rightmost columns show average RNA FISH signal and average OCT4 IF signal centered on the RNA-FISH focus from at least 11 images. Average OCT4 IF signal at random randomly selected nuclear position is displayed in S1.
Figure 2.
Figure 2.. MED1 condensates are dependent on OCT4 binding in vivo.
A. Schematic of OCT4 degradation. The C-terminus of OCT4 is endogenously biallelically tagged with the FKBP protein; when exposed to the small molecule dTag, OCT4 is ubiquitylated and rapidly degraded. B. Box plot representation of log2 fold change in OCT4 and MED1 ChIP-seq reads and RNA-seq reads of Super-enhancer (SE)- or Typical enhancer (TE)- driven genes, in ESCs carrying the OCT4 FKBP tag, treated with DMSO or dTAG for 24 hours. C. Genome browser view of OCT4 (green) and MED1 (yellow) ChIP-seq data at the Nanog locus. The Nanog SE (red) show a 90% reduction of OCT4 and MED1 binding after OCT4 degradation. D. Normalized RNA-seq read counts of Nanog mRNA show a 60% reduction upon OCT4 degradation. E. Confocal microscopy images OCT4 and MED1 IF with DNA FISH to the Nanog locus in ESCs carrying the OCT4 FKBP tag, treated with DMSO or dTAG. Inset represent a zoomed in view of the yellow box. The Merge view displays all three channels (OCT4 IF, MED1 IF and Nanog DNA FISH) together. F. OCT4 ChIP-qPCR to the Mir290 SE in ESCs and differentiated cells (Diff). Presented as enrichment over control, relative to signal in ESCs. Error bars represents standard error of the mean from two biological replicates. G. MED1 ChIP-qPCR to the Mir290 SE in ESCs and differentiated cells (Diff). Presented as enrichment over control, relative to signal in ESCs. Error bars represents the SEM from two biological replicates. H. Normalized RNA-seq read counts of Mir290 miRNA in ESCs or differentiated cells (Diff). Error bars represents the SEM from two biological replicates. I. Confocal microscopy images of MED1 IF and DNA FISH to the Mir290 genomic locus in ESCs and differentiated cells. Merge (zoom) represent a zoomed in view of the yellow box in the merged channel.
Figure 3.
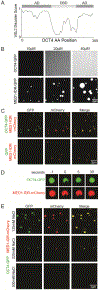
Figure 3.. OCT4 forms liquid droplets with MED1 in vitro.
A. Graph of intrinsic disorder of OCT4 as calculated by the VSL2 algorithm (www.pondr.com). The DNA binding domain (DBD) and activation domains (ADs) are indicated above the disorder score graph (Brehm et al., 1997). B. Representative images of droplet formation of OCT4-GFP (top row) and MED1-IDR-GFP (bottom row) at the indicated concentration in droplet formation buffer with 125mM NaCl and 10% PEG-8000. C. Representative images of droplet formation of MED1-IDR-mCherry mixed with GFP or OCT4-GFP at 10uM each in droplet formation buffer with 125mM NaCl and 10% PEG-8000. D. FRAP of heterotypic droplets of OCT4-GFP and MED1-IDR-mCherry. Confocal images were taken at indicated time points relative to photobleaching (0). E. Representative images of droplet formation of 10uM MED1-IDR-mCherry and OCT4-GFP in droplet formation buffer with varying concentrations of salt and 10% PEG-8000.
Figure 4.
Figure 4.. OCT4 phase separation with MED1 is dependent on specific interactions.
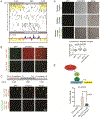
A. Amino acid enrichment analysis ordered by frequency of amino acid in the ADs (upper panel). Net charge per amino acid residue analysis of OCT4 (lower panel). B. Representative images of droplet formation showing that Poly-E peptides are incorporated into MED1-IDR droplets. MED1-GFP and a TMR labeled proline or glutamic acid decapeptide (Poly-P and Poly-E respectively) were added to droplet formation buffers at 10uM each with 125mM NaCl and 10% PEG-8000. C. (Upper panel) Schematic of OCT4 protein, horizontal lines in the AD mark acidic D residues (blue) and acidic E residues (red). All 17 acidic residues in the N-AD and 6 acidic residues in the C-AD were mutated to alanine to generate an OCT4-acidic mutant. (Lower panel) Representative confocal images of droplet formation showing that the OCT4 acidic mutant has an attenuated ability to concentrate into MED1-IDR droplets. 10uM of MED1-IDR-mCherry and OCT4-GFP or OCT4-acidic mutant-GFP were added to droplet formation buffers with 125mM NaCl and 10% PEG-8000. D. (Upper panel) Representative images of droplet formation showing that OCT4 but not the OCT4 acidic mutant is incorporated into Mediator complex droplets. Purified Mediator complex was mixed with 10uM GFP, OCT4-GFP or OCT4-acidic mutant-GFP in droplet formation buffers with 140mM NaCl and 10% PEG-8000. (Lower panel) Enrichment ratio of GFP, OCT4-GFP or OCT4-acidic mutant-GFP in Mediator complex droplets. N>20, error bars represent the distribution between the 10th and 90th percentiles. E. (Top panel) GAL4 activation assay schematic. The GAL4 luciferase reporter plasmid was transfected into mouse ES cells with an expression vector for the GAL4-DBD fusion protein. (Bottom panel) The AD activity was measured by luciferase activity of mouse ES cells transfected with GAL4-DBD, GAL-OCT4-CAD or GAL-OCT4-CAD-acidic mutant.
Figure 5.
Figure 5.. Multiple TFs phase separate with Mediator droplets.
A. (Left graph) Percent disorder of various protein classes (x axis) plotted against the cumulative fraction of disordered proteins of that class (y axis). (Right graph) Disorder content of transcription factor (TF) DNA-binding domains (DBD) and putative activation domains (ADs). B. Representative images of droplet formation assaying homotypic droplet formation of indicated TFs. Recombinant MYC-GFP (12uM), p53-GFP (40uM), NANOG-GFP (10uM), SOX2-GFP (40uM), RARa-GFP (40uM), GATA-2-GFP (40uM), and ER-GFP (40uM) was added to droplet formation buffers with 125mM NaCl and 10% PEG-8000. C. Representative images of droplet formation showing that all tested TFs were incorporated into MED1-IDR droplets. 10uM of MED1-IDRmCherry and 10uM of either MYC-GFP, p53-GFP, NANOG-GFP, SOX2-GFP, RARa-GFP, GATA-2-GFP, or ER-GFP was added to droplet formation buffers with 125mM NaCl and 10% PEG-8000.
Fig. 6.
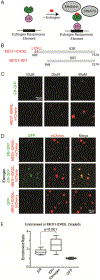
Fig. 6.. Estrogen stimulates phase separation of the Estrogen Receptor with MED1.
A. Schematic of estrogen stimulated gene activation. Estrogen facilitates the interaction of ER with Mediator and RNAPII by binding the ligand binding domain (LBD) of ER, which exposes a binding pocket for LXXLL motifs within the MED1-IDR. B. Schematic view of the MED1-IDRXL, and MED1-IDR used for recombinant protein production. C. Representative images of droplet formation, assaying homotypic droplet formation of ER-GFP and MED1-IDRXL-mCherry. Performed with the indicated protein concentration in droplet formation buffers with 125mM NaCl and 10% PEG-8000. D. Representative confocal images of droplet formation showing that ER is incorporated into MED1-IDRXL droplets and the addition of estrogen considerably enhanced heterotypic droplet formation. ER-GFP, ER-GFP in the presence of estrogen, or GFP is mixed with MED1-IDRXL. 10uM of each indicated protein was added to droplet formation buffers with 125mM NaCl and 10% PEG-8000. E. Enrichment ratio in MED1-IDRXL droplets of ER-GFP, ER-GFP in the presence of estrogen, or GFP. N>20, error bars represent the distribution between the 10th and 90th percentiles.
Fig 7.
Fig 7.. TF-Coactivator phase separation is dependent on residues required for transactivation.
A. Representative confocal images of droplet formation of GCN4-GFP or MED15-mCherry were added to droplet formation buffers with 125mM NaCl and 10% PEG-8000. B. Representative images of droplet formation showing that GCN4 forms droplets with MED15. GCN4-GFP and mCherry or GCN4-GFP and MED15-mCherry were added to droplet formation buffers at 10uM with 125mM NaCl and 10% PEG-8000 and imaged on a fluorescent microscope with the indicated filters. C. (Top row) Schematic of GCN4 protein composed of an activation domain (AD) and DNA-binding domain (DBD). Aromatic residues in the hydrophobic patches of the AD are marked by blue lines. All 11 aromatic residues in the hydrophobic patches were mutated to alanine (A) to generate an GCN4-aromatic mutant. (Bottom row) Representative images of droplet formation showing that the ability of GCN4 aromatic mutant to form droplets with MED15 is attenuated. GCN4-GFP or GCN4-Aromatic-mutant-GFP and MED15-mCherry were added to droplet formation at 10uM each with 125mM NaCl and 10% PEG-8000. D. (Upper panel) Representative images of droplet formation showing that GCN4 wild type but not GCN4 aromatic mutant are incorporated into Mediator complex droplets. 10uM of GCN4-GFP or GCN4-Aromatic-mutant-GFP was mixed with purified Mediator complex in droplet formation buffer with 125mM NaCl and 10% PEG-8000. E. (Left panel) Schematic of the Lac assay. A U2OS cell bearing 50,000 repeats of the Lac operon is transfected with a Lac binding domain-CFP-AD fusion protein. (Right panel) IF of MED1 in Lac-U2OS cells transfected with the indicated Lac binding protein construct. F. GAL4 activation assay. Transcriptional output as measured by luciferase activity in 293T cells, of the indicated activation domain fused to the GAL4 DBD. G. Model showing transcription factors and coactivators forming phase-separated condensates at super-enhancers to drive gene activation. In this model, transcriptional condensates incorporate both dynamic and structured interactions.

Comment in

Similar articles

Cited by

References

    1. Alberti S (2017). The wisdom of crowds: regulating cell function through condensed states of living matter. J. Cell Sci. 130, 2789–2796. - PubMed
    1. Allen BL, and Taatjes DJ (2015). The Mediator complex: a central integrator of transcription. Nat. Rev. Mol. Cell Biol. 16, 155–166. - PMC - PubMed
    1. Andersson MK, Stahlberg A, Arvidsson Y, Olofsson A, Semb H, Stenman G, Nilsson O, and Aman P (2008). The multifunctional FUS, EWS and TAF15 protooncoproteins show cell type-specific expression patterns and involvement in cell spreading and stress response. BMC Cell Biol 9, 37. - PMC - PubMed
    1. Apostolou E, Ferrari F, Walsh RM, Bar-Nur O, Stadtfeld M, Cheloufi S, Stuart AT, Polo JM, Ohsumi TK, Borowsky ML, et al. (2013). Genome-wide chromatin interactions of the Nanog locus in pluripotency, differentiation, and reprogramming. Cell Stem Cell 12, 699–712. - PMC - PubMed
    1. Arany Z, Newsome D, Oldread E, Livingston DM, and Eckner R (1995). A family of transcriptional adaptor proteins targeted by the E1A oncoprotein. Nature 374, 81–84. - PubMed

Publication types

MeSH terms

Substances