. 2019 Jan;29(1):54-66.
doi: 10.1038/s41422-018-0104-9. Epub 2018 Nov 13.

Plant HP1 protein ADCP1 links multivalent H3K9 methylation readout to heterochromatin formation

Affiliations

Plant HP1 protein ADCP1 links multivalent H3K9 methylation readout to heterochromatin formation

Shuai Zhao et al. Cell Res. 2019 Jan.

Abstract

Heterochromatin Protein 1 (HP1) recognizes histone H3 lysine 9 methylation (H3K9me) through its conserved chromodomain and maintains heterochromatin from fission yeast to mammals. However, in Arabidopsis, Like Heterochromatin Protein 1 (LHP1) recognizes and colocalizes genome-wide with H3K27me3, and is the functional homolog of Polycomb protein. This raises the question whether genuine HP1 homologs exist in plants. Here, we report on the discovery of ADCP1, a plant-specific triple tandem Agenet protein, as a multivalent H3K9me reader in Arabidopsis, and establish that ADCP1 is essential for heterochromatin formation and transposon silencing through modulating H3K9 and DNA methylation levels. Structural studies revealed the molecular basis underlying H3K9me-specific recognition by tandem Agenet of ADCP1. Similar to human HP1α and fly HP1a, ADCP1 mediates heterochromatin phase separation. Our results demonstrate that despite its distinct domain compositions, ADCP1 convergently evolves as an HP1-equivalent protein in plants to regulate heterochromatin formation.


Conflict of interest statement

The authors declare no competing interests.

Figures

Fig. 1
Fig. 1
The domain architecture and binding property of ADCP1. a Surface plasmon resonance imaging profiling of “Royal family” proteins binding to H3K9me2 peptide. 200 s-500 s was the association phase; 500 s-800 s was the dissociation phase. b The domain architecture of ADCP1. c The ITC fitting curves of H3(1-15)K9me1/2/3 peptides titrated to three tandem Agenet domains of ADCP1. d The ITC fitting curves of histone peptides methylated at different sites titrated to three tandem Agenet domains of ADCP1. e The ITC fitting curves of phosphorylated histone peptides titrated to three tandem Agenet domains of ADCP1
Fig. 2
Fig. 2
The structural basis of ADCP1 recognizing H3K9me2 modification. a The overall structure of ADCP1-Agenet 3/4 domain in complex with H3(1-15)K9me2 peptide. b The electrostatic surface view of ADCP1-Agenet 3/4 domain in complex with H3(1-15)K9me2 peptide. c The binding details of H3(1-15)K9me2 peptide to ADCP1-Agenet 3/4 domain. d The binding pocket of H3K9me1/2 modification in ADCP1-Agenet domains. e The ITC fitting curves of H3(1-15)K9me2 peptide to wild type and mutant Agenet domains of ADCP1. N.D., Not Detected
Fig. 3
Fig. 3
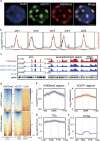
ADCP1 is directly associated with the H3K9me2 heterochromatin. a Immunostaining of interphase nuclei with pADCP1:ADCP1: GFP transgenic plants. Colors indicated the DNA counterstained with DAPI (blue), ADCP1-GFP (green), and H3K9me2 (red). Bar = 2μm. b Distribution of ADCP1 (black) and H3K9me2 (red) in the 5 Arabidopsis chromosomes. The gray boxes indicate the pericentromeric region of each chromosome. The left y axis means log2 ratio of ADCP1-GFP ChIP-seq signals to Col-0 and the right y axis means log2 ratio of H3K9me2 to H3 ChIP-seq signals in Col-0. The data were plotted with the mean of two biological replicates and smoothed using LOESS method by GraphPad Prism. c Snapshots of ADCP1 and H3K9me2 signals in selected chromosome arm (chr3: 9600-9800) and pericentromeric region (chr1: 13900-14500). H3K9me2 and GFP ChIP-seq signals are showed as reads per kilobase per million mapped reads (RPKM). GFP ChIP-seq in Col-0 is shown as the negative control. d Heatmaps of H3K9me2 and ADCP1 ChIP-seq enrichment in ADCP1-bound sites (top) and H3K9me2-bound sites (bottom). Each row represents a 6-kb window centred on peak midpoints. ADCP1 and Col-0 are showed as log2 (GFP ChIP/input), H3K9me2 is showed as log2 (H3K9me2/H3). e Metaplots of ADCP1 ChIP-seq signal in H3K9me2-marked regions. f Metaplots of H3K9me2 level in ADCP1-enriched peaks. g-h Metaplots of ADCP1 ChIP-seq signals in TEs (g) and in the protein coding genes (h). All metaplots are plotted with mean values and the shadow means the standard deviation of two biological replicates
Fig. 4
Fig. 4
ADCP1 is required for heterochromatin formation. a Relative frequencies of decondensed, partially decondensed (intermediate), or wild-type chromocenters in DAPI-stained nuclei of wild-type Col-0, adcp mutants and ADCP1/ADCP1M complementary plants. N = 150. Representative nuclear condensation status stained with DAPI is showed on the left. Bar = 2 μm. b Transient expression of 35 S:ADCP1: GFP or 35 S:ADCP1M: GFP in protoplasts of Col-0 and suvh456. After 14 h of protoplasts transformation, GFP signals were observed (showed in green, and DAPI is blue). Bar = 2μm. c H3K9me2 western blot in Col-0 and adcp1 mutants. d H3K9me2 immunostaining in Col-0, adcp mutants and ADCP1/ADCP1M complementary plants. Bar = 2 μm. e Quantification of H3K9me2 immunostaining in panel d, the intensity is normalized to the nuclear area. N = 50. The black line represents mean ± SD. The red circles and gray circles are two independent experiments. P values from one-way ANOVA analysis are reported. Three biological replicates were performed for all figures
Fig. 5
Fig. 5
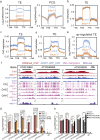
ADCP1 regulates H3K9me2 and CHG/CHH methylation levels and TE silencing. a Metaplots of H3K9me2 level in TEs (left) and protein coding genes (PCG, right) in Col-0 and adcp1-1. The shadow means the standard deviation of two biological replicates. bd Metaplots of CG methylation (b), CHG (c) and CHH (d) in TEs. e Metaplot of H3K9me2 level in up-regulated TEs. All metaplots are plotted with mean values. The shadow means the standard deviation of two biological replicates. f Snapshots of all sequencing data at three selected transposon elements. ChIP-seq and RNA-seq signals are shown as RPKM, DNA methylation is shown by the ratio of methylated cytosine to all cytosine. g, h Validation of selected up-regulated TEs in Col-0, adcp mutants and ADCP1/ADCP1M complementary plants by RT-qPCR. PCR using primers of AT3TE6809 with templates of minus RT (-RT) was used as a negative control. The relative expression to UBC and GAPDH gene is normalized to that in Col-0. Data were shown as log2 (fold change + 1). Error bars indicate standard deviations of 6 replicates, including 2 biological replicates with 3 technical replicates. The circles represent the original data. One-way ANOVA was used for the statistical analysis, P < 0.0001(****)
Fig. 6
Fig. 6
ADCP1 drives multivalent H3K9me3 nucleosome array phase separation. a The phase separation of ADCP1 full length, Agenet domain 1-4 and Agenet domain 3-6 protein only, bar = 20 μm. b Electron microscope image of native, H3K9me3 and H3K9me3S10A NA, bar = 100 nM. c Droplets formation of HP1A, HP1αwith H3K9me3 NA. HP1A, HP1α were labelled with Alex 568, while the NA was strained by DAPI. Bar = 20 μm. d Phase separation of ADCP1 with H3K9me3 NA. ADCP1 was labelled by Alex 488, while the NA was strained by DAPI. Bar = 20 μm. e The concentration dependence of phase separation. Bar = 20 μm. The merged images with Alex 488 fluorescence and DAPI staining were shown. f The FRAP of the droplets. Five droplets were bleached with 488 laser and the percentage of recovery was recorded. One of the five droplets was imaged to show the dynamic. g The phase separation of Aurora B treated H3K9me3 NA and H3K9me3S10A NA with ADCP1. Bar = 20 μm. h Western blots of H3K9me3 NA before and after aurora B treatment

Comment in

  • ADCP1: a novel plant H3K9me2 reader.
    Harris CJ, Jacobsen SE. Harris CJ, et al. Cell Res. 2019 Jan;29(1):6-7. doi: 10.1038/s41422-018-0119-2. Cell Res. 2019. PMID: 30514899 Free PMC article. No abstract available.

Similar articles

Cited by

References

    1. Grewal SI, Jia S. Heterochromatin revisited. Nat. Rev. Genet. 2007;8:35–46. doi: 10.1038/nrg2008. - DOI - PubMed
    1. Allshire RC, Madhani HD. Ten principles of heterochromatin formation and function. Nat. Rev. Mol. Cell Biol. 2018;19:229–244. doi: 10.1038/nrm.2017.119. - DOI - PMC - PubMed
    1. Maison C, Almouzni G. HP1 and the dynamics of heterochromatin maintenance. Nat. Rev. Mol. Cell Biol. 2004;5:296–304. doi: 10.1038/nrm1355. - DOI - PubMed
    1. Lachner M, O’Carroll D, Rea S, Mechtler K, Jenuwein T. Methylation of histone H3 lysine 9 creates a binding site for HP1 proteins. Nature. 2001;410:116–120. doi: 10.1038/35065132. - DOI - PubMed
    1. Bannister AJ, et al. Selective recognition of methylated lysine 9 on histone H3 by the HP1 chromo domain. Nature. 2001;410:120–124. doi: 10.1038/35065138. - DOI - PubMed

Publication types

MeSH terms