. 2018 Nov 13;8(1):16776.
doi: 10.1038/s41598-018-34960-0.

Chemically modified hCFTR mRNAs recuperate lung function in a mouse model of cystic fibrosis

Affiliations

Chemically modified hCFTR mRNAs recuperate lung function in a mouse model of cystic fibrosis

A K M Ashiqul Haque et al. Sci Rep. .

Abstract

Gene therapy has always been a promising therapeutic approach for Cystic Fibrosis (CF). However, numerous trials using DNA or viral vectors encoding the correct protein resulted in a general low efficacy. In the last years, chemically modified messenger RNA (cmRNA) has been proven to be a highly potent, pulmonary drug. Consequently, we first explored the expression, function and immunogenicity of human (h)CFTR encoded by cmRNAhCFTR in vitro and ex vivo, quantified the expression by flow cytometry, determined its function using a YFP based assay and checked the immune response in human whole blood. Similarly, we examined the function of cmRNAhCFTR in vivo after intratracheal (i.t.) or intravenous (i.v.) injection of the assembled cmRNAhCFTR together with Chitosan-coated PLGA (poly-D, L-lactide-co-glycolide 75:25 (Resomer RG 752 H)) nanoparticles (NPs) by FlexiVent. The amount of expression of human hCFTR encoded by cmRNAhCFTR was quantified by hCFTR ELISA, and cmRNAhCFTR values were assessed by RT-qPCR. Thereby, we observed a significant improvement of lung function, especially in regards to FEV0.1, suggesting NP-cmRNAhCFTR as promising therapeutic option for CF patients independent of their CFTR genotype.


Conflict of interest statement

M.S.D.K. holds a patent on RNA modification (EP2459231B1). M.S.D.K., A.H., A.D. and J.S.A., hold a European patent on delivery of cmRNAhCFTR complexed with nanoparticles (17169561.2-1401).

Figures

Figure 1
Figure 1
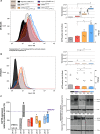
(c)mRNAhCFTR and pDNAhCFTR mediated expression of hCFTR in vitro (A) Total expression of hCFTR (calculated by multiplying positive cells (dots) and MFI (bars)) 24 h after transfection with 1 µg (c)mRNAhCFTR and equivalent nmols of pDNAhCFTR detected by flow cytometry. (B) Total expression of hCFTR 72 h after transfection with 1 µg (c)mRNAhCFTR and equivalent nmols of pDNAhCFTR detected by flow cytometry. (C) Western Blots, semi-quantifying human CFTR in transfected CFBE41o- cells, normalized to GAPDH and put relative to CFTR levels in 16HBE14o- cells. Blot section cropped from different blots are delineated with clear dividing lines (black) and full blot of same exposure time (30 mins) are depicted in Supplement Fig. S4. All bar graph data are depicted as means ± SDs while box plots data are depicted as the means ± minimum to maximum values. *P ≤ 0.05 versus unmodified mRNAhCFTR; §P ≤ 0.05 and §§P ≤ 0.01 vs. pDNAhCFTR.
Figure 2
Figure 2
(c)mRNAhCFTR and pDNAhCFTR mediated expression of hCFTR by immunofluorescence and functional hCFTR in vitro and immunogenicity in human whole blood. (A) Detection of hCFTR protein by immunofluorescence (after 24 h), percent of hCFTR expression in pDNAhCFTR or (c)mRNAhCFTR transfected CFBE41o- cells compare to untransfected CFBE41o- and 16HBE14o- cells. Image J has been used for calculating means ± SDs of hCFTR positive cells; (B) Quenching efficacy of pDNAhCFTR or (c)mRNAhCFTR transfected CFBE41o- and CFTR null A549 cells relative to un-transfected controls was measured at 24 h, 48 h and 72 h post-transfection. *P ≤ 0.05 versus un-transfected controls; (C) 2 ml whole blood, each from three different healthy human donors, were incubated with either R848 (1 mg/ml) or 7 pmol pDNAhCFTR or 7 pmol (c)mRNAhCFTR (providing the same total number of nucleic acid molecules) and NPs at a 1:10 ratio; after 6 h and 24 h the immune response was determined by ELISA in the sera; The blue area represents the variance of the negative controls which are biological replicates. n.d., not detectable and red dotted lines mark the detection limit as specified in the respective ELISA kit. All bar graph data are depicted as means ± SDs while box plots data are depicted as the means ± minimum to maximum values. *and §P ≤ 0.05 (§§P ≤ 0.01) versus control at 6 h and 24 h, respectively.
Figure 3
Figure 3
In vivo lung function measurements in cmRNAhCFTR and pDNAhCFTR treated Cftr−/− mice by i.v. route. All mouse groups utilized in (B–D) are color-coded for their treatment schemes (A), including dosage and application routes. (B–D) Precision in vivo lung function measurements covering all relevant outcome parameters on in Cftr−/− mice treated twice via i.v. route and measured 72 hours after the 2nd instillment; n = 4–7 mice per group. The blue area represents the variance of the negative controls which are biological replicates. Data represent the means ± SD on compliance, resistance and Forced Expiratory Volume in 0.1 seconds (FEV0.1). *P ≤ 0.05; **P ≤ 0.01 and ***P ≤ 0.001 versus untreated Cftr−/− mice.
Figure 4
Figure 4
In vivo lung function measurements in cmRNAhCFTR and pDNAhCFTR treated Cftr−/− mice by i.t. route. All mouse groups utilized in (B–D) are color-coded for their treatment schemes (A), including dosage and application routes. (B–D) Precision in vivo lung function measurements covering all relevant outcome parameters on Cftr−/− mice treated twice via i.t route and measured 72 hours after the 2nd instillment; n = 4–7 mice per group. The blue area represents the variance of the negative controls which are biological replicate. Data represent the means ± SD on compliance, resistance and Forced Expiratory Volume in 0.1 seconds (FEV0.1). *P ≤ 0.05; **P ≤ 0.01 and ***P ≤ 0.001 versus untreated Cftr−/− mice.
Figure 5
Figure 5
In vivo saliva chloride concentration measurement of cmRNAhCFTR and pDNAhCFTR treated Cftr−/− mice by i.v./ i.t. route (A,B) Functional test of reconstituted CFTR channel and reduced chloride concentration after i.v. (A) or i.t. (B) treatment of Cftr−/− mice compared to untreated Cftr−/− (black), positive controls (violet), and percentages relative to the positive control; n = 4 mice per group; two mock controls were included (white); boxes represent the means ± minimum and maximum values. The blue area represents the variance of the negative controls which are biological replicates. *P ≤ 0.05; **P ≤ 0.01 versus untreated Cftr−/− mice.
Figure 6
Figure 6
Expression of hCFTR protein in mouse lungs and delivery of cmRNAhCFTR and pDNAhCFTR in lungs. (A,D) All mouse groups, particles and particle combinations depicted in the study plan are color-coded for their treatment schemes, including dosage and application routes. (B,E) hCFTR ELISA, detecting specifically human CFTR, was performed on lung preparations at day 6 from Cftr−/− mice treated twice via i.v. (B) or i.t. (E) route and measured 72 hours after the 2nd instillment (endpoint); the same n = 4–7 mice per group were used. (C,F) Relative amounts of differently modified hCFTR mRNAs in the lungs applied i.v. or i.t., then determined by RT-quantitative PCR, compared to untreated Cftr−/− mice (*P ≤ 0.05); n = 4–7 mice per group. All bar graph data are depicted as means ± SDs while box plots data are depicted as the means ± minimum to maximum values. The blue area represents the variance of the negative controls which are biological replicates. *P ≤ 0.05; **P ≤ 0.01 and ***P ≤ 0.001 versus untreated Cftr−/− mice.
Figure 7
Figure 7
(c)mRNAhCFTR and pDNAhCFTR mediated immunogenicity in vivo Mice were i.v. or i.t. injected with a mix of (c)mRNA and NPs at a 1:10 ratio and ELISAs were performed post-i.v./i.t.-injection at three different time points. n.d., not detectable. The red dotted lines in (A,B) mark the detection limit as specified in the respective ELISA kit. All bar graph data are depicted as the means ± SD and box plots data are represented as the means ± minimum to maximum values.

Similar articles

Cited by

References

    1. Brown SD, White R, Tobin P. Keep them breathing: Cystic fibrosis pathophysiology, diagnosis, and treatment. JAAPA: official journal of the American Academy of Physician Assistants. 2017;30:23–27. doi: 10.1097/01.jaa.0000515540.36581.92. - DOI - PubMed
    1. Cutting GR. Cystic fibrosis genetics: from molecular understanding to clinical application. Nat Rev Genet. 2015;16:45–56. doi: 10.1038/nrg3849. - DOI - PMC - PubMed
    1. Mall MA, Galietta LJV. Targeting ion channels in cystic fibrosis. Journal of Cystic Fibrosis. 2015;14:561–570. doi: 10.1016/j.jcf.2015.06.002. - DOI - PubMed
    1. Havermans T, Colpaert K, Vanharen L, Dupont LJ. Health related quality of life in cystic fibrosis: To work or not to work? J Cyst Fibros. 2009;8:218–223. doi: 10.1016/j.jcf.2009.03.002. - DOI - PubMed
    1. Cohen MA, Ribeiro MA, Ribeiro AF, Ribeiro JD, Morcillo AM. Quality of life assessment in patients with cystic fibrosis by means of the Cystic Fibrosis Questionnaire. J Bras Pneumol. 2011;37:184–192. doi: 10.1590/S1806-37132011000200008. - DOI - PubMed

Publication types

Substances