. 2018 Nov 9;8(1):16646.
doi: 10.1038/s41598-018-34616-z.

Cryptic binding sites become accessible through surface reconstruction of the type I collagen fibril

Affiliations

Cryptic binding sites become accessible through surface reconstruction of the type I collagen fibril

Jie Zhu et al. Sci Rep. .

Abstract

Collagen fibril interactions with cells and macromolecules in the extracellular matrix drive numerous cellular functions. Binding motifs for dozens of collagen-binding proteins have been determined on fully exposed collagen triple helical monomers. However, when the monomers are assembled into the functional collagen fibril, many binding motifs become inaccessible, and yet critical cellular processes occur. Here, we have developed an early stage atomic model of the smallest repeating unit of the type I collagen fibril at the fibril surface that provides a novel framework to address questions about these functionally necessary yet seemingly obstructed interactions. We use an integrative approach by combining molecular dynamics (MD) simulations with atomic force microscopy (AFM) experiments and show that reconstruction of the collagen monomers within the complex fibril play a critical role in collagen interactions. In particular, the fibril surface shows three major conformational changes, which allow cryptic binding sites, including an integrin motif involved in platelet aggregation, to be exposed. The observed dynamics and reconstruction of the fibril surface promote its role as a "smart fibril" to keep certain binding sites cryptic, and to allow accessibility of recognition domains when appropriate.


Conflict of interest statement

The authors declare no competing interests.

Figures
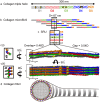
Figure 1
Figure 1
Type I Collagen structural hierarchy. (a) Collagen monomer: The type I collagen monomer is a heterotrimer triple helix consisting of two α1 and one α2 chains with approximate dimensions of 300 × 1.5 nm. The monomer is divided into five D-segments with D1–D4 having a length of 67 nm and D5 equal to 0.46D. (b) Microfibril: Five monomers pack in parallel and stagger by one D-period into microfibrils. Based on PDB: 3HR2. (c) Smallest repeating unit (SRU): Isolating one D-period length of the microfibril gives the SRU, which contains the entire sequence of all five D-segments of the monomer in the configuration of the microfibril bundle. (ci) All-atom model of SRU rendered by VMD (http://www.ks.uiuc.edu/Research/vmd/). (cii) Three replicates of the SRU along the b-axis are created to define a representative fibril surface, shown in longitudinal view (right) and cross-section view (left). The short D5 divides the D-period into two regions; the “overlap” region contains segments D1 to D5, while the “gap” region only contains D1 to D4. In a and c, integrin binding motifs are indicated in yellow. (d) Fibril: The alternating overlap and gap regions create the characteristic “bright and dark” D-banding pattern viewed by electron microscopy when the collagen fibril is stained with heavy metal. The concentric packing of collagen monomers within a single fibril for the overlap region is viewed in the cross-section. Colored circles represent the estimated positions of collagen monomers on the surface layer and are color-coded by D-segments.
Figure 2
Figure 2
Three major movements observed during the 250-ns MD simulation. Snapshots from the starting (0 ns) and ending (250 ns) time points are shown. D-segments are color-coded: D1- gray, D2- red, D3- green, D4- blue, and D5- orange. (a) Longitudinal view of the full D-period model. The C-telopeptide on the D5-segment shifts N-terminally, exposing sites on D4 previously hidden by the C-telopeptide. The edge of D5 is indicated by the solid yellow line in both snapshots. The dashed line at 250 ns demarcates the edge of D5 at 0 ns. The four transparent slices are shown as cross-section view in panels b and c. (b) Cross-sectional views of slices taken at 10–12 nm from the N-terminus along the c-axis. The downward displacement of D5 from its starting position is indicated by black lines in the same manner of those in panel a. Motions in the middle of D5 open a cavity that allows access to D4. (c) Cross-sectional views of slices taken at 44–46 nm from the N-terminus along the longitudinal axis in the gap region. The surface layer of the gap region contracts inward toward the core, exposing the originally partially hidden D2 and expelling waters (cyan) from within the surface layer. Solid black lines demarcate boundaries of the surface layers and the core layer at the time point indicated. Dashed black lines show the original position of the layer boundary. Boxes on the right of panels a, b and c indicate the orientation of the 3a3b fibril model, with the gray sides representing the surfaces and the blue plane representing a cross-section slice.
Figure 3
Figure 3
Internal motions within the fibril model. (a) Root-mean-square deviation (RMSD) during the 250-ns MD simulation of D-segments 1–5 within the core layer (black) and surface layer (color-coded as in Figs 1,2). (b) Root-mean-square fluctuation (RMSF) of D-segments 1–5 over the time of the simulation. RMSF of surface layer (colored) and core layer (black) are overlaid and aligned by distance from the N-terminus in the SRU.
Figure 4
Figure 4
Hydrogen bond (H-bond) modulations in the MD simulation. (a) Protein–protein and (b) protein–water H-bonds per residue in the fully solvated collagen fibril model through the MD simulations. (c) Buildup of side chain involved intra- (solid) and inter- (dashed) triple helix protein–protein H-bonds per residue.
Figure 5
Figure 5
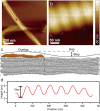
Measuring height difference between overlap and gap regions. (a,b) AFM height images of type I collagen fibrils with dimensions of (a) 2 µm × 2 µm and (b) 250 nm × 250 nm. (c) Schematic describing how the AFM height profile relates to the overlap and gap regions of the collagen fibril. D5 on the surface in the overlap region is colored orange. The step-height is the height difference between the peak of the overlap and the valley of the gap. (d) The height profile taken along the red arrow in (a). The height profile has a periodicity ≈67 nm, consistent with the D-period of the collagen fibril model.
Figure 6
Figure 6
8.0Å SASA of surface A of the fibril model at 0 ns, 64 ns, and 250 ns time points of the MD simulation (a). (b,c) Longitudinal view of the fibril model highlighting residues with 8.0 Å SASA higher than 15 Å2 in (b) the starting model and (c) at 250 ns. Although invisible in the starting model, D4 (blue) in the overlap region and parts of D2 (red) and D3 (green) in the gap region become accessible due to fibril surface reconstruction.
Figure 7
Figure 7
Measuring accessibility of a major ligand binding region on the D4-segment that contains an integrin αI domain binding site. (a) 8.0 Å SASA at 0 ns, 64 ns, 120 ns, and 250 ns MD simulation time of the overlap region of D4. The integrin αI domain binding site, GQRGER, is highlighted by the gray box. (b) Cross-sectional view of the GQRGER αI domain binding site on D4 (gray box in panel a), nine residues deep along the longitudinal axis, at 0 ns (starting model) and 120 ns (maximal accessibility of this site). GQRGER on the D4-segment is blue and the neighboring C-telopeptide on the D5-segment is orange. The integrin α2I domain is shown in black (PDB ID: 1aox). In the starting structure, the C-telopeptide immediately on the fibril surface is obstructing αI access to GQRGER. However, after 120 ns, the C-telopeptide is translated longitudinally, and out of the cross-sectional slice, allowing αI access to the GQRGER binding motif in the fibril.

Similar articles

Cited by

References

    1. Kadler KE, Baldock C, Bella J, Boot-Handford RP. Collagens at a glance. J Cell Sci. 2007;120:1955–8. doi: 10.1242/jcs.03453. - DOI - PubMed
    1. Vogel WF. Collagen-receptor signaling in health and disease. Eur J Dermatol. 2001;11:506–14. - PubMed
    1. Sweeney SM, et al. Candidate cell and matrix interaction domains on the collagen fibril, the predominant protein of vertebrates. J Biol Chem. 2008;283:21187–97. doi: 10.1074/jbc.M709319200. - DOI - PMC - PubMed
    1. Di Lullo GA, Sweeney SM, Korkko J, Ala-Kokko L, San Antonio JD. Mapping the ligand-binding sites and disease-associated mutations on the most abundant protein in the human, type I collagen. J Biol Chem. 2002;277:4223–31. doi: 10.1074/jbc.M110709200. - DOI - PubMed
    1. Hynes RO. Integrins: bidirectional, allosteric signaling machines. Cell. 2002;110:673–87. doi: 10.1016/S0092-8674(02)00971-6. - DOI - PubMed

Publication types